DECODED Technical Analysis DJI (DOW JONES)
What a remarkable historical chart
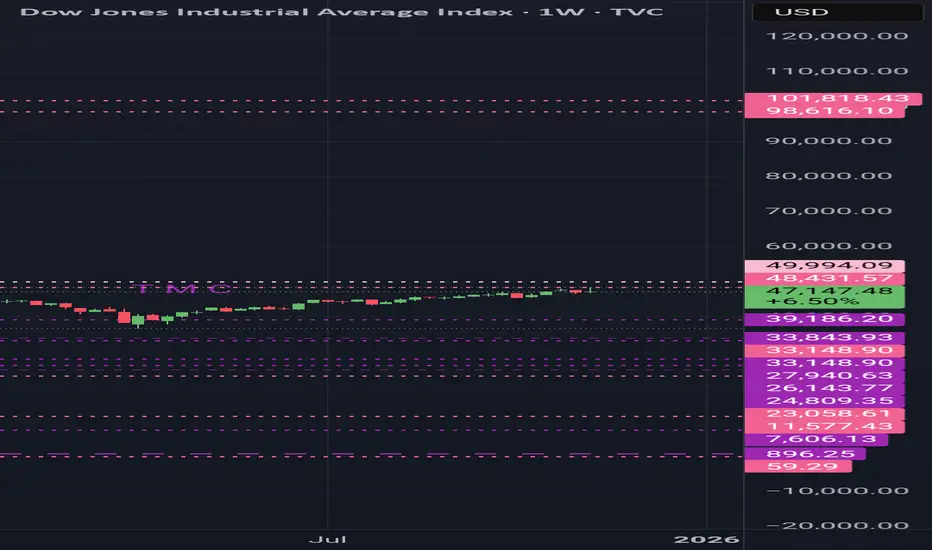
DJI, in its yearly first complete grand pattern, faces strong resistance at $48,431, the previous high, and $49,994, signaling a potential reversal. If not, corrections are at $33,843, $33,148, $27,940, $26,143, and $24,144
If the pattern restores, it could continue to test resistance at $98,616 and $101,818, completing its cycle in 2030/2031.
Lowest skip supports are at $23,000, $11,570, $1,210, and $59. These act like missing pillars; if price moves above them without testing, the structure becomes unstable, and sooner or later, the market will return to test them.
This message is for educational purposes only.
Always DYOR.
What a remarkable historical chart
DJI, in its yearly first complete grand pattern, faces strong resistance at $48,431, the previous high, and $49,994, signaling a potential reversal. If not, corrections are at $33,843, $33,148, $27,940, $26,143, and $24,144
If the pattern restores, it could continue to test resistance at $98,616 and $101,818, completing its cycle in 2030/2031.
Lowest skip supports are at $23,000, $11,570, $1,210, and $59. These act like missing pillars; if price moves above them without testing, the structure becomes unstable, and sooner or later, the market will return to test them.
This message is for educational purposes only.
Always DYOR.
Disclaimer
The information and publications are not meant to be, and do not constitute, financial, investment, trading, or other types of advice or recommendations supplied or endorsed by TradingView. Read more in the Terms of Use.
Disclaimer
The information and publications are not meant to be, and do not constitute, financial, investment, trading, or other types of advice or recommendations supplied or endorsed by TradingView. Read more in the Terms of Use.