Analysis:
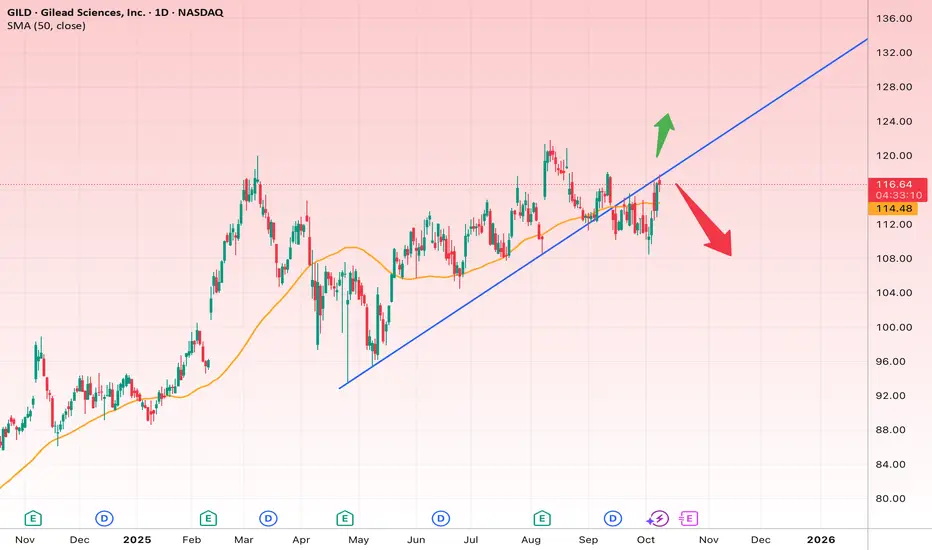
The daily chart of Gilead Sciences (GILD) shows that the stock, after a short-term correction, is once again approaching its main uptrend line (blue). The 50-day moving average (orange) around $114.50 acts as a key support level, and the current price is trading slightly above it.
At this stage, the stock sits at a decisive point — it could either reclaim its bullish momentum by breaking above resistance or enter a deeper corrective phase if support fails.
Short-term outlook (2–4 weeks):
If the price manages to hold above $118, the next upside targets are in the $119.80–$124.80 range. This area represents the short-term bullish objective.
A reasonable stop loss for this scenario is just below $114.
Long-term outlook (2–3 months):
If the stock breaks decisively above $125 and maintains that momentum, the next major targets would be in the $130–$134 range, which also aligns with the previous highs.
However, if the blue uptrend line breaks down and a daily candle closes below $113, a bearish move toward the $106–$108 range becomes likely. In that bearish scenario, the stop loss should be placed above $113.
Overall, GILD is at a decision point. As long as it trades above $114, the bullish outlook remains valid — but losing that support could shift the balance in favor of the bears.
Disclaimer
The information and publications are not meant to be, and do not constitute, financial, investment, trading, or other types of advice or recommendations supplied or endorsed by TradingView. Read more in the Terms of Use.
Disclaimer
The information and publications are not meant to be, and do not constitute, financial, investment, trading, or other types of advice or recommendations supplied or endorsed by TradingView. Read more in the Terms of Use.