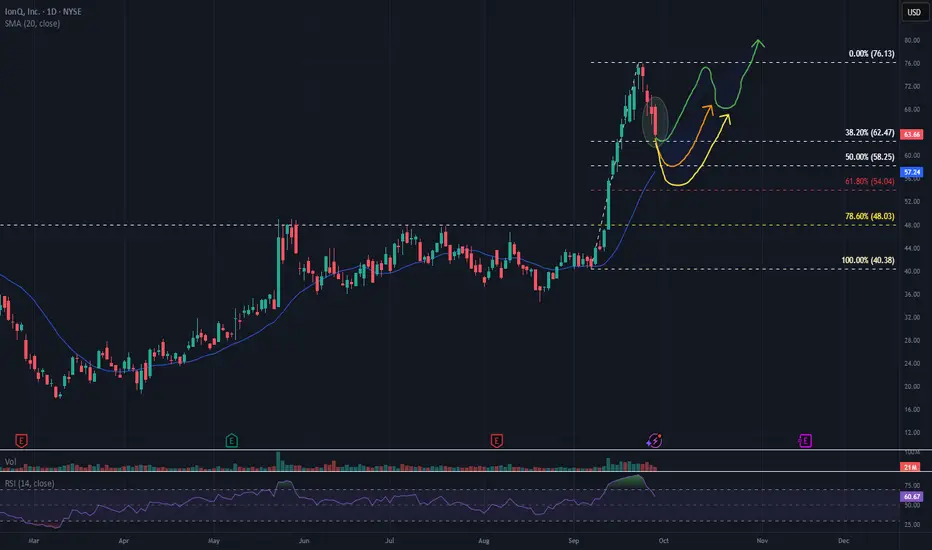
This chart of IonQ, Inc. (NYSE: IONQ) outlines a technical setup identifying three potential buy zones based on Fibonacci retracement levels and anticipated recovery paths:
First Buy Zone – 38.60% Retracement ~63$~~
This level may act as initial support. A bounce here could signal early recovery, especially if volume confirms buying interest.
Second Buy Zone – 50.00% Retracement ($58~~)
Highlighted by a yellow arrow, this zone suggests a short-term dip before a potential rebound. It aligns with a moderate correction and is often considered a strong technical level for accumulation.
Third Buy Zone – 61.80% (54$~~)
This deeper retracement zone is supported by a green arrow, indicating a longer-term recovery path. It may offer a high-reward entry point if the stock stabilizes and RSI confirms oversold conditions.
This analysis is for informational purposes only and does not constitute a recommendation to buy or sell any security. Always conduct your own research or consult a financial advisor before making investment decisions.
Disclaimer
The information and publications are not meant to be, and do not constitute, financial, investment, trading, or other types of advice or recommendations supplied or endorsed by TradingView. Read more in the Terms of Use.
Disclaimer
The information and publications are not meant to be, and do not constitute, financial, investment, trading, or other types of advice or recommendations supplied or endorsed by TradingView. Read more in the Terms of Use.