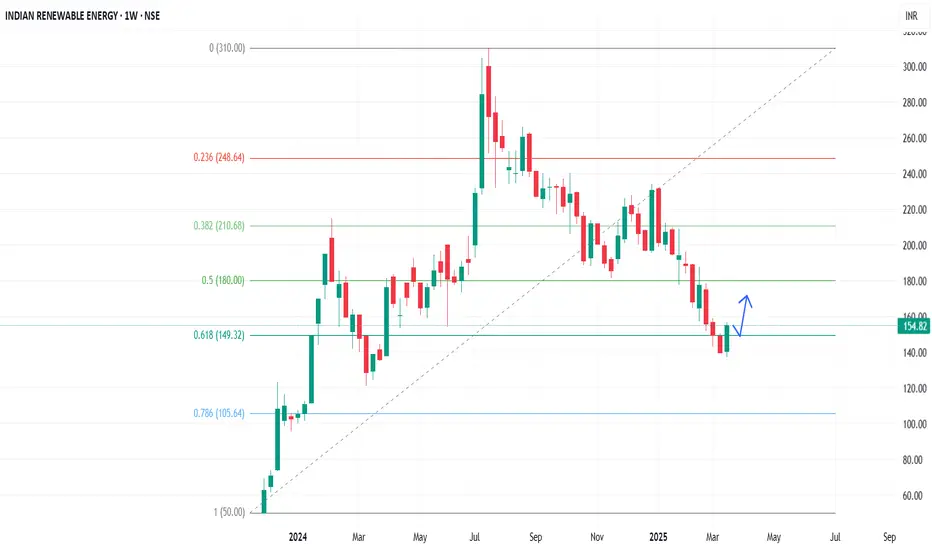
In the Weekly Chart of IREDA ,
we can see that; it a given a comeback from last FIBO level of support after crossing it.
Let it create a Halt candle and take support of FIBO level and then we can see the continuity in momentum.
we can see that; it a given a comeback from last FIBO level of support after crossing it.
Let it create a Halt candle and take support of FIBO level and then we can see the continuity in momentum.
Disclaimer
The information and publications are not meant to be, and do not constitute, financial, investment, trading, or other types of advice or recommendations supplied or endorsed by TradingView. Read more in the Terms of Use.
Disclaimer
The information and publications are not meant to be, and do not constitute, financial, investment, trading, or other types of advice or recommendations supplied or endorsed by TradingView. Read more in the Terms of Use.