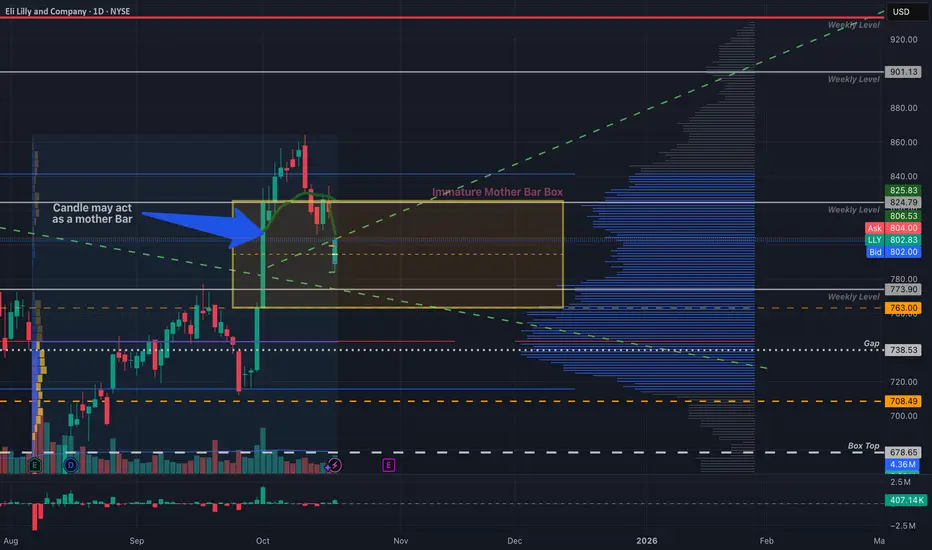
Taking a closer look at the Eli Lilly chart and noticed that there is a box setup forming on the daily time frame. Specifically this box is the product of a mother bar.
If you take a look the last 4 daily candles have more or less traded within the body of the XXL green candle on the left.
I would be mindful of this mother bar/box in the coming week. Don't get too bulllish at the top or two bearish at the bottom.
I suggest also taking a look at SPY's chart as there is a similar pattern forming, albeit a much more defined motherbar.
A look above and fail of $824 could make a great short, or a look below and fail of $763(A+) or $773(B+) is a great long.
The trendline also sits near that low so if the LBAF plays out that is another supporting confluence for this trade.
~The Villain
Related publications
Disclaimer
The information and publications are not meant to be, and do not constitute, financial, investment, trading, or other types of advice or recommendations supplied or endorsed by TradingView. Read more in the Terms of Use.
~The Villain
Related publications
Disclaimer
The information and publications are not meant to be, and do not constitute, financial, investment, trading, or other types of advice or recommendations supplied or endorsed by TradingView. Read more in the Terms of Use.