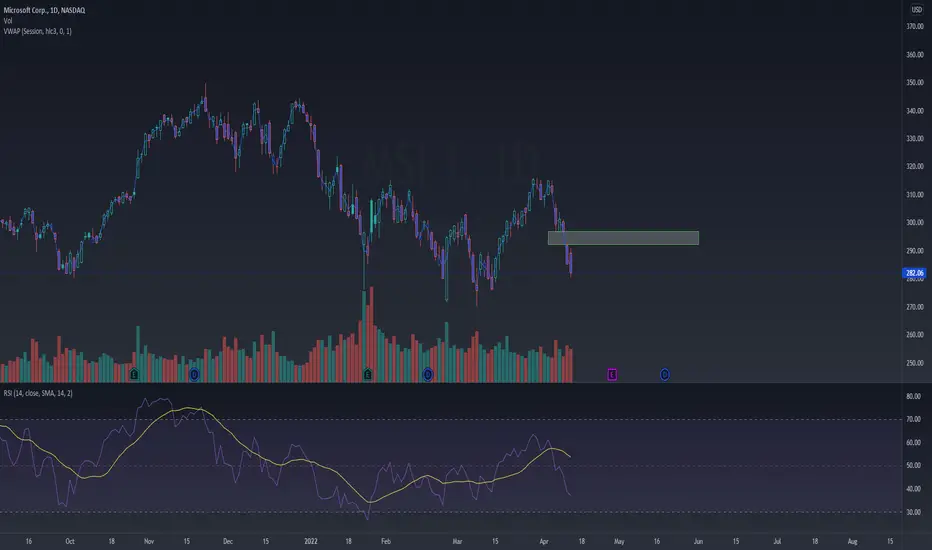
MSFT currently rests almost 20% off from its ATH that it reached in November of last year. It has generally been falling with the market in this larger market wide sell-off. There is also an overhead gap starting at around the 293 range. There is also some potential descending support from a trendline that MSFT may come in contact with, resting around the 270s range. (See chart below).

Is now the time to buy/long MSFT?
Maybe, actually! Let's look at the quant details. Advance notice, this analysis is done 100% based on math and statistics and thus, the most pivotal charts will be the linear graphs I will display below.
First, let us take a look at how MSFT has traded since its nascence in the 80s (chart below):

MSFT started with some great growth at its nasence, followed by a period of pull-back and negative growth spanning roughly from 2000 till 2002, AKA tech bubble burst.
It then began regaining momentum only to be met with some more catastrophe. The 2008 recession. We see this circled in red and it spanned roughly from day 3,000 till day 5000 (December 2007 through till end of 2008).
At about trading day 6,000, which was exactly December 23rd, 2009, SPY had sustainable and fairly regular growth. In fact, between December 2009 and December 2019, MSFT's annualized return rate was just over 17%, with a percent return of 417%. Not abnormal for a growth stock, but definitely outperforming the market.
We see true exponential growth on MSFT around day 8,000, which is December 4th, 2017, where this growth continues until recently when we have had this pull back. SO let us look at MSFT using TradingViews regression tool on the monthly time frame:

It looks overly extended, right?
Well, no! Actually, no. So this is where it gets interesting/tricky. There is generally no argument that stocks underwent massive inflation during QE. However, MSFT was already growing exponentially since 2017, WAY before QE. Furthermore, MSFT has consistently outperformed the market POST 2010. So, we have to be very careful in setting bearish targets here and in assessing what exactly constitutes sizeable pullback.
If we filter out the noise of the tech bubble crash and the 2008 recession, and include all data on MSFT from 2017 until today, this is what the chart looks like:

Have you ever seen anything more beautiful? As a statistician, this is a piece of art right here. LOL!
You can see, MSFT was already in a healthy uptrend WAY before QE. QE exacerbated it but during this years bear run, we saw pull back, back to the linear mean followed by a return to its normal range.
The reality is, the correction on MSFT is over. It is corrected. It is now trading within its predicted behaviour based on 2017 to current day data.
The range that this chart predicted for this week was 275 - 295. We have been trading in this range.
Now I say MSFT has corrected and I actually truly mean this. MSFT has mathematically corrected. It has. You may be bearish on this, you may think this is going to sell off more, and yes, its all extremely possible. But as far as math is concerned, MSFT has officially corrected and regressed back to its normal trading range.
Now, you may say "WOOP WOOP YOLO LONG BABY!", but the million dollar question is this:
Are we actually going into a bear market?
Because you see, MSFT is not immune to catastrophe. We saw sustained selling during the tech bubble pop and we saw sustained selling during the 2008 crises. Now, unfortunately MSFT wasn't a thing in the 70s and neither were tech stocks, so I cannot compare how those fared during inflationary periods. However, we need to really think whether or not its over and we can resume our way.
Based on my analysis (which I did as a previous post), inflation DOES NOT halt growth of stocks. It doesn't. I will link this post below. I have run the numbers, so I am skeptical if someone argues "inflation will cause this to decline", because I just didn't see that in running the numbers in my little study. But we need to think about how the global and economic circumstances may affect this stock.
My opinion? Inflation and war are the only things that are concerning right now. And based on my own analyses of inflation and war (which, again, I did a post about for your information), they just don't hurt the market like people think. So I am actually kind of bullish here.
So, ideal entry?
Ideal entry would be 275 because that is the minimum value this model predicts MSFT to be trading in for this week. I think fair entry would be 275 to 280. It predicts MSFT to see the 300s again in just over a month. Could be sooner depending on the conviction from the bulls. But I anticipate SPY to continue to sell off down to at least the 400s again, and you can bet that MSFT is not going to be overly immune to this. This is my only reservation here.
Otherwise, QQQ has also regressed back to its normal trading range and I think tech in general is looking fairly neutral right now. We could also just see a period of consolidation and bouncing around in these lower end ranges for a while, while SPY does its thing. I don't know. Either way, I am actually bullish on this stock and I am inclined to take a long swing position around 280 - 275 if I see it.
I also want to cavet that even if we are entering a bear market, this isn't going to go straight down. There is a time and place for going long and going short, even within bullish markets and bearish markets. So I am still inclined to be long biased at this particular point in time, regardless.
NOT FINANCIAL ADVICE!
Trade your own plan and plan your own trades.
This is strictly informational!
I am not a Technical analyst, economist or finance person. I am just a statistics guy that likes to run numbers.
Use this information at your own risk and at the risk of your wallet either overflowing with money or declaring bankruptcy.
Let me know your comments, questions and criticisms below!
Is now the time to buy/long MSFT?
Maybe, actually! Let's look at the quant details. Advance notice, this analysis is done 100% based on math and statistics and thus, the most pivotal charts will be the linear graphs I will display below.
First, let us take a look at how MSFT has traded since its nascence in the 80s (chart below):
MSFT started with some great growth at its nasence, followed by a period of pull-back and negative growth spanning roughly from 2000 till 2002, AKA tech bubble burst.
It then began regaining momentum only to be met with some more catastrophe. The 2008 recession. We see this circled in red and it spanned roughly from day 3,000 till day 5000 (December 2007 through till end of 2008).
At about trading day 6,000, which was exactly December 23rd, 2009, SPY had sustainable and fairly regular growth. In fact, between December 2009 and December 2019, MSFT's annualized return rate was just over 17%, with a percent return of 417%. Not abnormal for a growth stock, but definitely outperforming the market.
We see true exponential growth on MSFT around day 8,000, which is December 4th, 2017, where this growth continues until recently when we have had this pull back. SO let us look at MSFT using TradingViews regression tool on the monthly time frame:
It looks overly extended, right?
Well, no! Actually, no. So this is where it gets interesting/tricky. There is generally no argument that stocks underwent massive inflation during QE. However, MSFT was already growing exponentially since 2017, WAY before QE. Furthermore, MSFT has consistently outperformed the market POST 2010. So, we have to be very careful in setting bearish targets here and in assessing what exactly constitutes sizeable pullback.
If we filter out the noise of the tech bubble crash and the 2008 recession, and include all data on MSFT from 2017 until today, this is what the chart looks like:
Have you ever seen anything more beautiful? As a statistician, this is a piece of art right here. LOL!
You can see, MSFT was already in a healthy uptrend WAY before QE. QE exacerbated it but during this years bear run, we saw pull back, back to the linear mean followed by a return to its normal range.
The reality is, the correction on MSFT is over. It is corrected. It is now trading within its predicted behaviour based on 2017 to current day data.
The range that this chart predicted for this week was 275 - 295. We have been trading in this range.
Now I say MSFT has corrected and I actually truly mean this. MSFT has mathematically corrected. It has. You may be bearish on this, you may think this is going to sell off more, and yes, its all extremely possible. But as far as math is concerned, MSFT has officially corrected and regressed back to its normal trading range.
Now, you may say "WOOP WOOP YOLO LONG BABY!", but the million dollar question is this:
Are we actually going into a bear market?
Because you see, MSFT is not immune to catastrophe. We saw sustained selling during the tech bubble pop and we saw sustained selling during the 2008 crises. Now, unfortunately MSFT wasn't a thing in the 70s and neither were tech stocks, so I cannot compare how those fared during inflationary periods. However, we need to really think whether or not its over and we can resume our way.
Based on my analysis (which I did as a previous post), inflation DOES NOT halt growth of stocks. It doesn't. I will link this post below. I have run the numbers, so I am skeptical if someone argues "inflation will cause this to decline", because I just didn't see that in running the numbers in my little study. But we need to think about how the global and economic circumstances may affect this stock.
My opinion? Inflation and war are the only things that are concerning right now. And based on my own analyses of inflation and war (which, again, I did a post about for your information), they just don't hurt the market like people think. So I am actually kind of bullish here.
So, ideal entry?
Ideal entry would be 275 because that is the minimum value this model predicts MSFT to be trading in for this week. I think fair entry would be 275 to 280. It predicts MSFT to see the 300s again in just over a month. Could be sooner depending on the conviction from the bulls. But I anticipate SPY to continue to sell off down to at least the 400s again, and you can bet that MSFT is not going to be overly immune to this. This is my only reservation here.
Otherwise, QQQ has also regressed back to its normal trading range and I think tech in general is looking fairly neutral right now. We could also just see a period of consolidation and bouncing around in these lower end ranges for a while, while SPY does its thing. I don't know. Either way, I am actually bullish on this stock and I am inclined to take a long swing position around 280 - 275 if I see it.
I also want to cavet that even if we are entering a bear market, this isn't going to go straight down. There is a time and place for going long and going short, even within bullish markets and bearish markets. So I am still inclined to be long biased at this particular point in time, regardless.
NOT FINANCIAL ADVICE!
Trade your own plan and plan your own trades.
This is strictly informational!
I am not a Technical analyst, economist or finance person. I am just a statistics guy that likes to run numbers.
Use this information at your own risk and at the risk of your wallet either overflowing with money or declaring bankruptcy.
Let me know your comments, questions and criticisms below!
Note
LOL, this moved much quicker than I anticipated.I entered with an avg price of 282.09.
Just scaled out some. My next target is 290 and final target 295.
Fingers crossed that the math holds out here!
Note
Got stopped out. I set a trailing stop to protect my profits at 334, which was the bearish break for today, and it was triggered. Debated re-entering but with SPY's behaviour I think it may end up dragging MSFT down to that 275 mark. Will be looking to re-enter there.Get:
- Live Updates,
- Discord access,
- Access to my Proprietary Merlin Software,
- Access to premium indicators,
patreon.com/steversteves
Now on X!
- Live Updates,
- Discord access,
- Access to my Proprietary Merlin Software,
- Access to premium indicators,
patreon.com/steversteves
Now on X!
Related publications
Disclaimer
The information and publications are not meant to be, and do not constitute, financial, investment, trading, or other types of advice or recommendations supplied or endorsed by TradingView. Read more in the Terms of Use.
Get:
- Live Updates,
- Discord access,
- Access to my Proprietary Merlin Software,
- Access to premium indicators,
patreon.com/steversteves
Now on X!
- Live Updates,
- Discord access,
- Access to my Proprietary Merlin Software,
- Access to premium indicators,
patreon.com/steversteves
Now on X!
Related publications
Disclaimer
The information and publications are not meant to be, and do not constitute, financial, investment, trading, or other types of advice or recommendations supplied or endorsed by TradingView. Read more in the Terms of Use.