A multi-stage forecast model for the US Tech 100 Cash (NASDAQ) based on price cycles and distribution levels, likely derived from Wyckoff - style market phases. Here’s a structured summary:
NASDAQ 100 – Multi-Stage Price Forecast (USD)
Ticker: NASDAQ | Trading Venue: IG
Market Structure Overview
The model is divided into three main phases:
Stage 1 – Accumulation Phase
Stage 2 – Advance Phase
Stage 3 – Distribution Phase
Forecasted Trade & Price Levels
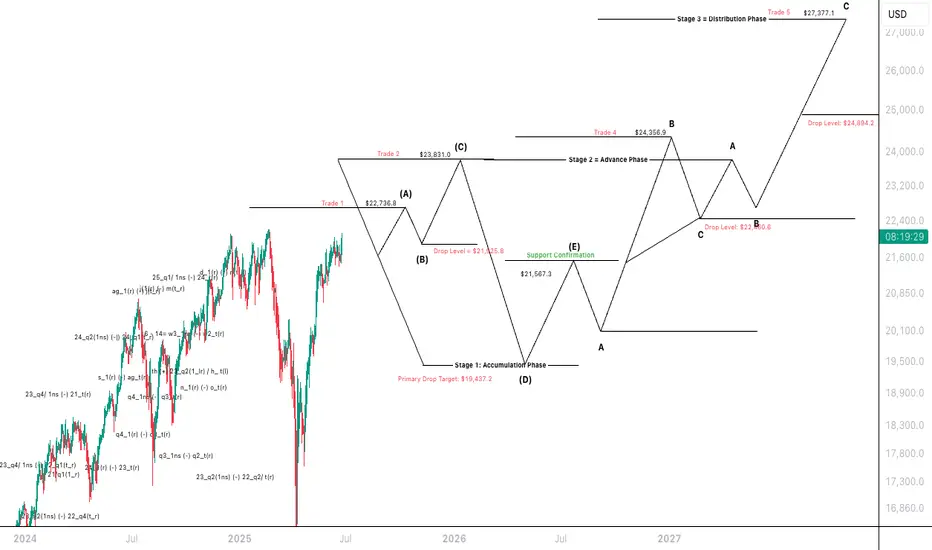
Stage 1: Accumulation Phase
Primary Drop Target: $19,437.2
Intermediate Drop Level: $21,965.8
Support Confirmation: $21,567.3
This stage ends with an upward movement from point (D) to (E), confirming support.
Stage 2: Advance Phase
Begins after Support Confirmation.
Key upward levels:
$22,736.8 → Trade 1
$23,831.0 → Trade 2
$24,366.9 → Trade 4
Drop Level during this phase: $22,480.6
Stage 3: Distribution Phase
Targets higher price levels before a major drop:
Final high: $27,377.1 → Trade 5
Critical drop level: $24,894.2
Cycle-Level Forecasting
Distribution Phase Trigger Level: $22,736.8
2nd Cycle Distribution Levels
$23,831.0
$24,065.4
$24,366.9
$24,856.5
$27,377.1
$28,925.6
$29,956.5
3rd Cycle Forecast (Higher Projections)
$28,874.1
$29,804.1
$30,610.4
$30,845.1
$31,450.0
$30,770.2
4th Cycle Forecast
$31,317.6
$31,810.6
$32,219.6
$32,682.1
$32,870.6
$32,179.6
Interpretation & Implications
This forecast model suggests a major cyclical rise and fall structure.
Each stage (Accumulation → Advance → Distribution) is followed by price drops at defined levels, signalling strategic trade exits or short positions.
The model maps potential entry/exit trades, labelling them Trade 1 to Trade 5.
Anticipates a strong uptrend towards $27K+, followed by corrections at each drop level (e.g., $24,894.2, $22,480.6).
Disclaimer: The following forecast is derived from a proprietary, hand-crafted mathematical model developed independently over several years. It does not rely on traditional indicators, technical patterns, or third-party frameworks such as Elliott Wave Theory.
This model calculates price action based on distribution phases, economic timing cycles, and natural market imbalances.
NASDAQ 100 – Multi-Stage Price Forecast (USD)
Ticker: NASDAQ | Trading Venue: IG
Market Structure Overview
The model is divided into three main phases:
Stage 1 – Accumulation Phase
Stage 2 – Advance Phase
Stage 3 – Distribution Phase
Forecasted Trade & Price Levels
Stage 1: Accumulation Phase
Primary Drop Target: $19,437.2
Intermediate Drop Level: $21,965.8
Support Confirmation: $21,567.3
This stage ends with an upward movement from point (D) to (E), confirming support.
Stage 2: Advance Phase
Begins after Support Confirmation.
Key upward levels:
$22,736.8 → Trade 1
$23,831.0 → Trade 2
$24,366.9 → Trade 4
Drop Level during this phase: $22,480.6
Stage 3: Distribution Phase
Targets higher price levels before a major drop:
Final high: $27,377.1 → Trade 5
Critical drop level: $24,894.2
Cycle-Level Forecasting
Distribution Phase Trigger Level: $22,736.8
2nd Cycle Distribution Levels
$23,831.0
$24,065.4
$24,366.9
$24,856.5
$27,377.1
$28,925.6
$29,956.5
3rd Cycle Forecast (Higher Projections)
$28,874.1
$29,804.1
$30,610.4
$30,845.1
$31,450.0
$30,770.2
4th Cycle Forecast
$31,317.6
$31,810.6
$32,219.6
$32,682.1
$32,870.6
$32,179.6
Interpretation & Implications
This forecast model suggests a major cyclical rise and fall structure.
Each stage (Accumulation → Advance → Distribution) is followed by price drops at defined levels, signalling strategic trade exits or short positions.
The model maps potential entry/exit trades, labelling them Trade 1 to Trade 5.
Anticipates a strong uptrend towards $27K+, followed by corrections at each drop level (e.g., $24,894.2, $22,480.6).
Disclaimer: The following forecast is derived from a proprietary, hand-crafted mathematical model developed independently over several years. It does not rely on traditional indicators, technical patterns, or third-party frameworks such as Elliott Wave Theory.
This model calculates price action based on distribution phases, economic timing cycles, and natural market imbalances.
Institutional Note:
For institutional review, independent verification, or strategic collaboration:
institutions@bmoses.com.au
For institutional review, independent verification, or strategic collaboration:
institutions@bmoses.com.au
Disclaimer
The information and publications are not meant to be, and do not constitute, financial, investment, trading, or other types of advice or recommendations supplied or endorsed by TradingView. Read more in the Terms of Use.