Shares of Nvidia took a hit during Thursday’s session, losing about 1.5%. Technically, the trend remains northbound, though near-term price action has shown a few lower lows and lower highs: early signs of a downtrend.
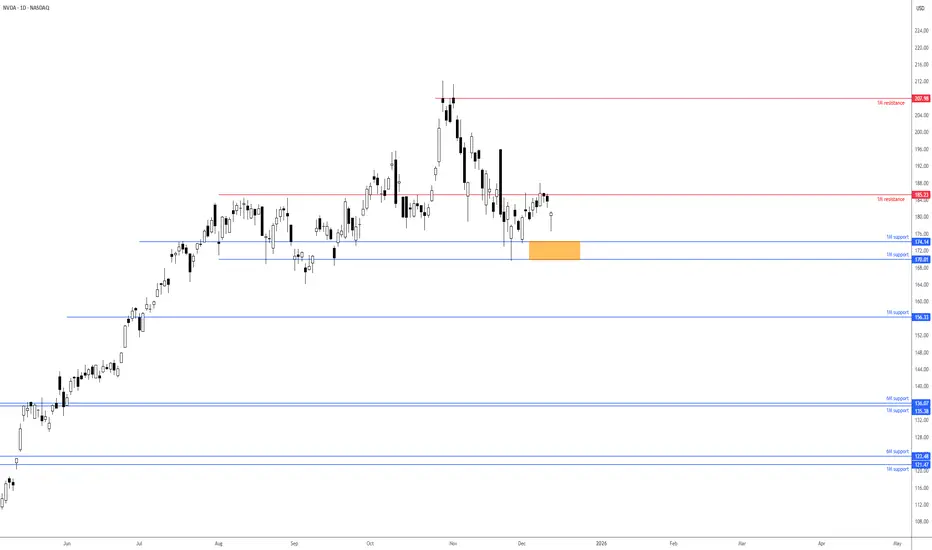
1M resistance recently made a show at US$185.23 and withstood a few upside attempts. 1M support is nearby between US$170.01 and US$174.14, with a break under here unbolting the door to another layer of 1M support from US$156.33. Alternatively, pushing above US$185.23 would help bolster the long-term trend, and potentially attract fresh buying to 1M resistance at US$207.98, closely shadowed by the all-time high of US$212.19.
Ultimately, the direction of travel for this Stock will depend on whether it breaks above resistance at US$185.23, encouraging buying, or below the support zone between US$170.01 and US$174.14, which could prompt further underperformance.
Written by the FP Markets Research Team
Disclaimer
The information and publications are not meant to be, and do not constitute, financial, investment, trading, or other types of advice or recommendations supplied or endorsed by TradingView. Read more in the Terms of Use.
Disclaimer
The information and publications are not meant to be, and do not constitute, financial, investment, trading, or other types of advice or recommendations supplied or endorsed by TradingView. Read more in the Terms of Use.