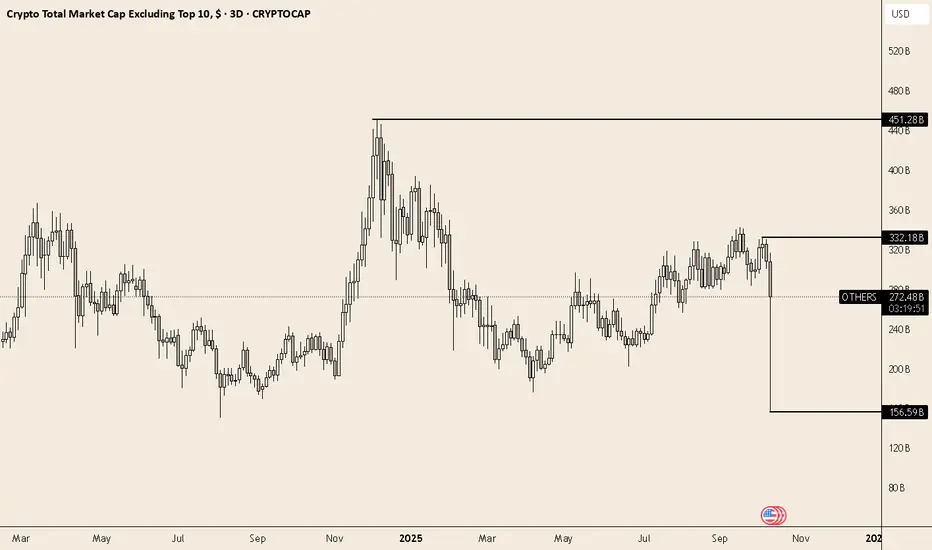
The Total Crypto Market Cap excluding the Top 10 coins shows how extreme Friday’s move really was.
At the beginning of October, the “ OTHERS” segment stood near $332B.
By the end of Friday’s crash, it had dropped to just $156B — a −53% drawdown in a matter of hours, wiping out months of speculative buildup.
Since then, the index has rebounded +73% from the lows, suggesting an aggressive short-covering rally rather than organic accumulation.
🔍 Key zones to watch:
$332B → prior range top / first resistance
$156B → capitulation low / liquidity sweep
The structure remains fragile — higher volatility and thin liquidity can amplify both sides of the move.
Until this chart rebuilds a base above $300B, altcoins remain in a vulnerable phase of the cycle.
At the beginning of October, the “
By the end of Friday’s crash, it had dropped to just $156B — a −53% drawdown in a matter of hours, wiping out months of speculative buildup.
Since then, the index has rebounded +73% from the lows, suggesting an aggressive short-covering rally rather than organic accumulation.
🔍 Key zones to watch:
$332B → prior range top / first resistance
$156B → capitulation low / liquidity sweep
The structure remains fragile — higher volatility and thin liquidity can amplify both sides of the move.
Until this chart rebuilds a base above $300B, altcoins remain in a vulnerable phase of the cycle.
Disclaimer
The information and publications are not meant to be, and do not constitute, financial, investment, trading, or other types of advice or recommendations supplied or endorsed by TradingView. Read more in the Terms of Use.
Disclaimer
The information and publications are not meant to be, and do not constitute, financial, investment, trading, or other types of advice or recommendations supplied or endorsed by TradingView. Read more in the Terms of Use.