Can you really feel the next Bitcoin explosion just by reading the charts?
The market looks calm, but deep down something big is shifting.
When everyone expects a crash, history shows that’s when the biggest moves begin.
Hello✌️
Spend 2 minutes ⏰ reading this educational material.
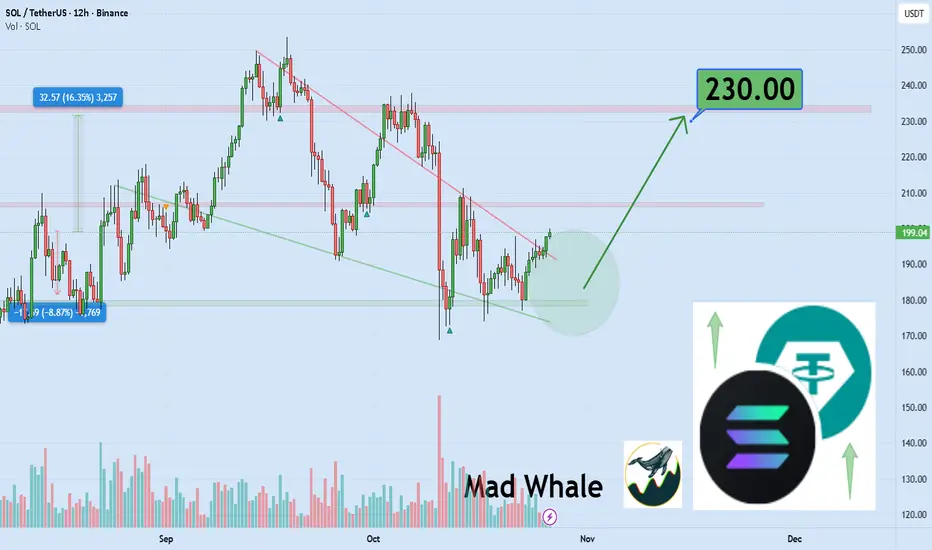
🎯 Analytical Insight on Solana:

 SOLUSDT is testing a key daily support; holding this zone could spark a 16% rally, targeting $230. 📈🛡️
Now, let's dive into the educational section,
🌋 The Calm Before the Storm
The crypto market is like the ocean before a tsunami quiet but full of hidden energy. On higher timeframes, candles look small and boring, yet trading volume is rising. That mix of silence on the surface and pressure underneath is exactly what happens before every strong bull run.
💡 Hidden Clues in Price Behavior
Bitcoin’s price has been building quiet support for weeks, while big transactions are slowly increasing in the background. This usually means that smart investors are buying without drawing attention. Rising volume with little price movement is often the first signal that accumulation has started.
🚀 Bitcoin The Engine of the Next Explosion
In every cycle, Bitcoin moves first. Breaking major resistance levels and holding above them is a sign of growing confidence. When Bitcoin dominance starts to drop and altcoin volume goes up at the same time, that’s when the whole crypto market gets ready for a collective takeoff.
🧠 Trader Psychology During Market Silence
Most traders fear a quiet market, but experienced ones see it as the best setup. When the media talks about stagnation and panic, the big players are quietly building long positions. The difference between average and professional traders is simple: one sees silence as danger, the other as opportunity.
🔍 The Path to Spotting the Next Big Move
To catch the move early, start with volume. When volume rises at support levels without breaking previous lows, it usually means smart money is buying. A positive divergence between price and RSI often appears right before momentum flips. Then watch for a bullish MACD cross on the daily chart when all three signals align, the explosion is close.
⚙️ TradingView Tools That Reveal Market Explosions
TradingView offers powerful tools that can help you detect big moves before they happen.
1. Volume Profile
Shows where most buying and selling happened. Heavy zones are usually where whales make their decisions.
2. MACD
Reveals when market momentum is changing direction. A bullish cross in the negative zone often signals the start of a reversal.
3. RSI
Measures the strength of buyers versus sellers. When RSI breaks above 50, a new bullish phase is often beginning.
4. Alert System
Highly underrated! Set alerts for your favorite indicators so when they align, you get notified instantly.
5. Multi-Timeframe Analysis
Use multiple timeframes to avoid fake signals. Comparing daily and 4-hour charts gives a much clearer picture of big moves.
⚡ Summary
All signs point to a massive move ahead. Bitcoin’s calmness is deceiving, but the data doesn’t lie. Stay patient, follow your signals, and you might witness one of the strongest uptrends in years.
🧭Golden Tips for Smart Traders
Patience beats excitement. The biggest profits go to those who wait for confirmation, not those who rush in
Ignore the crowd’s emotions. When the mood is darkest, opportunities are often the brightest.
Trust the chart, not your fear. The market always tells the truth if you take the time to listen.
✨ Need a little love!
We pour love into every post your support keeps us inspired! 💛 Don’t be shy, we’d love to hear from you on comments. Big thanks, Mad Whale 🐋
📜Please make sure to do your own research before investing, and review the disclaimer provided at the end of each post.
The market looks calm, but deep down something big is shifting.
When everyone expects a crash, history shows that’s when the biggest moves begin.
Hello✌️
Spend 2 minutes ⏰ reading this educational material.
🎯 Analytical Insight on Solana:
Now, let's dive into the educational section,
🌋 The Calm Before the Storm
The crypto market is like the ocean before a tsunami quiet but full of hidden energy. On higher timeframes, candles look small and boring, yet trading volume is rising. That mix of silence on the surface and pressure underneath is exactly what happens before every strong bull run.
💡 Hidden Clues in Price Behavior
Bitcoin’s price has been building quiet support for weeks, while big transactions are slowly increasing in the background. This usually means that smart investors are buying without drawing attention. Rising volume with little price movement is often the first signal that accumulation has started.
🚀 Bitcoin The Engine of the Next Explosion
In every cycle, Bitcoin moves first. Breaking major resistance levels and holding above them is a sign of growing confidence. When Bitcoin dominance starts to drop and altcoin volume goes up at the same time, that’s when the whole crypto market gets ready for a collective takeoff.
🧠 Trader Psychology During Market Silence
Most traders fear a quiet market, but experienced ones see it as the best setup. When the media talks about stagnation and panic, the big players are quietly building long positions. The difference between average and professional traders is simple: one sees silence as danger, the other as opportunity.
🔍 The Path to Spotting the Next Big Move
To catch the move early, start with volume. When volume rises at support levels without breaking previous lows, it usually means smart money is buying. A positive divergence between price and RSI often appears right before momentum flips. Then watch for a bullish MACD cross on the daily chart when all three signals align, the explosion is close.
⚙️ TradingView Tools That Reveal Market Explosions
TradingView offers powerful tools that can help you detect big moves before they happen.
1. Volume Profile
Shows where most buying and selling happened. Heavy zones are usually where whales make their decisions.
2. MACD
Reveals when market momentum is changing direction. A bullish cross in the negative zone often signals the start of a reversal.
3. RSI
Measures the strength of buyers versus sellers. When RSI breaks above 50, a new bullish phase is often beginning.
4. Alert System
Highly underrated! Set alerts for your favorite indicators so when they align, you get notified instantly.
5. Multi-Timeframe Analysis
Use multiple timeframes to avoid fake signals. Comparing daily and 4-hour charts gives a much clearer picture of big moves.
⚡ Summary
All signs point to a massive move ahead. Bitcoin’s calmness is deceiving, but the data doesn’t lie. Stay patient, follow your signals, and you might witness one of the strongest uptrends in years.
🧭Golden Tips for Smart Traders
Patience beats excitement. The biggest profits go to those who wait for confirmation, not those who rush in
Ignore the crowd’s emotions. When the mood is darkest, opportunities are often the brightest.
Trust the chart, not your fear. The market always tells the truth if you take the time to listen.
✨ Need a little love!
We pour love into every post your support keeps us inspired! 💛 Don’t be shy, we’d love to hear from you on comments. Big thanks, Mad Whale 🐋
📜Please make sure to do your own research before investing, and review the disclaimer provided at the end of each post.
Educational plans & Free signals, all in telegram:
👉t.me/madwhalechannel
👉t.me/madwhalechannel
Disclaimer
The information and publications are not meant to be, and do not constitute, financial, investment, trading, or other types of advice or recommendations supplied or endorsed by TradingView. Read more in the Terms of Use.