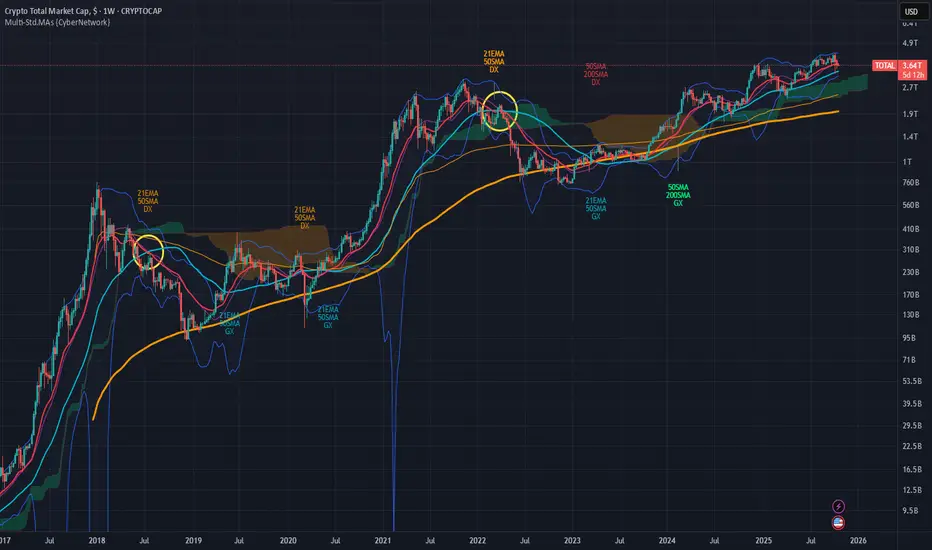
Bull market ends when the RED 21 EMA crosses below the green 50 SMA line on the weekly chart of the Crypto TOTAL Market Cap.
Buying BTC and ETH (and KAS as well after this cycle) aggressively only when price has returned to around the thick orange 200 SMA line, and especially whenever it falls below.
Buying BTC and ETH (and KAS as well after this cycle) aggressively only when price has returned to around the thick orange 200 SMA line, and especially whenever it falls below.
Note
Current daily chart analysisPresently supported above the thin orange 200 VWMA line.
But bullish continuation possible only if it returns to above the green 50 SMA line.
Related publications
Disclaimer
The information and publications are not meant to be, and do not constitute, financial, investment, trading, or other types of advice or recommendations supplied or endorsed by TradingView. Read more in the Terms of Use.
Related publications
Disclaimer
The information and publications are not meant to be, and do not constitute, financial, investment, trading, or other types of advice or recommendations supplied or endorsed by TradingView. Read more in the Terms of Use.