I am honestly not sure what to expect from TSLA on Monday. TSLA is a hard duck to crack. It doesn't follow my calculations well and its so heavily retail traded that makes it really erratic and more favouring of the technical side than the quanitative side (which I trade).
HOWEVER, I have noticed an interesting observation with TSLA from my stats analysis.
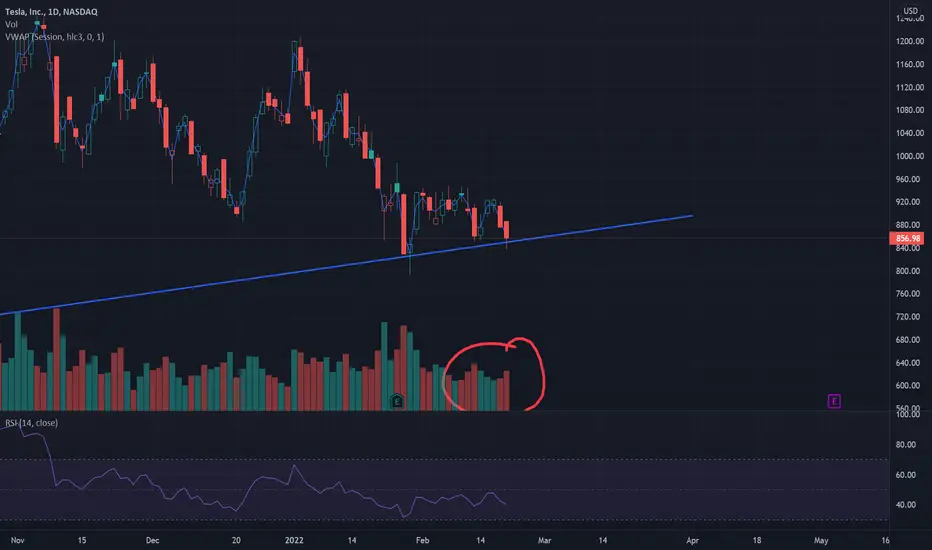
So the general rule in stock trading is volume = more dramatic moves. Many people believe volume = higher levels. This is not true. Volume simply means more dramatic moves in a general direction (be it up or down). For most stocks that I trade (BA, QQQ, SPY, RTX) volume has no relationship between highs or lows. The R value (the value statisticians look at to determine the effect size of a relationship, or in other words, how strong is the relationship between to variables) can indicate what stocks like to do when it has more volume.
For example, for QQQ, when there is a lot of volume, there is no significant favouring of one direction or the other. QQQ is just as likely to make signifciant strides higher than lower and vice versa with high volume. Volume simply means more dramatic moves in a direction, but doesn't signify what direction that is.
With BA, high volume indicates a favouring of the upside, however, not quite significant. So when we see high volume come in on BA, there is a higher probability BA is going to the upside.
However, with TSLA the relationship is inverse and significant. As volume floods in on TSLA, there is a significant favouring of TSLA moving to the downside.
This relationship can be expressed as R = 0.217 to the downside and R=0.037 to the upside.
This difference is hugely significant as far as statistics are concerned and show a dramatic favouring to the downside as volume increases.
What does it mean in laymen's terms?
Essentially, it can be summarized as the following: As volume increases, TSLA's price decreases. This relationship is statistically significant (ANOVA significance 0.000).
How can this help you?
Watch for higher than normal volume on the day. Expect a move to the downside as volume approaches levels of higher than average.
What's TSLA's average volume?
I'll give this to you, seeing as I already have it mapped out in SPSS ;).
TSLA's average daily trading volume over the past year is 26,907,692.
Do with this information as you wish. Its just an interesting observation I made and felt like sharing.
Hope you find it useful!
Take care everyone and enjoy the rest of your weekend!
Happy trading on Monday, should be a good day!
HOWEVER, I have noticed an interesting observation with TSLA from my stats analysis.
So the general rule in stock trading is volume = more dramatic moves. Many people believe volume = higher levels. This is not true. Volume simply means more dramatic moves in a general direction (be it up or down). For most stocks that I trade (BA, QQQ, SPY, RTX) volume has no relationship between highs or lows. The R value (the value statisticians look at to determine the effect size of a relationship, or in other words, how strong is the relationship between to variables) can indicate what stocks like to do when it has more volume.
For example, for QQQ, when there is a lot of volume, there is no significant favouring of one direction or the other. QQQ is just as likely to make signifciant strides higher than lower and vice versa with high volume. Volume simply means more dramatic moves in a direction, but doesn't signify what direction that is.
With BA, high volume indicates a favouring of the upside, however, not quite significant. So when we see high volume come in on BA, there is a higher probability BA is going to the upside.
However, with TSLA the relationship is inverse and significant. As volume floods in on TSLA, there is a significant favouring of TSLA moving to the downside.
This relationship can be expressed as R = 0.217 to the downside and R=0.037 to the upside.
This difference is hugely significant as far as statistics are concerned and show a dramatic favouring to the downside as volume increases.
What does it mean in laymen's terms?
Essentially, it can be summarized as the following: As volume increases, TSLA's price decreases. This relationship is statistically significant (ANOVA significance 0.000).
How can this help you?
Watch for higher than normal volume on the day. Expect a move to the downside as volume approaches levels of higher than average.
What's TSLA's average volume?
I'll give this to you, seeing as I already have it mapped out in SPSS ;).
TSLA's average daily trading volume over the past year is 26,907,692.
Do with this information as you wish. Its just an interesting observation I made and felt like sharing.
Hope you find it useful!
Take care everyone and enjoy the rest of your weekend!
Happy trading on Monday, should be a good day!
Get:
- Live Updates,
- Discord access,
- Access to my Proprietary Merlin Software,
- Access to premium indicators,
patreon.com/steversteves
Now on X!
- Live Updates,
- Discord access,
- Access to my Proprietary Merlin Software,
- Access to premium indicators,
patreon.com/steversteves
Now on X!
Disclaimer
The information and publications are not meant to be, and do not constitute, financial, investment, trading, or other types of advice or recommendations supplied or endorsed by TradingView. Read more in the Terms of Use.