Hello, Professor
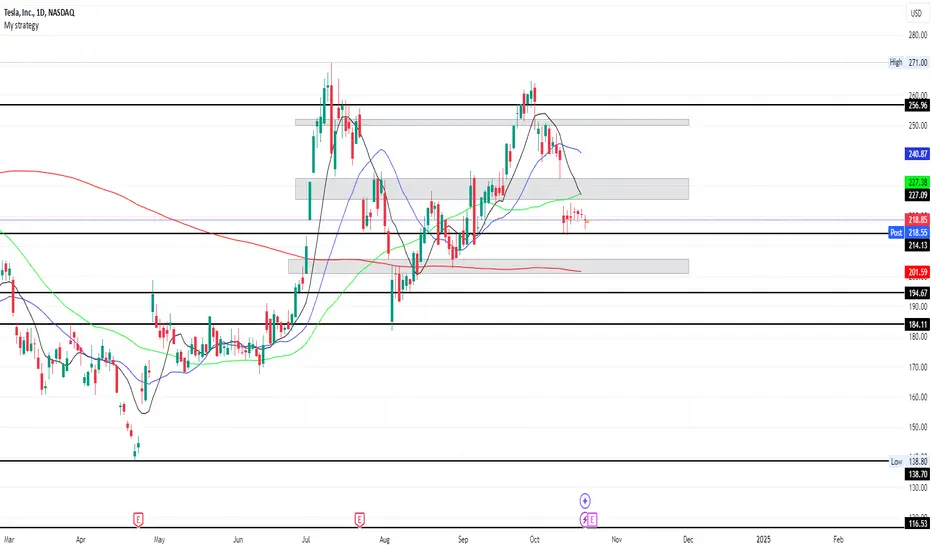
The follow is my current TSLA chart, i started with the levels on the monthly to the daily (black horizontal lines). The grey rectangles are the zones using the most recent TSLA data using the Daily Chart. It probably looks terrible to you, but i am very thankful for you looking at this. I want to learn to fish brother, not just given fish.
The follow is my current TSLA chart, i started with the levels on the monthly to the daily (black horizontal lines). The grey rectangles are the zones using the most recent TSLA data using the Daily Chart. It probably looks terrible to you, but i am very thankful for you looking at this. I want to learn to fish brother, not just given fish.
Disclaimer
The information and publications are not meant to be, and do not constitute, financial, investment, trading, or other types of advice or recommendations supplied or endorsed by TradingView. Read more in the Terms of Use.
Disclaimer
The information and publications are not meant to be, and do not constitute, financial, investment, trading, or other types of advice or recommendations supplied or endorsed by TradingView. Read more in the Terms of Use.