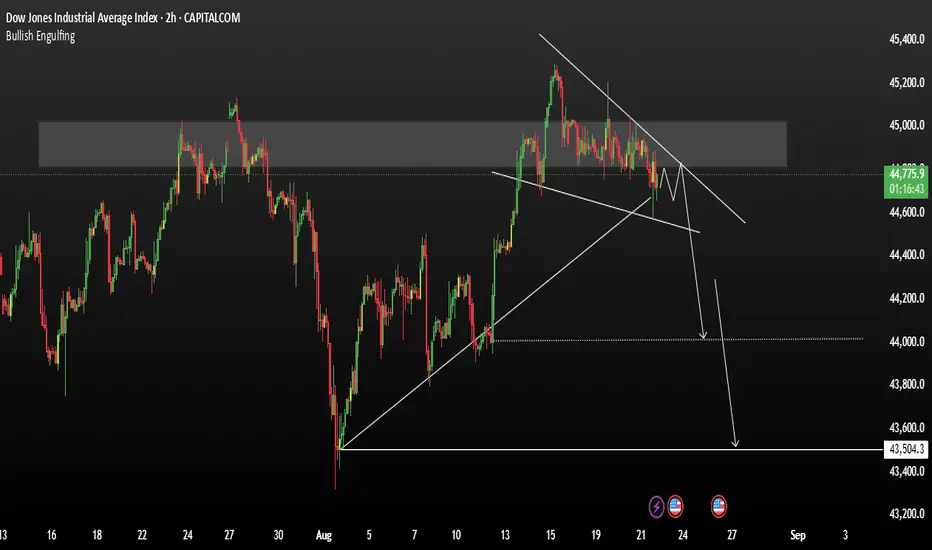
US30 On the left side of the chart, we observed that after breaking below the second major pattern, the US30 experienced a sharp and aggressive decline. A similar structure appears to be forming once again, and notably, the index has just printed another all-time high.
If the price breaks below the current market structure—mirroring the previous breakdown—there is a strong possibility of another significant sell-off. This scenario becomes more likely if we see a clear shift in momentum toward the bearish side.
A confirmed breakdown could trigger a repeat of the past decline, especially if key support levels fail to hold and bearish volume increases.
You may find more details ion the chart.
Trade wisely best of Luck .
Ps; Support with like and comments for better analysis Thanks for supporting.
Join My telegram Channel
t.me/AnalysisGold2
Free Forex Signals
t.me/Jamessignals11
t.me/AnalysisGold2
Free Forex Signals
t.me/Jamessignals11
Related publications
Disclaimer
The information and publications are not meant to be, and do not constitute, financial, investment, trading, or other types of advice or recommendations supplied or endorsed by TradingView. Read more in the Terms of Use.