What if I told you there’s a free, stats-backed tool that shows you where price is likely to stop or reverse — with 68% confidence?
Meet Expected Range (ER) — not a magic bullet, but a massive edge when used right.
✅ Based on CME data & Nobel-winning math
✅ Defines high-probability support/resistance zones
✅ Free from CME website.
I never trade without checking ER anymore.
It turns noise into structure.
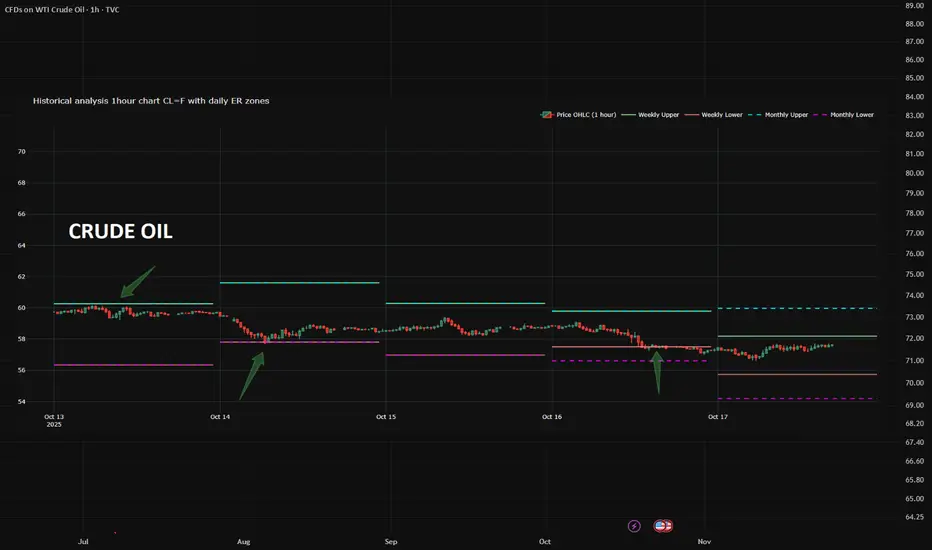
👉 Check the screenshots yourself — see how price reacted at each edge last week.


The only thing you need to do?
→ Grab ER data from the CME website daily
→ Apply a simple conversion formula
→ Plot it on your futures chart
That’s it.
Now you’ve got statistically grounded levels right in front of you.
Depending on your market view, you can:
• Short from the upper ER boundary
• Use it as a trend support entry zone
• Hide stops beyond the range — because price statistically won’t reach them
⚠️ Caveat: ER isn’t a crystal ball.
But in normal markets - ER zones hold ~4 out of 5 times.
Question for you:
Are you using ER? Or still guessing support/resistance?
Transparency first. No hype. Just real results.
Meet Expected Range (ER) — not a magic bullet, but a massive edge when used right.
✅ Based on CME data & Nobel-winning math
✅ Defines high-probability support/resistance zones
✅ Free from CME website.
I never trade without checking ER anymore.
It turns noise into structure.
👉 Check the screenshots yourself — see how price reacted at each edge last week.
The only thing you need to do?
→ Grab ER data from the CME website daily
→ Apply a simple conversion formula
→ Plot it on your futures chart
That’s it.
Now you’ve got statistically grounded levels right in front of you.
Depending on your market view, you can:
• Short from the upper ER boundary
• Use it as a trend support entry zone
• Hide stops beyond the range — because price statistically won’t reach them
⚠️ Caveat: ER isn’t a crystal ball.
But in normal markets - ER zones hold ~4 out of 5 times.
Question for you:
Are you using ER? Or still guessing support/resistance?
Transparency first. No hype. Just real results.
Related publications
Disclaimer
The information and publications are not meant to be, and do not constitute, financial, investment, trading, or other types of advice or recommendations supplied or endorsed by TradingView. Read more in the Terms of Use.
Related publications
Disclaimer
The information and publications are not meant to be, and do not constitute, financial, investment, trading, or other types of advice or recommendations supplied or endorsed by TradingView. Read more in the Terms of Use.