BTCUSDTHello Traders! 👋
What are your thoughts on BITCOIN?
After the recent sharp decline, Bitcoin has entered a clear consolidation range. The upper and lower boundaries of this range are marked on the chart.
As long as price remains inside this range, we should not expect a strong directional move. Instead, price action is likely to remain choppy with back-and-forth movements
At this stage, patience is key. The next meaningful move will likely come only after a confirmed breakout from one of the range boundaries.
Bullish Scenario:
A breakout and 4H close above the resistance zone could trigger upside continuation toward the highlighted target levels.
Bearish Scenario:
A breakdown and close below the support zone could lead to further downside toward the previous low.
Until one of these levels is decisively broken, the market remains range-bound.
Don’t forget to like and share your thoughts in the comments! ❤️
Cryptocurrency

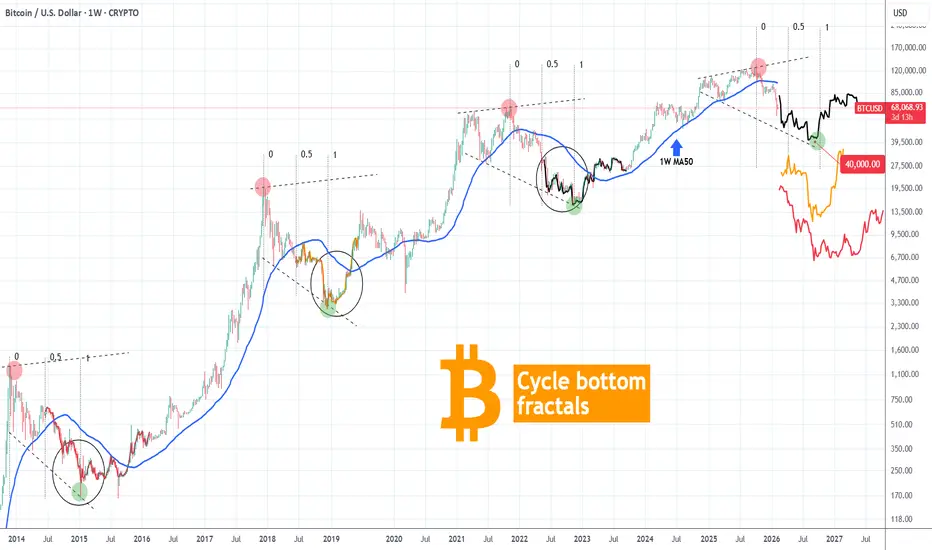
BITCOIN Cycle bottom fractals map the rest of 2026 towards $40k.Bitcoin (BTCUSD) continues to be under heavy pressure despite having the 1W MA200 holding the crash last week. Having long lost its 1W MA50 (blue trend-line), which confirmed the Bear Cycle, we are now approaching its 2nd Phase, which is the bottoming process.
This doesn't mean that the bottom is here but more like that the market is entering a Phase where it will gradually attempt to lead us to the bottom of the 4-year Cycle, which based on it should be around September - October 2026.
Having a look at the past three Bear Cycles and drawing their Phase 2 fractals after the 0.5 Fibonacci level, that led to their bottom, we can see that the structure is quite familiar. Not identical, but similar. All principles are the same and there is a high correlation with the 2022 Bear Cycle in particular.
Even though we haven't yet technically reached the middle (0.5 Fib) of this Bear Cycle, according to that fractal, BTC should start making a series of Lower Lows gradually, that can potentially lead to as low as $40000. That could be the Bear Cycle bottom.
So do you think that's a strong probability for the remainder of 2026? Feel free to let us know in the comments section below!
---
** Please LIKE 👍, FOLLOW ✅, SHARE 🙌 and COMMENT ✍ if you enjoy this idea! Also share your ideas and charts in the comments section below! This is best way to keep it relevant, support us, keep the content here free and allow the idea to reach as many people as possible. **
---
💸💸💸💸💸💸
👇 👇 👇 👇 👇 👇
ZEC/USDT | Zcash Weekly Chart – Next Move Loading?By analyzing the #Zcash chart on the weekly timeframe, we can see that after the massive 3500% rally last year from $20 to $750, price entered a strong corrective phase and recently dropped as low as $186. Right now, demand is stepping back in and ZEC is trading around $237. If price manages to stabilize and hold above the $250 level, we can expect another bullish wave toward higher levels, with potential upside targets at $270, $303, and $360. This analysis will be updated as price continues to react to key levels.
Please support me with your likes and comments to motivate me to share more analysis with you and share your opinion about the possible trend of this chart with me !
Best Regards , Arman Shaban

GOLD slowly climbing. GOLD is in the move UP. We will wait to hit RESISTANCE and then go in LONG if a BreakOut happens next week.

BTC Structure Update — No ChangeStructure remains under pressure.
On the daily BTCUSD chart, price continues to trade below the 20 / 50 EMA stack, with the 50 EMA sloping downward and acting as dynamic resistance. Recent candles are attempting a minor rebound, but no structural reclaim has occurred.
What remains unchanged:
• Lower highs remain intact
• Price is still below key moving averages
• RSI remains suppressed in the lower range
• ROC is negative despite short-term stabilization
This is digestion — not reversal.
Counter-trend bounces are normal following impulsive downside movement. What matters is whether price can reclaim and sustain above the 50 EMA with momentum confirmation.
Until that occurs, structure remains defensive.
No regime shift.
No bias shift.
Just continued pressure with minor counter-trend movement.
Structure > Emotion.

BTC AB-CD IS THE BEST CASE...Morning folks,
So, BTC under the negative wave - massive sell-off, whales' buying can't help, Clarity Act is stuck etc...
By technical picture market is strongly oversold. At the same time, price stands too close to downside AB=CD target @52K to ignore it. So, we suggest chances on solid pullback from 52K as solid .
That's why now, if even we get the pullback it will not be the major one. At the best case scenario we will get minor AB-CD to ~75-76K area from 5/8 support. Most probable that we get a kind of Double Bottom instead with the same target.

AVAX - LONG - SQUEEZE LOADINGCRYPTOCAP:AVAX
When you zoom out, the structure is simple.
When you zoom in, the order flow tells the real story.
Coin-margined OI has been bleeding.
Coin-margined CVD has been trending down.
That tells us native collateral traders have been reducing exposure or getting flushed. That side of the market is not aggressively bidding.
Meanwhile:
Stablecoin-margined OI has been rising aggressively.
Stablecoin CVD has been making lower lows alongside price.
Fresh leverage entered. Mostly shorts.
So structurally, we had pressure building on the downside.
But then something changed.
Yesterday we saw continuous short buildup.
CVD kept pushing lower.
Yet price stopped responding.
Instead of breaking down, price started grinding up.
That is absorption.
Aggressive sellers are hitting bids.
But someone is calmly sitting there, passively absorbing everything.
Now layer in spot.
Spot CVD is trending up hard.
Real demand is stepping in.
This is not perp games anymore. This is inventory transfer.
Then we look at structure.
Price retraced to the 0.5 Fib of the previous impulse.
From a symmetry perspective, 0.5 rotations often resolve toward the 2.0 extension.
The 2.0 extension sits around 11.4
The 1.618 extension sits near 11.5
Clustered target zone.
If price keeps grinding higher slowly while:
• OI does not collapse
• Shorts keep building
• Spot keeps buying
Then we are looking at fuel, not weakness.
The longer price compresses above the 0.5, the more trapped shorts accumulate below.
Once liquidity builds and passive bids stack under the new structure, the squeeze can be violent.
This does not look like distribution.
It looks like preparation.
CRYPTOCAP:AVAX
- ThetaNomad

ETH/BTC 4H – Pressure Building Below Channel ResistanceETH/BTC continues to trade within a well-defined descending channel (Base Channel) following the completion of a prior impulsive decline. The recovery attempt has remained structurally weak, producing lower highs while respecting the lower boundary of the channel.
Price is currently approaching a confluence between the 0.236–0.382 retracement region and the lower boundary of the parallel channel. This area also aligns with prior breakdown structure, making it a technically sensitive level.
Price appears to be forming a temporary consolidation near resistance. If this rebound stalls below the lower boundary of the channel, the next move is likely to be another decline toward the lower part of the structure, with downside targets projected below recent lows. If the price decides to break in the parallel channel, then the move is likely headed upwards targeting the middle and upper boundaries. As long as the Wave (4) invalidation area is not violated, the count remains valid.
The broader bias remains negative while price trades below the highlighted invalidation band near 0.0325–0.0330. A sustained move above that region would neutralize the immediate downside scenario.
Until then, rallies appear corrective rather than impulsive.

GBPJPY outcome!GBPJPY waiting for a strong confirmation to go in LONG with a bounce at or near the TrendLine. Not being PATIENT is part of the trading strategy that most people lose.

GOLD scalping!GOLD has been consolidating and can take good profits scalping or Day Trading. Just gotta make sure not BreakOuts and good bounces off SUPPORT & RESISTANCE.

XRP H4 Buy | Consolidation 1.3764 → POC 1.5800 | Risk ManagedXRP is currently moving in a consolidation phase on the H4 timeframe, and demand is forming around the 1.3777 level. This area provides a potential buy setup.
Entry Zone: Around 1.37764 (Demand area)
Stop Loss: Below the consolidation range
Target 1: POC line at 1.5800
If an H4 candle closes strongly above the POC level (1.5800), the next target will be the buy-side liquidity (BSL) zone.
The market is still ranging, so patience and proper risk management are essential.
Disclaimer:
This analysis is for educational purposes only and does not constitute financial advice. Trading involves risk, and you should always use proper risk management. Past performance does not guarantee future results.

SUSDT plan 12-02-26SUSDT plan 12-02-26
The price is now at the supply level. On the 1-hour timeframe, the price is forming a base,
and below it, there is an imbalance. We'll try to set a sell limit in the supply area,
with the target of filling the imbalance area.
BTC long-term TABitcoin is still in a very bearish formation, there has been no change in trend direction since October last year.

ICP: waiting for a flush? key levels and targets for the days ahICP. Waiting for one more flush before the real move? Recent headlines about regulators eyeing alt projects plus a boring Bitcoin range keep sucking liquidity out of mid caps, and ICP has been quietly bleeding back to the 2.3 zone. According to market chatter, funds keep rotating into majors, leaving charts like this one oversupplied on every bounce.
On the 4H chart price sits under a fat resistance cluster around 2.4–2.6, right below the main volume node, while RSI hangs near 40 and can’t get above 50. Trend is still a clean staircase down, so I’m leaning to the downside over the next sessions, expecting a retest of the green support near 2.1 and maybe the 2.0 psychological level. I might be wrong, but for now every pump looks more like exit liquidity than accumulation. ⚠️
My base plan: watch for a rejection in the 2.4–2.5 area to hunt shorts toward 2.15 then 2.0, with invalidation if we get a strong 4H close above 2.6. If bulls suddenly reclaim 2.6 on volume and RSI pushes back over 50, that flips the script and opens the way to 2.8–3.0 where the next big supply zone waits. I’m staying flat until price tags one of these levels instead of chasing in the middle.

BTC/USDT | Bull or Bear ? (READ THE CAPTION)By analyzing the #Bitcoin chart on the weekly timeframe, we can see that price continued its bullish expansion and successfully rallied up to the $71,300 level. After this strong move, Bitcoin is currently trading around the $68,500 area, which can be considered a healthy corrective phase within the broader uptrend.
All previous assumptions of the analysis remain valid. As long as price holds above the key $66,000 demand zone, the bullish structure stays intact, and we can expect further upside once consolidation is completed. The recent pullback does not invalidate the bullish scenario and instead supports a continuation-based setup.
This chart will continue to be updated step by step as price reacts to key levels.
Please support me with your likes and comments to motivate me to share more analysis with you and share your opinion about the possible trend of this chart with me !
Best Regards , Arman Shaban

TON/USDT | TON Holds the Line After Sharp Dump,Bulls Coming BackBy analyzing the LSE:TON chart on the weekly timeframe, we can see that after the strong bearish move toward the $1.11 level, price reacted to demand and has now recovered to the $1.34 area. This rebound shows that buyers are still present, but confirmation is still required.
The key condition for further upside is price stabilization above the $1.245 level. Only if TON manages to hold and consolidate above this zone can we expect a stronger mid-term bullish continuation. Below this level, price remains vulnerable to further volatility and consolidation.
📈 Potential Upside Targets
• Target 1: $1.55
• Target 2: $1.78
• Target 3: $2.05
As always, this chart will be updated step by step as price reacts to key levels.
Please support me with your likes and comments to motivate me to share more analysis with you and share your opinion about the possible trend of this chart with me !
Best Regards , Arman Shaban

XRP/USDT | More Bullish Move Ahead ? (READ THE CAPTION)By analyzing the #XRP chart on the weekly timeframe, we can see that after the initial dump toward the $1.12 level, price reacted strongly to demand and managed to recover up to $1.145. Currently, XRP is trading around the $1.41 area, which is a very important level from a structural perspective.
If price can stabilize and hold above the $1.40 level, this would confirm bullish continuation from the recent demand reaction, and we can expect further upside toward higher targets. As long as price remains above this key level, the probability shifts in favor of buyers despite the broader bearish context.
📈 Upside Targets :
• Target 1: $1.58
• Target 2: $1.82
• Target 3: $2.15
This chart will continue to be updated step by step as price moves.
Please support me with your likes and comments to motivate me to share more analysis with you and share your opinion about the possible trend of this chart with me !
Best Regards , Arman Shaban

BTC Long – Breakout Retest Targeting 71.3KHello Traders,
After a strong reaction from the 59–60K liquidity sweep, BTC printed a clear higher low and is now breaking above the descending trendline that has capped price since the local top.
We are currently attempting a structure shift on the 4H timeframe.
📌 Context
Major liquidity was taken below 60K (HTF sweep).
Strong impulsive move off the lows.
Descending trendline resistance now being challenged.
Momentum oscillator showing bullish divergence + expansion from oversold region.
Previous lower high around 71.3K remains untested resistance.
🎯 Trade Plan
Entry idea:
Look for either:
Break and close above trendline resistance,
Or a clean retest of the 66.8K–67.5K demand zone after breakout
Target:
→ 71,300 – 71,500 resistance zone (previous LH + supply)
Invalidation:
→ 64.8K (loss of higher low structure)
More aggressive traders can invalidate below 66K.
🧠 Why 71K?
Previous lower high.
Untested supply.
Logical liquidity magnet.
~6–7% upside from breakout zone.
Risk Notes
This is a counter-trend rally inside a broader down move unless 72K+ reclaims with strength.
If price fails at trendline and closes back below 66K, bullish structure is invalidated.
Good luck, and remember to trade your own book!

Skycoin: ready for a second leg? key levels to watch aheadSkycoin. Is this old alt warming up for a second leg or was that spike the whole show? Recently the market has been rotating into smaller caps again, and Skycoin woke up with a sharp impulse up while most traders were still staring at majors. Now price is chilling right under a thick supply zone, so the next move from here can be juicy.
On the 4H chart, price is ranging just below resistance around 0.067–0.069 after a strong vertical pump. RSI cooled from overbought back to the mid‑50s without any real dump, which looks more like a pause than distribution. VPVR shows a chunky support node in the 0.063–0.065 area, so I’m leaning to the long side as long as that block holds. I might be wrong, but this looks like a classic consolidation before a breakout.
My base case ✅ a shallow pullback into 0.064–0.065 or a clean 4H close above 0.069 opens the road toward 0.072–0.075. If buyers fail and we get a firm close below 0.061, the bulls are trapped and I’d expect a slide toward 0.058 ⚠️. I’m stalking a long from the green zone and will reassess if that support gets sliced. Not financial advice, just my game plan.

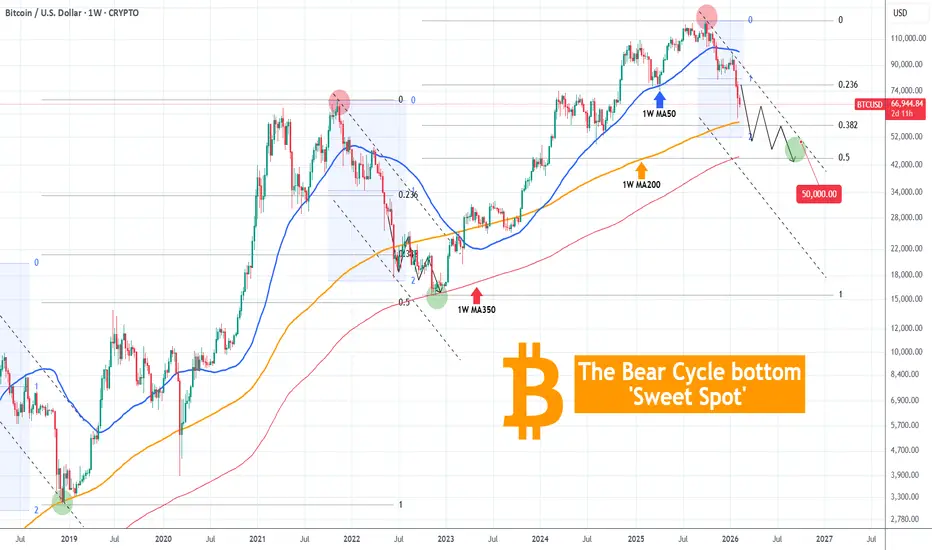
BITCOIN The Bear Cycle 'Sweet Spot'Bitcoin (BTCUSD) is currently sitting on the 4th straight red week following last week's near test of its 1W MA200 (orange trend-line). As we've discussed before, the Bear Cycle may be entering Phase 2 when the 1W MA200 finally breaks.
From a Fibonacci perspective, last week's Low also came close to the 0.382 Fibonacci retracement level from the last Bear Cycle bottom. That was when the lengthy bottoming process started for BTC. Also that 1W MA200/ 0.382 Fib break coincided with a near test of the 2.0 Fib extension (blue) from the first Low of the 2022 Bear Cycle.
That is currently around $51000 and the Zone within that and the 0.5 Fibonacci retracement from the Bear Cycle bottom (around $45000) is the 'Sweet Spot'. Practically this is a 'no-miss' Buy Zone on a cyclical perspective where long-term investors can start feeling comfortable enough to initiate buying again. We've already discussed why a 1W MA350 (red trend-line) bottom would technically make sense, as this is where the 2022 Bear Cycle bottomed.
So do you think the 51000 - 45000 Zone is a 'Sweet Spot' buying range for BTC? Feel free to let us know in the comments section below!
---
** Please LIKE 👍, FOLLOW ✅, SHARE 🙌 and COMMENT ✍ if you enjoy this idea! Also share your ideas and charts in the comments section below! This is best way to keep it relevant, support us, keep the content here free and allow the idea to reach as many people as possible. **
---
💸💸💸💸💸💸
👇 👇 👇 👇 👇 👇
EURUSD going down!EURUSD has lost strength and is making Lower Lows and Lowe Highs. Good opportunity to get in on pullbacks.

BERAUSDT plan 12-02-26BERAUSDT PLAN 12-02-26
Bera has rejected fresh supply on the high timeframe.
When we look at the 1-hour timeframe, we see a bearish engulfing. Then, we move down to the 30-minute timeframe and see a Quasimodo setup. We'll try setting a limit in that area, even though the head is too high.
Crypto: RUNEUSD The Roadmap One Year LaterMarkets rarely reward certainty. They reward structure.
On February 03, one year ago, the first Elliott Wave forecast on RUNE was published. It was not a prediction of exact prices or exact dates. It was a structural roadmap. Today, exactly one year later, the chart continues to respect that broader framework, reinforcing a critical truth about markets: while price cannot be forecast with absolute precision, it can often be anticipated through structure.
The weekly chart of RUNE reflects the completion of a macro five wave impulsive advance, followed by a complex corrective formation labeled W X Y. According to Elliott Wave principles, once an impulse concludes, a correction is not optional. It is structural. The decline that followed the peak was not random volatility, but the unfolding of that corrective phase.
The recent breakdown from the highlighted February 03 candle marks the continuation of the next leg within this broader correction. Short term price action is developing in a sequence of lower highs and lower lows, suggesting that downside pressure remains active. Fibonacci retracement analysis aligns with this view. The 0.618 retracement level presents an intermediate objective where temporary stabilization may occur. However, the deeper 0.786 retracement zone represents the more proportionate target for a mature wave Y completion, offering structural symmetry within the broader cycle.
It is essential to emphasize that Elliott Wave analysis does not promise certainty. Instead, it provides probability based pathways. It organizes uncertainty into identifiable phases of expansion and contraction, optimism and pessimism. One year after the initial forecast, the broader corrective thesis remains structurally intact, demonstrating how wave analysis offers a roadmap that spans from short term fluctuations to long term cycle expectations.
Markets cannot be predicted with perfection. But they can be mapped with discipline. Elliott Wave theory does not eliminate risk. It defines it.
