Deep Dive Into Bollinger Bands 🗓This article explores the Bollinger Bands indicator—a powerful volatility tool used by traders worldwide. You'll learn how it works, how to calculate it, and how to use it to detect potential breakouts, trend reversals, and overbought or oversold conditions in the market.
📚 Introduction to Bollinger Bands
In the fast-paced world of trading, understanding market volatility is key to making informed decisions. Bollinger Bands, developed by John Bollinger in the 1980s, offer a visual and statistical method to measure this volatility. Unlike simple moving averages, which only tell you the trend, Bollinger Bands expand and contract based on recent price action, helping traders spot overbought, oversold, or consolidation phases.
These bands dynamically adjust to market conditions, making them one of the most popular indicators for trend-following, mean-reversion, and breakout strategies. Whether you’re trading crypto, stocks, or forex, Bollinger Bands can help you identify high-probability setups by combining trend direction with volatility.
📚 How Bollinger Bands Are Calculated
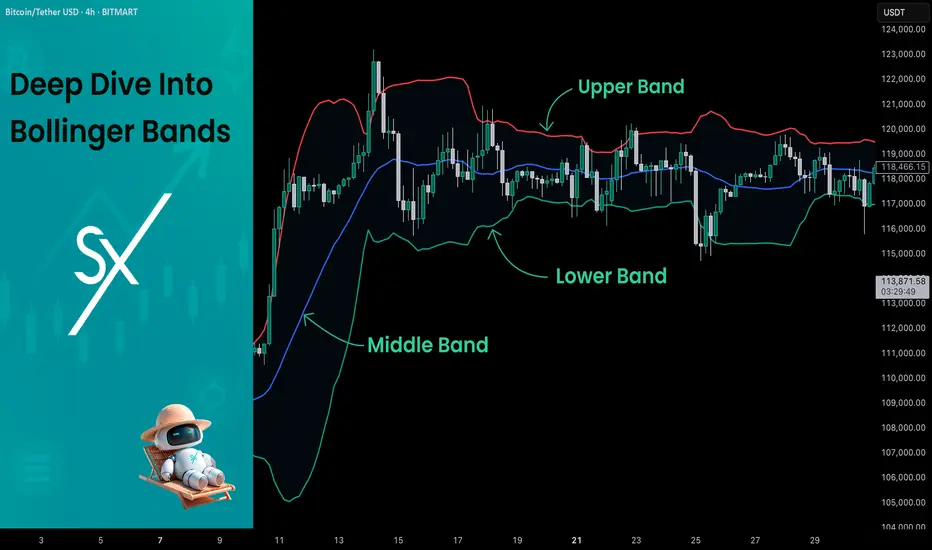
Bollinger Bands consist of three lines:
Middle Band – This is a simple moving average (SMA) of the price, typically over 20 periods.
Upper Band – The middle band plus two standard deviations.
Lower Band – The middle band minus two standard deviations.
Middle Band = SMA(n)
Upper Band = SMA(n) + (k × σₙ)
Lower Band = SMA(n) - (k × σₙ)
Where σₙ is the standard deviation of the price for n periods and k is the multiplier, typically set to 2, which captures ~95% of price action under normal distribution. The middle band shows the average price over the last 20 candles. The upper and lower bands adjust based on how volatile the price has been — expanding in high volatility and contracting in low volatility.
🤖 For those traders who want to implement Bollinger Bands into algorithmic strategy we provide formula it's calculation in Pine Script:
basis = ta.sma(src, length) // Middle Band (SMA)
dev = mult * ta.stdev(src, length) // Standard Deviation × Multiplier
upper = basis + dev // Upper Band
lower = basis - dev // Lower Band
📚 How to Use MACD in Trading Strategies
⚡️Bollinger Band Squeeze (Volatility Contraction and Expansion)
The idea is pretty simple, а squeeze indicates low volatility and often precedes a breakout. The squeeze is the situation when the Upper Band and Lower Band contract, and BB width is at a local minimum. In this case you shall be prepared for the high volatility after the period of low volatility. This strategy doesn’t predict direction — it prepares you for volatility.
Long setup:
Price is in long-term uptrend, you can use 200 EMA as a major trend approximation - price shall be above it.
Bollinger Bands is narrow in comparison to the previous period. Price usually is in sideways.
Open long trade when candle shows a breakout and closes above the Upper Band.
Set a trailing stop-loss at the Middle Band.
Short setup:
Price is in long-term downtrend, you can use 200 EMA as a major trend approximation - price shall be below it.
Bollinger Bands is narrow in comparison to the previous period. Price usually is in sideways.
Open short trade when candle shows a breakdown and closes below the Lower Band.
Set a trailing stop-loss at the Middle Band
📈Long Trading Strategy Example
1. Price candle shall be closed above 200-period EMA. In our example we have BITMART:BTCUSDT.P 4h time frame.
2. Bollinger Bands shall be narrow in comparison with the previous periods.
3. Open long trade when candle closes above the Upper Band.
4. Close trade when price touched the Middle Band.
📉Short trading strategy example
1. Price candle shall be closed below 200-period EMA. In our example we have BITMART:BTCUSDT.P 4h time frame.
2. Bollinger Bands shall be narrow in comparison with the previous periods.
3. Open short trade when candle closes below the Lower Band.
4. Close trade when price touched the Middle Band.
⚡️Mean Reversion (Rebound from the Bands)
This is the most common approach to use Bollinger Bands. The idea is also very simple, we just want to open long if price touches Lower Band and short if price reaches Upper Band. Price tends to revert to the mean (Middle Band), especially in range-bound markets. It's very important to trade in the direction of the major trend to reduce the probability of the large move against you.
Long setup:
Price is in long-term uptrend, you can use 200 EMA as a major trend approximation - price shall be above it.
Open long trade when price touches the Lower Band.
Set the initial stop-loss at the fixed percentage below entry price. Choose this percentage number with your personal risk/money management, you shall be comfortable to lose this amount of money in case of stop-loss hit.
If price reached Middle Band set stop-loss at breakeven.
Close trade when price reached the Upper Band.
Short setup:
Price is in long-term downtrend, you can use 200 EMA as a major trend approximation - price shall be below it.
Open short trade when price touches the Upper Band.
Set the initial stop-loss at the fixed percentage above entry price. Choose this percentage number with your personal risk/money management, you shall be comfortable to lose this amount of money in case of stop-loss hit.
If price reached Middle Band set stop-loss at breakeven.
Close trade when price reached the Lower Band.
🧪 Important: the most common approach to close trades is the Middle Band touch, this is classic mean reversion. We experimented multiple times with different approached and revealed that usually it's better to take profit at the Upper/Lower band for long/short trades and use Middle Band only for setting stop-loss at breakeven. This approach provides better risk to reward ratio.
📈Long Trading Strategy Example
1. Price candle shall be closed above 200-period EMA. In our example we have BITMART:BTCUSDT.P 4h time frame.
2. Open long trade the Lower Band.
3. Put Initial stop-loss 2% below the entry price.
4. When price reached Middle band place stop-loss at the breakeven.
5. Close long trade at the Upper Band.
📉Short trading strategy example
1. Price candle shall be closed below 200-period EMA. In our example we have BITMART:BTCUSDT.P 4h time frame.
2. Open short trade the Upper Band.
3. Put Initial stop-loss 2% above the entry price.
4. When price reached Middle band place stop-loss at the breakeven.
5. Close short trade at the Lower Band.
🧪 Important tip: notice that initial stop-loss is needed only to avoid disaster in case of price moves strongly against you. This percentage shall give enough space to avoid its reaching too often. Mean reversion strategy provides fast trades with the small average gain, so you shall maintain the high win rate (perfectly above 70%). You have to choose stop-loss based on particular asset volatility.
⚡️Combined Approach: Mean Reversion + Trend Following
Skyrexio made multiple researches about Bollinger Bands strategies and we found that we can receive better gains in combination of different approaches. Mean reversion gives you great entry with discount but you don't need to exit that early. Use the trading stop and allow to gain profit while market is moving in your direction.
This approach you can find in our advanced strategy Bollinger Bands Enhanced Strategy which we shared in 2024. Click on the link to read about it and understand how you can combine best features of this popular indicator.
📚 Conclusion
Bollinger Bands are more than just a volatility indicator — they provide a flexible framework for understanding price dynamics and market conditions. By visualizing the relationship between price and standard deviation around a moving average, traders can gain valuable insights into whether an asset is consolidating, trending, or preparing for a breakout.
The real strength of Bollinger Bands lies in their versatility. They can adapt to different trading styles — whether you’re a short-term scalper, a swing trader, or a long-term position holder. From identifying squeeze setups to riding strong trends or capturing mean reversion moves, BBs offer a strategic edge when used correctly.
However, Bollinger Bands should never be used in isolation. Like any technical tool, they work best when combined with momentum indicators like RSI or MACD, volume analysis, and price action signals. Context is key: a signal that works well in a ranging market may fail during high momentum trends.
Ultimately, Bollinger Bands help traders make more informed, disciplined decisions by clarifying where price stands relative to recent history. When paired with sound risk management and broader market awareness, they become a powerful ally in navigating market uncertainty.
Bands
A Bollinger Band Strategy THAT ACTUALLY WORKS (1-Min Timeframe)In this video i'm going to explain you how to use the Bollinger Bands while trading BTC/USD in the 1-Minute and 5-Minute timeframe.
If you have any questions, feel free to leave a comment!
Please Boost this idea if you like it. This will help the algorithm and motivates me to push more educational videos for you :)
Cheers,
Ares

TrueLevel Bands: One of the Most Useful IndicatorsThe TrueLevel Bands Indicator: Why It's One of the Most Useful Indicators Out There
The TrueLevel Bands indicator is a powerful technical analysis tool that helps traders identify trends and potential reversal points in the markets. It is a versatile and customizable indicator that can be used on any financial instrument, including stocks, commodities, forex, and cryptocurrencies.
In this article, we'll explore the TrueLevel Bands indicator in detail, and explain why it's one of the most useful indicators for traders.
What Are TrueLevel Bands?
TrueLevel Bands are a type of envelope indicator that helps traders identify the upper and lower boundaries of a trading range. They are similar to Bollinger Bands, but instead of using a fixed number of standard deviations from the moving average, TrueLevel Bands use a multiple of the standard deviation that is determined by the length of the moving average.
The TrueLevel Bands indicator consists of two lines: an upper band and a lower band. The upper band is calculated by adding a multiple of the standard deviation to the moving average, while the lower band is calculated by subtracting the same multiple of the standard deviation from the moving average.
How to Use TrueLevel Bands
TrueLevel Bands can be used in a variety of ways, but their primary purpose is to help traders identify trends and potential reversal points in the markets. Here are a few ways that traders can use TrueLevel Bands:
1. Trend identification
One of the most significant advantages of TrueLevel Bands is the cloud created by the transparency of the fill color between the upper and lower bands. This cloud makes it easy to visualize the trend at a glance, without having to rely on complex technical analysis tools or methods. The cloud effect also provides a clear indication of the strength of the trend. The wider the cloud, the stronger the trend, while a narrow cloud indicates a weaker trend or consolidation. This feature is particularly useful for traders who prefer to use visual cues to make trading decisions.
TrueLevel Bands make it easy to identify the direction of the trend. When the price is above the cloud, it is considered to be in an uptrend. Conversely, when the price is below the cloud, it is considered to be in a downtrend.
2. Reversal points
TrueLevel Bands can also be used to identify potential reversal points in the markets. When the price reaches the upper band, it is considered to be overbought, and a reversal to the downside may occur. Similarly, when the price reaches the lower band, it is considered to be oversold, and a reversal to the upside may occur.
3. Support and resistance levels
TrueLevel Bands can also be used to identify support and resistance levels. When the price is trading within the bands, the upper band serves as a resistance level, while the lower band serves as a support level. Traders can use these levels to identify potential entry and exit points for their trades.
4. Volatility
TrueLevel Bands can also be used to measure volatility. When the bands are narrow, it indicates that the market is experiencing low volatility. Conversely, when the bands are wide, it indicates that the market is experiencing high volatility.
5. Fibonacci-based length options
In addition to the standard length options (250, 500, 750, 1250, 2000, and 3250), TrueLevel Bands also offer Fibonacci-based length options. These lengths are spaced out in a way that allows traders to capture different time frames and market movements, from short-term fluctuations to longer-term trends.
The Fibonacci-based length options were chosen by multiplying 125 (which represents 6 months of daily data) by a sequence of Fibonacci numbers, starting with 2. The resulting lengths are: 250 (125 x 2), 375 (125 x 3), 500 (125 x 4), 325 (125 x 5), 750 (125 x 6), 1000 (125 x 8), 1250 (125 x 10), 1625 (125 x 13), 2000 (125 x 16), 2625 (125 x 21), 3250 (125 x 26), 3750 (125 x 30), and 4250 (125 x 34).
By using these Fibonacci-based length options, traders can take advantage of the natural patterns and rhythms that exist in the markets. These lengths are spaced out in a way that allows traders to capture different time frames and market movements, from short-term fluctuations to longer-term trends.
Why TrueLevel Bands Are More Accurate Than Moving Averages
Moving averages are a popular technical analysis tool that help traders identify trends and potential reversal points in the markets. However, they have a few drawbacks that make them less accurate than TrueLevel Bands.
1. moving averages are based on past prices, which means they lag behind the current market conditions. This can lead to false signals and missed trading opportunities.
2. moving averages use a fixed number of periods, which may not be suitable for all market conditions. For example, a 50-period moving average may work well in a trending market, but it may be less effective in a choppy or range-bound market.
TrueLevel Bands, on the other hand, use a multiple of the standard deviation that is determined by the length of the moving average. This means that the bands are more responsive to changes in market conditions, and they can adapt to different market environments.
Conclusion
The TrueLevel Bands indicator is a powerful and versatile tool that can help traders identify trends, potential reversal points, support and resistance levels, and measure volatility. It offers a range of length options, including Fibonacci-based options, that allow traders to capture different time frames and market movements.
Compared to moving averages, TrueLevel Bands are more accurate and adaptable to changing market conditions. They can help traders make better-informed trading decisions and improve their overall trading results.
If you're looking for a reliable and versatile technical analysis tool, give the TrueLevel Bands indicator a try. It might just be the missing piece in your trading toolbox.

📊Bollinger Bands In A Trending MarketBollinger Bands are a widely used chart indicator for technical analysis created by John Bollinger in the 1980s. They offer insights into price and volatility and are used in many markets, including stocks, futures, and currencies. Bollinger Bands have multiple uses, such as determining overbought and oversold levels, as a trend following tool, and for monitoring for breakouts.
📍 Strategy
Bollinger Bands measure deviation and can be helpful in diagnosing trends. By generating two sets of bands using different standard deviation parameters, traders can gauge trends and define buy and sell zones. The bands adapt dynamically to price action, widening and narrowing with volatility to create an accurate trending envelope. A touch of the upper or lower band is not a signal in and of itself, and attempting to "sell the top" or "buy the bottom" can lead to losses. Standard deviation is a statistical measure of the amount of variation or dispersion of a set of prices or returns from its average value. The higher the standard deviation, the wider the Bollinger Bands, indicating greater price volatility, and vice versa. Traders may use standard deviation to set stop-loss and take-profit levels or to help determine the risk-to-reward ratio of a trade.
📍 Calculation
First, calculate a simple moving average. Next, calculate the standard deviation over the same number of periods as the simple moving average. For the upper band, add the standard deviation to the moving average. For the lower band, subtract the standard deviation from the moving average.
Typical values used:
Short term: 10 day moving average, bands at 1.5 standard deviations. (1.5 times the standard dev. +/- the SMA)
Medium term: 20 day moving average, bands at 2 standard deviations.
Long term: 50 day moving average, bands at 2.5 standard deviations.
👤 @AlgoBuddy
📅 Daily Ideas about market update, psychology & indicators
❤️ If you appreciate our work, please like, comment and follow ❤️

Trading Idea - #SP500 #BoumidiBandsHello everybody,
since I pay a lot of attention to statistical values in trading, I took a closer look at the #BoumidiBands (BB_SPX).
The BBs are derived from the implied volatility of the futures markets. The upper and lower bands of the indicator give us the range with the highest probability in which the market can move.
If the market breaks out of the BBs, it is expected to return into the bands. At least that is my interpretation.
I applied the BBs to the SP500 index and took a closer look on Tradingview. I looked at the data from February 2021 to today.
My backtesting criteria: on a breakout above the upper band I would open a SHORT trade and on a slide below the lower band, I would open a LONG trade.
The result is fantastic, without defining SL and TP here. In total, my backtesting resulted in 19 winning trades against 7 losing trades.
Check out my chart where I marked the market entries.
green thumbs up = winning trade
red thumb down = losing trade
Have fun with it.
I would be happy if you leave me some feedback.
Regards
Traderherz

HOW-TO: Getting started with Price Finder IndicatorHello there, fellow trader!
If you are starting to use Price Finder indicator, or is just interested on knowing some of the basics, here is a brief video you may find useful.
In it I cover the overall meanings of indicator's components , how they relate and work with each other , and how to set it up to see and work with multiple time frames (multiple structures) in a single chart . This is one of the most useful and innovative features. So, make sure you check it out, and get to know it.
If you have any doubts, please let me know.
Thank you for you attention!
Best of success,
PHInkTrade
