How to enter a successful futures tradeDrop everything and let me show you how to enter a successful long position with the lowest possible risk.
You need to understand that the market maker usually acts against us at major support areas on the chart — like the 100 EMA, 0.618 Fibonacci level, or a trendline.
To make this clearer, let’s take TAO as an example and I’ll explain why.
TAO has strong momentum and a large market cap,
so don’t apply what I’m about to say to meme coins, for example.
Now let’s go step by step on how to enter a futures position after choosing the coin 👇
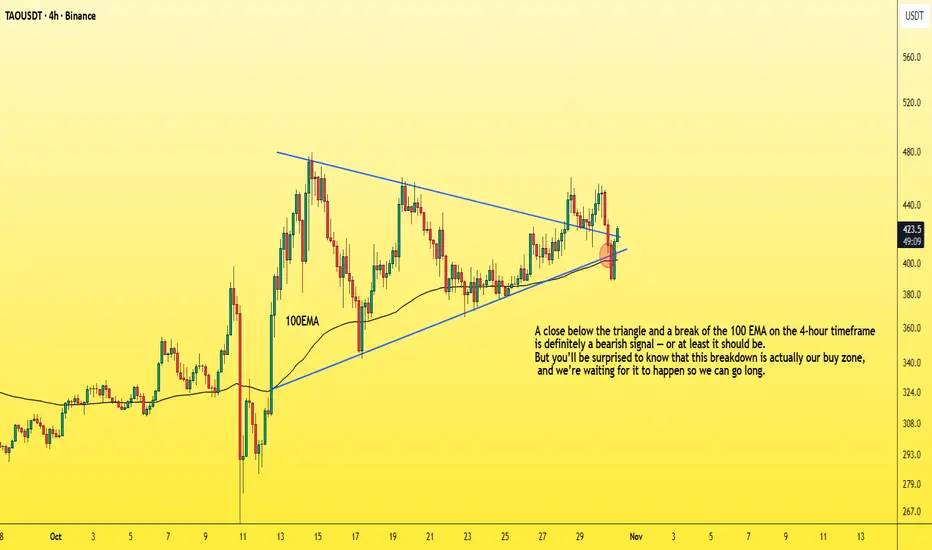
1. First, wait for a bullish pattern to form — like a triangle — and for the coin to break it upwards with increasing long momentum.
2. The price will then retest the trendline, encouraging people to enter with larger positions, and those who missed the first breakout will likely place buy orders at the retest zone.
3. Then, the market surprises them — it drops back inside the triangle, giving a small bounce at the lower side.
4. But it doesn’t stop there — it continues dropping, breaking below the triangle and closing below the 100 EMA on the 4-hour chart.
This makes you panic and close your long position.
Others start entering shorts thinking it’s a real breakdown.
5. That’s when the market reverses sharply upward,
trapping short traders in losses,
while long traders who exited too early also lose.
In the end, only those who placed buy orders slightly below the strong support level (not directly on it, like under the 100 EMA) — and of course the market maker — end up winning.
So basically, the long traders lose, the short traders lose,
and only a small percentage of smart traders and the market maker win.
Small things to pay attention to 👇
-Your entry point should be slightly below the support, not too far below it.
(That support could be the 100 EMA, below the triangle pattern, or the 0.618 Fibonacci level, as we mentioned.)
-Don’t use high leverage — x5 should be your maximum.
-Place your stop loss 5% below your entry zone,
which equals about 25% loss if you’re using x5 leverage.
And with that, you’ve got yourself a long setup with over a 90% success rate,
and you can apply the same logic in reverse when taking a short position.
Best Regards:
Ceciliones🎯
Longposition
How to develop a simple Buy&Sell strategy using Pine ScriptIn this article, will explain how to develop a simple backtesting for a Buy&Sell trading strategy using Pine Script language and simple moving average (SMA).
Strategy description
The strategy illustrated works on price movements around the 200-period simple moving average (SMA). Open long positions when the price crossing-down and moves below the average. Close position when the price crossing-up and moves above the average. A single trade is opened at a time, using 5% of the total capital.
Behind the code
Now let's try to break down the logic behind the strategy to provide a method for properly organizing the source code. In this specific example, we can identify three main actions:
1) Data extrapolation
2) Researching condition and data filtering
3) Trading execution
1. GENERAL PARAMETERS OF THE STRATEGY
First define the general parameters of the script.
Let's define the name.
"Buy&Sell Strategy Template "
Select whether to show the output on the chart or within a dashboard. In this example will show the output on the chart.
overlay = true
Specify that a percentage of the equity will be used for each trade.
default_qty_type = strategy.percent_of_equity
Specify percentage quantity to be used for each trade. Will be 5%.
default_qty_value = 5
Choose the backtesting currency.
currency = currency.EUR
Choose the capital portfolio amount.
initial_capital = 10000
Let's define percentage commissions.
commission_type = strategy.commission.percent
Let's set the commission at 0.07%.
commission_value = 0.07
Let's define a slippage of 3.
slippage = 3
Calculate data only when the price is closed, for more accurate output.
process_orders_on_close = true
2. DATA EXTRAPOLATION
In this second step we extrapolate data from the historical series. Call the calculation of the simple moving average using close price and 200 period bars.
sma = ta.sma(close, 200)
3. DEFINITION OF TRADING CONDITIONS
Now define the trading conditions.
entry_condition = ta.crossunder(close, sma)
The close condition involves a bullish crossing of the closing price with the average.
exit_condition = ta.crossover(close, sma)
4. TRADING EXECUTION
At this step, our script will execute trades using the conditions described above.
if (entry_condition==true and strategy.opentrades==0)
strategy.entry(id = "Buy", direction = strategy.long, limit = close)
if (exit_condition==true)
strategy.exit(id = "Sell", from_entry = "Buy", limit = close)
5. DESIGN
In this last step will draw the SMA indicator, representing it with a red line.
plot(sma, title = "SMA", color = color.red)
Complete code below.
//@version=6
strategy(
"Buy&Sell Strategy Template ",
overlay = true,
default_qty_type = strategy.percent_of_equity,
default_qty_value = 5,
currency = currency.EUR,
initial_capital = 10000,
commission_type = strategy.commission.percent,
commission_value = 0.07,
slippage = 3,
process_orders_on_close = true
)
sma = ta.sma(close, 200)
entry_condition = ta.crossunder(close, sma)
exit_condition = ta.crossover(close, sma)
if (entry_condition==true and strategy.opentrades==0)
strategy.entry(id = "Buy", direction = strategy.long, limit = close)
if (exit_condition==true)
strategy.exit(id = "Sell", from_entry = "Buy", limit = close)
plot(sma, title = "SMA", color = color.red)
The completed script will display the moving average with open and close trading signals.
IMPORTANT! Remember, this strategy was created for educational purposes only. Not use it in real trading.

How Short Sales Indicate Buying ActivityA Beginner-Friendly Guide to How Short Sales Indicate Buying Activity
█ What is a Short Sale?
A short sale is when someone sells a stock they don't actually own, usually because they believe the price will drop. They borrow the stock, sell it at the current price, and hope to buy it back later at a lower price to return to the lender.
However, not all short sales are for speculation! In fact, about half of all trades in the market are short sales, which seems strange unless we look deeper.
QUICK SUMMARY
🧐 What is a Short Sale?
A short sale is when someone sells a stock they don't own, hoping to buy it back later at a lower price.
Normally, people think short sales mean traders are betting that the stock will go down. But there's more to the story!
💡 Why Are Short Sales Important for Understanding Buying?
About half of all trades in the market are short sales! This means there's something deeper going on.
Market-makers (people who help match buyers and sellers) play a big role here.
👥 What Do Market-Makers Do?
They offer to sell a stock at a slightly higher price and buy at a slightly lower price.
When someone buys a stock from a market-maker, the market-maker short-sells the stock (because they don't own it yet).
✅ This means:
When you see a short sale, it's often because someone is buying from a market-maker. Therefore, short volume (total short sales) is a good indicator of buying activity!
█ Why Short Sales Reflect Buying Activity
Market-makers (MMs) play a crucial role in ensuring there are always buyers and sellers available in the market. Here's how they do it:
⚪ Market-Maker Role:
MMs quote both a buy price (bid) and a sell price (offer) for stocks. For example, they may offer to:
Buy at $19.95 (bid)
Sell at $20.00 (offer)
⚪ Short Sales in Practice:
When an MM offers to sell at $20.00, they often don't own the stock; they are "shorting" it to facilitate the sale. This means:
If an investor buys the stock at $20.00, the MM's sale is reported as a short sale.
If an investor sells the stock to the MM at $19.95, it is reported as a regular (long) sale.
Therefore:
Short sales = Investors buying the stock
Long sales = Investors selling the stock
█ Why This Matters
Since MMs are involved in most trades, short sales can be used as an indicator of buying activity. The more short sales there are, the more buying activity is happening in the market.
⚪ Dark Pools and Short Sales Data
Dark pools are private trading venues where large investors can trade without showing their orders publicly. These venues still have MMs who facilitate trades. Even though trades happen "in the dark," the MM behavior (shorting to sell) still applies.
FINRA collects and publishes data on short sales in dark pools. This data can help us see the relationship between short sales and stock price movements.
⚪ Testing the Idea
When researchers tested this idea, they found:
Higher Short Volume = Higher Stock Prices:
On days when short sales were above 50% of the total volume, the average stock price increased during the day.
When short sales were below 50%, the average stock price decreased.
The Trend is Clear:
When short sales make up a significant part of the market activity, it indicates strong buying interest.
█ The Findings
When short volume is high (above 35%), stocks tend to go up during the day.
When short volume is low (below 35%), stocks are more likely to go down.
Example:
If short volume = 50% → Expect higher buying activity and potential stock gains.
If short volume = 20% → Expect lower buying activity and potential stock declines.
🚀 Practical Tips for Traders
Investors can use short sale data from dark pools to:
Identify potential buying opportunities.
Understand market sentiment (whether people are more likely to buy or sell).
Anticipate short-term stock price movements based on the level of short sales.
Watch short volume data: High short volume can signal strong buying interest.
Use FINRA data: You can find free short sale data on FINRA's website to track these trends.
Be curious: This data isn't widely used yet, so understanding it can give you an edge!
█ Summary
⚪ Short sales are often a sign that investors are buying stocks.
⚪ Dark pool data offers valuable insights into market trends.
⚪ Monitoring short sale volume can help predict intraday stock gains and understand market behavior.
-----------------
Disclaimer
This is an educational study for entertainment purposes only.
The information in my Scripts/Indicators/Ideas/Algos/Systems does not constitute financial advice or a solicitation to buy or sell securities. I will not accept liability for any loss or damage, including without limitation any loss of profit, which may arise directly or indirectly from the use of or reliance on such information.
All investments involve risk, and the past performance of a security, industry, sector, market, financial product, trading strategy, backtest, or individual's trading does not guarantee future results or returns. Investors are fully responsible for any investment decisions they make. Such decisions should be based solely on evaluating their financial circumstances, investment objectives, risk tolerance, and liquidity needs.
My Scripts/Indicators/Ideas/Algos/Systems are only for educational purposes!

Most Powerful Candlestick Patterns Candlestick patterns are like building blocks in understanding how the stock market behaves and how prices might change. Knowing about these patterns can really help you make smarter decisions when trading.
I. Introduction to 35 Candlestick Patterns
Candlestick patterns are visual representations of price movements within a specific time frame. Each candlestick represents the opening, closing, high, and low prices for that period.
The body of the candlestick is the difference between the opening and closing prices, while the wicks or shadows represent the price range.
II. Bullish Candlestick Patterns
A bullish candlestick pattern is essentially a visual signal that appears on a price chart, indicating a potential upward momentum or trend in the market. It’s like a green light for traders, suggesting that the price of the asset is likely to go up.
Traders use these patterns to time their entry into the market with the goal of capitalizing on the anticipated price increase.
Bullish Single Candlestick Patterns:
Hammer: A single candlestick pattern characterized by a small body and a long lower wick, signaling a potential bullish reversal after a downtrend.
Inverted Hammer: Another single candlestick pattern with a small body and a long upper wick, indicating a potential bullish reversal after a downtrend.
Black Marubozu: A single candlestick pattern characterized by a long black body with no shadows, representing a strong bearish sentiment.
White Marubozu: A single candlestick pattern characterized by a long white body with no shadows, representing a strong bullish sentiment
Bullish Double Candle Patterns:
Bullish Engulfing: A two-candle pattern where a small bearish candle is followed by a larger bullish candle that engulfs the previous one, suggesting a potential trend reversal to the upside.
Bullish Piercing Pattern: A two-candle pattern starting with a bearish candle followed by a larger bullish candle that opens below the previous day’s low and closes more than halfway into the prior bearish candle.
Bullish Counterattack: A two-candle pattern starting with a bearish candle, followed by a larger bullish candle that engulfs the entire range of the previous bearish candle.
Tweezer Bottom: A two-candle pattern occurring after a downtrend, characterized by two consecutive bearish candles with similar lows, suggesting potential support and a bullish reversal.
Mat Hold: A five-candle pattern suggesting a continuation of a bullish trend. It begins with a bullish candle followed by a bearish candle, a long bullish candle, a small bullish or bearish candle, and ends with another bullish candle.
Bullish Triple Candle-Sticks Pattern:
Morning Star Pattern: A three-candle pattern starting with a bearish candle, followed by a small indecisive candle (often a doji), and then a bullish candle, indicating a potential bullish reversal.
Three White Soldiers: A bullish formation consisting of three consecutive long bullish candles. Each candle closes higher than the previous one, suggesting a strong potential upward movement.
Rising Three Methods: A five-candle pattern signaling a continuation of the current bullish trend. It starts with a long bullish candle, followed by three smaller bearish candles, and ends with another long bullish candle.
Upside Tasuki Gap: A three-candle pattern involving a bullish candle, a gap up, a bearish candle, and finally another bullish candle that opens within the range of the previous bearish candle.
III. Bearish Candlestick Patterns
A bearish candlestick pattern is a visual cue on a price chart that suggests a potential downward momentum or trend in the market. It’s akin to a red light for traders, indicating that the price of the asset is likely to decrease. Traders pay close attention to these patterns to time their entry into the market, aiming to profit from the expected price decline.
Single Candle Patterns:
Hanging Man: A single candlestick pattern resembling a hanging man, signaling a potential bearish reversal after an uptrend. Learn more about Hanging Man Candlestick
Shooting Star Pattern: A single candlestick pattern characterized by a small body and a long upper wick, suggesting a potential bearish reversal.
Bearish Engulfing: A two-candle pattern where a small bullish candle is followed by a larger bearish candle that engulfs the previous one, indicating a potential trend reversal to the downside.
Black Marubozu: A single candlestick pattern characterized by a long black body with no shadows, representing a strong bearish sentiment.
Double Candle Patterns:
Evening Star Pattern: A three-candle formation indicating a potential bearish reversal. It starts with a bullish candle, followed by a small indecisive candle and ends with a bearish candle.
Dark Cloud Cover: A two-candle pattern starting with a bullish candle followed by a larger bearish candle that opens above the previous day’s high and closes more than halfway into the prior bullish candle.
Bearish Harami: A two-candle pattern. The first candle is a large bullish one, followed by a smaller bearish candle that is entirely within the range of the bullish candle. This pattern indicates a potential bearish reversal.
Bearish Counterattack: A two-candle pattern starting with a bullish candle, followed by a larger bearish candle that engulfs the entire range of the previous bullish candle.
On-Neck Pattern: A two-candle pattern where the first day has a long black body followed by a second day with a small body that closes slightly above the previous day’s low.
Triple Candle Patterns:
Three Black Crows: A bearish formation consisting of three consecutive long bearish candles. Each candle closes lower than the previous one, suggesting a strong potential downward movement.
Three Inside Down: A bearish reversal pattern. It consists of a bullish candle, a smaller bearish candle that is completely within the range of the previous candle, and a larger bearish candle.
Three Outside Down: A three-candle pattern. It starts with a bullish candle, followed by a larger bearish candle that completely engulfs the previous bullish candle, and then another bearish candle.
Neutral Candlestick Pattern
A neutral candlestick pattern doesn’t strongly indicate either a bullish or bearish trend. It’s like a yellow light, suggesting caution and indicating that the market is uncertain or indecisive about its direction. Traders look at these patterns to assess the market’s stability or potential upcoming change in trend.
Single Candle Patterns: [/b
Doji: A single candlestick pattern with a small body, indicating market indecision. It suggests a potential trend reversal, whether bullish or bearish.
Spinning Top: A single candlestick pattern with a small body and long upper and lower wicks, signaling market indecision and potential trend reversal.
High Wave: A single candlestick pattern characterized by a long upper and lower wick relative to the body, suggesting high market volatility and uncertainty.
Double Candle Patterns:
Tweezer Top: A two-candle pattern occurring after an uptrend, characterized by two consecutive bullish candles with similar highs, suggesting potential resistance and a bearish reversal

Think like a Hedge-FundImagine that you are a Hedge-Fund manager, you have a lot of money to invest.
You are looking to invest in AAPL for example.
Let's assume for the debate, that you as a fund manager can buy any amount of stock that is traded that day.
This assumption is made because we want the Anchored VWAP to represent our position line.
Anchored VWAP = is a tool that you can use that calculates the average price of volume that was traded from a certain point.
In practice, since you don't have a lot of money, if you could buy 1/100M stocks each day (100M is avg volume, which means you will buy /100M), your position line will be very similar, but proportional to a private account.
You decide to grow your position line when the price is after a big correction and it moved above the EMA.
You go only LONG, you buy every stock that is traded (you are a Huge hedge fund manager, remember?)
Path 1:
You start to accumulate a position. Your position line is growing in size, but it also rises in price since you are buying stocks at a higher price.
In green, you can see your position line which is also your break-even line.
As you can see, the price is always above the green line, which means that you are in GREEN all the time while you are in this buying campaign.
Path 2:
The light blue line is where your position line will get "stuck" and will not rise if you decide to stop and not add more to your position from that point in time.
Path 3:
Path 3 is your position line given that you keep adding to your position even in the sideways action. You just keep buying and buying.
Red line:
The red line is the Anchored VWAP that will be if you want to start selling all your position. You sell every day and keep selling.
This is your average selling line.
Conclusion:
You can see that either if you choose path 2 or 3, you will all the time be in GREEN position.
If you choose to stop buying and start selling (Path 2), your average return on the position will be 32%.
You entered little by little, minimum risk in the position. You have a lot of "AIR" from path 2 to where the price is currently in.
This post is a continuation of the post about average-up strategy. The same line of thinking.
If you like, follow and like this idea so it will be saved in your saved ideas for future reference.

ETX Easy Trading X-Strategy Basic Analyse Bitcoin Long Position Warum Bitcoin in jedes Portfolio sollte.
1: Bitcoin ist ein unkorreliertes Asset
2: Diversifizierung, BTC optimiert Rendite-Risiko-Verhältnis
3: Bitcoin hat ein hervorragendes Stock-to-Flow Verhältnis
4: Bitcoin Adoption schreitet rasch voran
5. Bitcoin hat ein sehr gutes Sharpe Ratio im Vergleich zu anderen Vermögenswerten.
6. Die Wall Street investiert bereits hohe Millionen Beträge in Bitcoin
7. Bitcoin ist ein deflationäres Geldsystem
8. Bitcoin hat alle Eigenschaften von Geld und eignet sich besonders gut zur langfristigen Wertaufbewahrung
9. Bitcoin skaliert Sicherheit!
10. Vermögenswerte sind besonders Interessant bevor die breite Masse investiert hat.
