FVG & ORB5-Minute ORB + FVG Day-Trading Playbook (ES/NQ)
What you need
Platform: TradingView for markup; your execution platform (e.g., TopstepX / your broker) for orders.
Chart: ES (S&P 500 futures) or NQ (Nasdaq futures). Timeframe: 5 minutes.
Indicators:
Volume
Fair Value Gap
Key Levels (15-Min/5-Min Opening Range, New York Session or London)
Chicago time (your local): NY cash open is 8:30 a.m. CT. The “US evening reopen” (the Globex reopen) is 5:00 p.m. CT (use with caution; liquidity can be thin).
The strategy in one page
1) Define the Opening Range
Use the first 5-minute bar after the NY cash open (8:30:00–8:34:59 CT).
Mark ORH = that bar’s high, ORL = that bar’s low.
2) Direction filter = FVG
Bearish setup: Price breaks below ORL, and there is a bearish FVG nearby that has not been fully filled.
Bullish setup: Price breaks above ORH, and there is a bullish FVG nearby that has not been fully filled.
If an FVG fills/invalidates immediately after the break, skip the trade.
3) Entry
Enter on the break (or on a tiny retrace back to the level) in the FVG direction:
Below ORL with a short bias when a bearish FVG stands.
Above ORH with a long bias when a bullish FVG stands.
4) Stop & Target (bracket)
Stop: default at the opposite OR level (conservative).
Short below ORL → stop just above ORL (or the nearest invalidation level if tighter is justified).
Long above ORH → stop just below ORH.
Target: aim for 2R (risk:reward = 1:2), close above half, and trail the rest.
Example: If your stop is 10 ES points (=$500 per contract), target 20 ES points (=$1,000 per contract).
5) Risk per trade
Pick a fixed dollar risk that protects your account limits. With a $50k evaluation & ~$2,000 trailing max loss, many traders use $100–$300 per trade and micros (MES/MNQ) to scale precisely.
Contract & tick quick-ref
ES: 1 point = $50 (tick = 0.25, $12.50/tick)
NQ: 1 point = $20 (tick = 0.25, $5/tick)
MES (micro ES): 1 point = $5
MNQ (micro NQ): 1 point = $2
Sizing example, with MES (conservative)
You want a max loss of $200~300.
Signal requires 4 ES points to stop (=$200/contract).
Trade 1 ES or 4 MES (same risk), target 8 ES points for 2R.
Exact checklist (print this)
Pre-market
Chart on 5m, session = New York.
Mark ORH / ORL after the first 5-min bar closes.
Confirm bias by FVG: bullish FVG above / bearish FVG below, still unfilled.
News/Volatility check (FOMC/CPIs/major earnings): be extra cautious or skip.
Entry
Price breaks ORH/ORL in the same direction as the FVG.
No immediate fulfillment of that FVG.
Place bracket: Stop at opposite OR level (or clear invalidation), Target = 2R.
Manage
Set-and-forget if you struggle with tinkering.
If it snaps back and fully fills the FVG, early flattening is allowed by your rules (consistency > perfection).
No averaging losers.
Post-trade
Journal the screenshot, OR values, FVG state, R multiple, and any deviation from the plan.
When to skip
The first break immediately reverses and fully fills the FVG.
The OR is abnormally wide; the stop would exceed your risk budget.
Chop: multiple whipsaws through ORH/ORL within a few bars.
Event risk minutes away (e.g., CPI/FOMC); spreads/volatility unpredictable.
Low volume conditions (late sessions, holidays), unless your data says you have an edge there.
A realistic take on funded accounts & pacing
Evaluations often have daily loss, trailing drawdown, and max position rules. Treat the trailing specifically as if it’s glued to your closed PnL high-water mark—don’t let one impulsive add blow the account.
Keep resets rare by capping loss/day (e.g., 1–2R). One clean 2R win can offset two 1R losses.
Micros let you keep your exact dollar risk steady as the OR width changes day to day.
Routines that help
Two windows: TradingView (markup) and Execution DOM/ladder. Copy ORH/ORL and draw a rectangle for the FVG if your execution platform lacks the indicator.
Auto-brackets: pre-define your $ risk and 2R target so every entry is consistent.
Two sessions max: NY opens first; optionally, the US evening reopens (5:00 p.m. CT) only if your data says you have positive expectancy there.
Trade less, filter more: It’s normal to get 2–3 quality trades/week. No setup → no trade.
A compact rules card (copy/paste)
Timeframe: 5m. Levels: First 5-min bar → ORH/ORL.
Filter: Trade only with an unfilled FVG in the same direction as the OR break.
Entry: Break of ORH (long) or ORL (short).
Invalidation: FVG fully filled right after break → stand down/exit.
Stop: Opposite OR level (or nearest structure that truly invalidates).
Target: 2R.
Risk: Fixed $ per trade; use micros to fit the plan.
Daily max: 1–2R down → stop for the day.
Journal every trade (screenshot + R result + notes).
Journal template (quick)
Date / Ticker / Session (NY/Evening)
ORH / ORL values; OR width (points)
FVG direction & location (filled? unfilled?)
Entry price & rationale (break + FVG alignment)
Stop (points/$), Target (points/$), Size (contracts)
Outcome (R): __
Did I follow the plan? Y/N (what deviated?)
Screenshot link
Guardrails (important)
“Making money in days” is possible but not typical; survivorship bias is real. Your edge is strict filtering + small, repeatable risk + patience.
Commissions/slippage matter—micros help sizing but raise the per-rake cost %; include this in your journaling.
Don’t scale to full contracts until your live track record shows consistency over at least 20–30 trades following the exact rules.
Screener:
www.tradingview.com
Orb

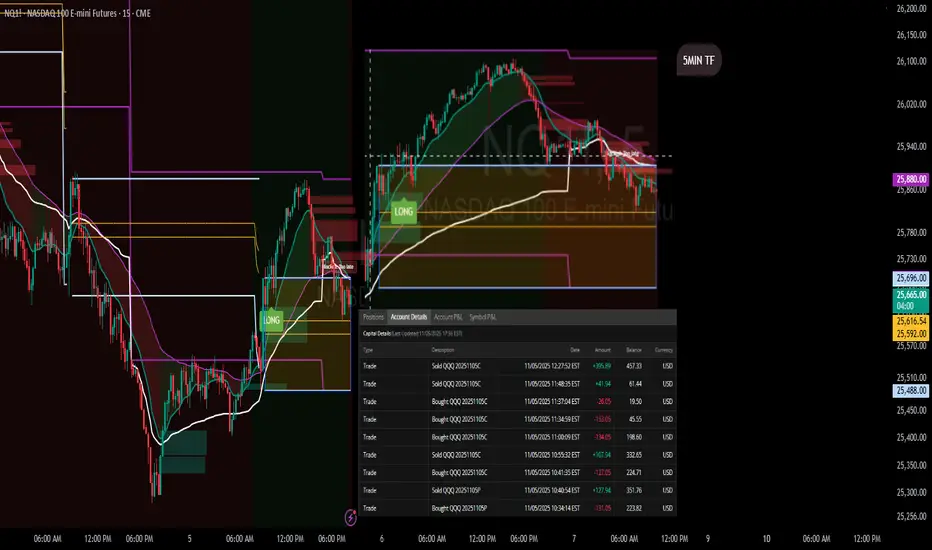
Trades with B – Daily Recap (Nov 6 2025)Ticker: QQQ / NQ1! (5 min & 15 min TF)
Strategy: ORB Pro + Golden Pocket Retest + Volume Filter
Focus: Confirmation Entry + HTF Trend Confluence
🧭 Market Context
The Nasdaq futures (NQ1!) opened with a sharp push into a key supply zone marked by the previous day’s Golden Pocket.
After an early fake push up, the market rolled over cleanly beneath the EMA cluster and the ORB box on both timeframes.
The first true confirmation signal came mid-morning — the 15 min and 5 min timeframes synced short, and the volume aligned perfectly with trend continuation.
🧠 Trade Review
Entry: 11:02 EST QQQ $613 Put (ORB Pro Short Trigger)
Exit: 11:35 EST — ORB extension target hit → secured profit into momentum flush
System Validation: Perfect alignment across EMA trend + HTF bias + retest rejection signal
P/L: +$199.78 net profit ( + $289.94 closed gain – $190.05 entry cost )
This trade was clean — confirmation entry, defined risk, and no over-trading.
📊 Performance Snapshot
Metric Value
Win Rate 100 % (today’s single trade)
Best Trade +$289.94
Largest Loss – $190.05
Net Result +$199.78 (Realized)
Setup Accuracy Excellent – Full confirmation alignment
📈 Chart Breakdown
The ORB Pro short triggered as price retested the upper Golden Pocket zone and failed to hold above the purple EMA band.
Both the 15 min and 5 min charts show a clean EMA curl-down with volume confirmation.
The short target zone was hit precisely before a small midday bounce, validating the system’s filter timing.
💡 Key Takeaways
Wait for alignment – when HTF and LTF agree, you get momentum moves.
Clean entry > early entry – confirmation beat anticipation again.
ORB Pro filter precision – blocked late entries, protecting the green.
🧘♂️ Reflection
“The setup was textbook — patience finally paid off. One trade, one signal, and one profit. The goal now is simple: keep filtering for these perfect alignments and size up responsibly as consistency builds.”
🧩 Next Steps
✅ Focus only on HTF + LTF confirmation signals
✅ Avoid re-entries once target zone is hit
✅ Document each setup screenshot for pattern library

ORB Pro Signal Recap – Nov 5, 2025 | “Respect the Levels”Ticker: QQQ / NQ1! (5-min + 15-min TF)
Strategy: ORB Pro + Trendline Breakdown + Previous Day High Rejection
Focus: Signal confirmation & reaction zones
🧭 Market Context
The morning started strong, with buyers pushing off the open toward the previous day’s high (PDH) and ORB extension zone.
As price tapped the upper band, the ORB Pro system generated a clean long confirmation, aligned with the higher timeframe momentum.
But the rally quickly stalled at the PDH — a textbook reaction zone where the structure shifted.
From there, trendline breakdowns on both 5-min and 15-min charts confirmed exhaustion, and the system correctly prevented new long entries once momentum failed.
💹 Trade Breakdown
Initial Long: Taken on ORB Pro signal confirmation near the intraday retest (strong follow-through into PDH).
Profit-Take Zone: Price rejected sharply at the PDH and VWAP cluster — partials locked.
No Chasing: After the rejection, ORB Pro flagged “Blocked / Too Late,” keeping risk managed while trend flattened.
Result: Finished the day green with multiple small wins across calls — +$89.68 net on the $623C and +$15.89 on $626C.
📊 Performance Summary
Symbol Side Contracts Net Result
QQQ $623C Long 2 +$89.68
QQQ $626C Long 1 +$15.89
QQQ $622P Short hedge 1 –$3.11
Total P/L + $102.46 (Realized)
📈 Chart Recap
Price pushed through the early range with momentum but stopped exactly at the previous day’s ORB high and Fib confluence.
That rejection aligned perfectly with the HTF resistance zone on both 5-min and 15-min TFs.
The chart shows two green “LONG” entries and a clean signal fade once volume dropped —
a prime example of respecting structure over bias.
💡 Key Takeaways
PDH = Reaction Zone: Don’t ignore prior highs — they mark algorithmic defense zones.
Trust the Filters: ORB Pro prevented chasing the failed continuation after PDH rejection.
Structure First: The trendline breakdown confirmed what price was already telling us.
🧘♂️ Reflection
“The system signaled the move early, and I followed structure. PDH rejection confirmed the top, and discipline locked the profit. The goal wasn’t to predict — it was to react with control.”
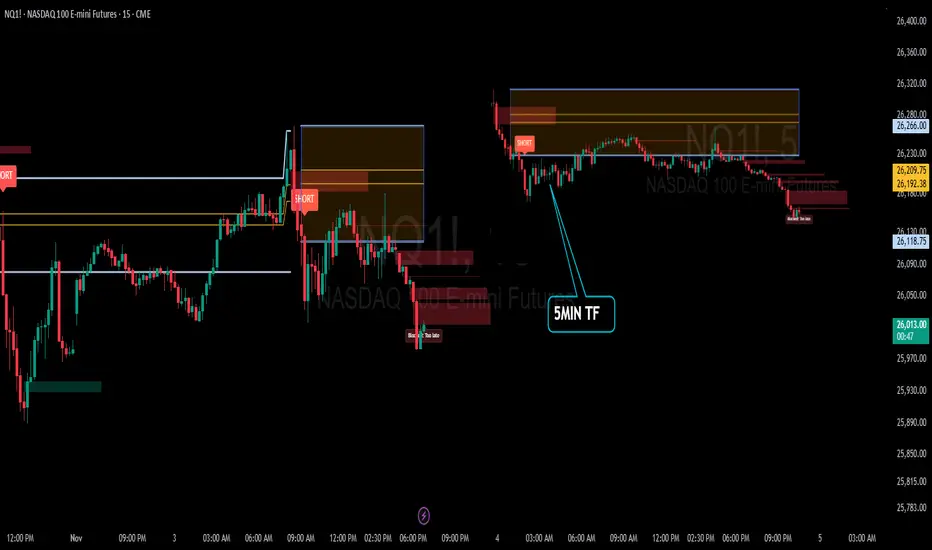
Recap: ORB Pro in Action | “Discipline > Direction”Date: November 3rd 2025
Ticker: QQQ / NQ1! (5-min TF)
Strategy: ORB Pro + Golden Pocket Retest + Volume Filter
Focus: Trend confirmation & controlled execution
🧭 Market Context
The morning opened sideways inside the ORB range — no clean conviction early on.
Around mid-morning, sellers gained control as lower highs formed beneath the EMA band and the Golden Pocket retest (0.5/0.618) failed with volume confirmation.
That break produced the clean short setup of the day, perfectly aligned with the higher-timeframe (HTF) downtrend.
🧠 Trade Review
Early Entries: Entered pre-confirmation and took initial heat.
Mid-Morning Setup: All filters aligned — EMA, volume, HTF direction. This was the textbook short that delivered follow-through.
Late Session Attempts: Momentum faded after lunch, with signals correctly blocked as “Too Late.”
Result: Several small wins offset by early losses, closing the day + $7.34 realized P/L after fees.
📊 Performance Snapshot
Metric Value
Win Rate ≈ 42 %
Best Trade + $287.94
Largest Loss – $189.05
Net Result + $7.34 (Realized)
Setup Accuracy High — execution mixed
📈 Chart Breakdown
The 5-minute chart highlighted a short trigger around 26 260 – 26 280, with smooth continuation into ORB extensions.
The ORB Pro filter marked “Blocked / Too Late” after the move — confirming that the system logic protected capital from late chases.
💡 Key Takeaways
Patience > Prediction — early entries rarely pay off.
Protect Green — partial profit lock once 1 R:R is reached.
System Strength — ORB Pro continues to validate structure when filters align.
🧘♂️ Reflection
“The system nailed the move — I jumped early. Still finished green, proving that execution discipline is the real edge. Tomorrow’s goal: one clean setup, one confident hold, and protect the profit.”
🧩 Next Steps
✅ Wait for full confirmation before entry
✅ Hold until 1:2 R:R min
✅ Avoid re-entries once HTF zone is tapped
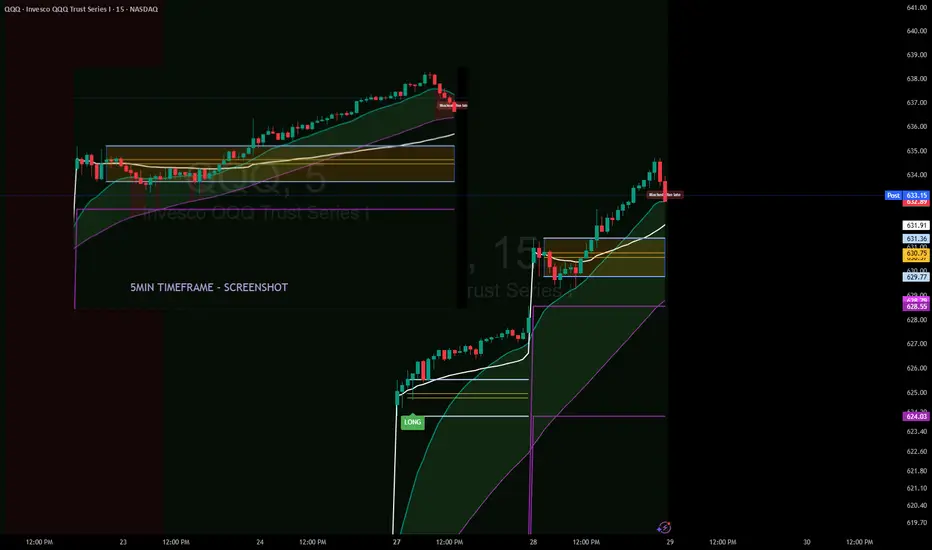
Recap: No Signal? No Problem. Reading Price Like a ProFellow Traders,
I had some time today to do a quick recap — let’s break it down.
Opening Morning
What happened? Exactly what needed to happen: nothing.
No signal. No golden pocket retracements. Nothing worth forcing a trade.
We saw a break of the ORB at 10:40 AM on the 5-minute chart. A bearish candle closed just below that level, but there was no signal giving any conviction of a further move.
Between 10:00 AM and 10:20 AM, the 5-minute candles also showed no real conviction. Even though they played right in the Golden Pocket, there was no close inside the pocket itself.
Looking for confluences in other signals — particularly the 0DTE Context Indicator — price action on both the 5-minute and 15-minute charts never pushed below any of the EMA, SMA, or VWAP lines. Again, no conviction for the bears to step in.
First Entry
I played the waiting game today. My first trade on QQQ 0DTE didn’t happen until 11:05 AM. When I saw price holding above my lines and refusing to break lower, I knew a trade was setting up to the upside.
You’re probably wondering what kind of contracts I took.
I typically trade CALL or PUT options with a Greek Delta of 0.40 or higher, which puts me just under an ITM option. Once I’m in, I aim for a 50% profit target, which can come fast with the right move. The lower the Delta, the higher the risk — so I keep it tight.
If you want more details on how I time those entries, feel free to DM me.
Price Action Confirmation
After entering, I made a few additional plays as price began to push above my 0DTE Context Indicator lines. On the 5-minute chart, the candles between 12:05 PM and 12:20 PM played directly into the Golden Pocket — this gave me strong conviction that price was heading for new highs.
Final Thoughts
Today was a bit tricky. It required more patience and reading the tape than I would have liked. But as traders, we’ll see plenty of days like this. The key is to not overstay your welcome. Don’t force trades. Let price action finish its story before making your move.
I hope these recaps help you better understand how to use the indicators I’ve built. If you have any questions or feedback, drop a comment or DM me — I’d love to hear from you.
Thank you again for the continued support.
— TradeswithB
RECAP TODAY. USING THE SIGNALS AND TOOLS Fellow traders - followers,
I have some today to recap on the day.
Now I will say this. Today went the way they said it would go UP! All the overnight new, the morning media and the tech headlines all made today a profitable day for the bulls! I will also say this: it is a scary situation, because we have no resistance levels up here, so where does all this up trend movement stop? What do we know or where to put our stop losses?
In building these indicators, I'm learning a few things. I'm learning more about myself and about what to look for exactly. There will be days where I will lose. Just like Friday: -$280! The price action was just not as consistent and friendly like it was today.
Let me break down today:
1. I attached the 5min chart to show you what the " Golden Pocket " of my indicator resembles.
A confirmation of price action and direction.
It reacted perfectly. 10:15am Bear candle - 10:20am Bull Doji inside pocket - 10:30am Engulfing Bull candle with a long signal! You couldn't ask for a better set up to the upside to make your money!
2. The 15min time frame was a little more of a bulky solid read. Bull candles with wicks.
The 10:15am candle carried the long signal with it. The wick within that candle was our 5min candles playing out.
Weather you waited for the 15min plays or you entered in the 5mins. You won.
3. So, with all this, there is another indicator I play. That is my 0dte Context bundle. How this works in our favor is that in this specific situation you want to make sure your trends are moving where they need to go. The EMA, SMA and VWAP lines all had same up direction. The Green EMA/SMA Cloud all indicated up is where it's going.
You have the tools to assist in decisions. If you need more help with reading these indicators. Let me know. I'm always down to help out.
Patient is still key. Confirmations are still key. Remember that when trading. Do not get antsy and enter in trades that are not strong or that will not check all your entry boxes.
Thank you again for the follows and the support. I hope these are helpful.
God Bless,
Trades with B!

Timely Opening Range Breakout Strategy (TORB)Today, I’ll tell you about an amazing research study back from 2019 by a team of Taiwanese researchers, “Assessing the Profitability of Timely Opening Range Breakout on Index Futures Markets.”
Takeaway: The study's results are compelling. Implementing the TORB strategy yielded over 8% annual returns across the tested markets. Remarkably, the TAIEX index showcased a staggering 20.28% annual return. These numbers underline the potential of TORB in maximizing trading gains.
█ What is Open Range Breakout?
Open Range Breakout (ORB) is one of the simplest and safest strategies day traders use in a relatively low-volatility market. Opening Range means exactly just that. You check an asset's highest and lowest price in a certain time frame (usually 15 to 60 minutes) from the market's opening time.
These levels become your resistance and support that guide your trading plan for that day. Say if your chosen stock price goes higher than the highest level after the opening range; it indicates a bullish run for the day. Conversely, it indicates a bearish run if the price loses support in a downward trend.
█ Timely Opening Range Breakout Strategy
ORB has a certain set of challenges, especially for volatile markets. The Timely Open Range Breakout (TORB) strategy has been proposed in response to these challenges.
TORB leverages high-frequency intraday data and aligns trading strategies with the active hours of the underlying stock markets.
By analyzing one-minute intraday data from 2003 to 2013 across various markets, including DJIA, S&P 500, NASDAQ, HSI, and TAIEX, the study by Yi-Cheng Tsai et al. demonstrates the effectiveness of this strategy.
The key lies in identifying the 'active hours' of the market, aligning with the opening range of the underlying index.
█ 1. PMMV and PMVR:
The research paper introduces two critical variables for the TORB strategy: Per-Minute Mean Volume (PMMV) and Per-Minute Variance of Return (PMVR). These metrics are essential in identifying the most active hours for futures market trading.
PMMV provides a snapshot of the market's activity level at each minute of the trading day. PMVR is crucial for understanding the volatility or the degree of fluctuation in the market at each minute.
PMMV (Per-Minute Mean Volume) is calculated by averaging the trading volume in a one-minute interval over a specified number of trading days.
The graph shows that the German 40 is most active during the London opening and 30 minutes into the New York opening.
PMVR (Per-Minute Variance of Return) measures the variance of the one-minute returns, calculated as the logarithmic difference between the closing prices of one-minute intervals.
Using PMVR, the German 40 is most active during the London opening session and approximately one hour into the New York session.
█ 2. TORB Trading Rules:
Basic ORB trading rules are applied here.
Buying pressure dominates if the price moves above the resistance level, suggesting potential upward price movement. Conversely, selling pressure prevails if the price falls below the support level, indicating a possible downward trend.
These rules are applied within the active trading hours, defined by the PMMV and PMVR metrics.
Buy Signal
Sell Signal
The strategy also defines three key time points: the beginning of the observed period, the end of the observed period (probe time), and the time of closing the position. The prices at these specific times determine the conditions for buying and selling.
█ 3. Data Sets:
The study utilized two main datasets for its experiments:
Intraday Data of Five Futures Markets: This dataset includes one-minute intraday data of the E-mini futures of the DJIA, S&P 500, NASDAQ 100, HSI (Hong Kong), and TAIEX (Taiwan). The period covered ranges from 2001/2003 to 2013, providing a comprehensive overview of these markets over a decade.
Transaction Data for TAIEX Index Futures: This dataset contains detailed transaction data for the TAIEX index futures, covering the period from 2006 to 2013. It analyzes the relationship between TORB signals and trader behavior in the Taiwanese market.
Interestingly, the research even considers the global financial crisis of 2007-2008, presenting test results for two sub-periods: before and after 2007. This approach ensures a thorough understanding of the strategy's performance across different market conditions.
█ Results and Analysis
1. TORB Profitability Test:
The TORB profitability test involved back-testing the strategy for the five futures markets.
DJIA, S&P, and NASDAQ results revealed that strategies with probe times in the early stages yielded significantly higher annual returns.
DJIA: The results showed that TORB transactions decreased as the probe time moved away from the beginning of active hours. This implies that the strategy was most effective when applied close to market opening times.
S&P and NASDAQ: Similar to the DJIA, these markets also showed that strategies with early-stage probe times earned higher annual returns.
Additionally, the TAIEX results demonstrated that TORB strategies earned significantly higher returns with probe times of less than 200 minutes.
2. Impressive Returns:
The study's results are compelling. Implementing the TORB strategy yielded over 8% annual returns across the tested markets. Remarkably, the TAIEX index showcased a staggering 20.28% annual return. These numbers underline the potential of TORB in maximizing trading gains.
It also found that the best probing times were shorter in the U.S. markets and longer in Asian markets.
The research demonstrated that TORB strategies yielded consistently higher returns than traditional TRB (Trading Range Breakout) strategies, with no significant results in profitability tests for all TRB strategies across the five futures markets.
To provide a clear picture, here's a summary of the daily returns for each market analyzed:
E-mini DJIA: See Table 1 from the research paper
E-mini S&P: See Table 2 from the research paper
E-mini NASDAQ and HSI: See Tables 3 and 4 from the research paper
TAIEX: See Table 5 from the research paper
The active hours, identified by peaks in PMMV and PMVR, played a crucial role in the strategy's success.
For instance, the E-mini DJIA showed peaks around 8:30 AM and 3:15 PM, coinciding with the opening and closing times of the underlying market. Similarly, peaks were observed for HSI around the opening, closing, and lunch break times.
█ Relationship Between TORB Signals and Trader Behavior
The study also examined the relationship between TORB signals and trader behavior, particularly in the TAIEX futures market.
It was observed that the daily volume for individual traders was about twice that for institutional traders. The returns of the TORB strategies were positively related to the net buy positions of institutional traders both before and after the breakout.
This suggests that by following the TORB signals, one could trade in the same direction as institutional traders and obtain positive returns.
Specifically, the returns of the TORB strategies were significantly and positively related to foreign investment institutions, both before and after the breakout, indicating that TORB signals align with the trading direction of the most informed traders in the Taiwan market.
█ Reference
Y.-C. Tsai, M.-E. Wu, J.-H. Syu, C.-L. Lei, C.-S. Wu, J.-M. Ho, and C.-J. Wang, "Assessing the Profitability of Timely Opening Range Breakout on Index Futures Markets," IEEE Access, vol. 7, pp. 32061- 32071 Mar. 2019.
-----------------
Disclaimer
*Our results are approximate. We encourage you to test the assumption yourself. We do not guarantee that you will get the same results. This is an educational study for entertainment purposes only.
The information in my Scripts/Indicators/Ideas/Algos/Systems does not constitute financial advice or a solicitation to buy or sell securities. I will not accept liability for any loss or damage, including without limitation any loss of profit, which may arise directly or indirectly from the use of or reliance on such information.
All investments involve risk, and the past performance of a security, industry, sector, market, financial product, trading strategy, backtest, or individual's trading does not guarantee future results or returns. Investors are fully responsible for any investment decisions they make. Such decisions should be based solely on evaluating their financial circumstances, investment objectives, risk tolerance, and liquidity needs.
My Scripts/Indicators/Ideas/Algos/Systems are only for educational purposes!

Indicator idea " USX "USX is the average of NAS100 , SPX500 and US30 (all from BLACKBULL data provider).
( average of the 3 Open = O ),
( average of the 3 High = H),
( average of the 3 Low = L),
( average of the 3 Close = C),
Plotted as candles using thoses OHLC, making a chart representing the average price action of indexes.
It is preferable to use on 15m TF (read the ORB part below).
Usage and inputs :
- An important part is the ORB box (Opening Range Breakout) sometime reffered as OPR (Opening Price Range).
This plot a box based on market opening candle (NY time, 15m) high & low.
This box will be colored green if close is above the half value of the box and red if below.
A basic strategy for Stocks and Indexes traders is to wait after open that the price break that 9h30 to 9h45 range an enter accordingly for a scalp in the dominant direction.
( Doesn't work everytime, even less for crypto, but i've been using this tool on each separate index for some time and let me tell you, at NY open the world is always somehow correlated to what happen in Wall Street. )
- Additionnal sma21,55,89 and AMA (the average of the 3 sma).
Optionnal trend confirmation based on the position of close relative to the 3 sma (simultanously above or below) and colored background assiociated.
- The possibility to use VERY lengthy (tweakable) RSI rather than standard average $ values but it's not very effective as the candles look awful (on any big timeframes)...
- In the input you can adjust the % of each of the 3 index in the total from 0% to 100%, so you can, for exemple put NASDAQ % IN INDEX more important than S&P % and DOWJONES even lower (as Crypto-currencies are generally more related to Tech sector).
That's it for now,
Don't hesitate to ask question, even if I've already said too much...
PS: That only an idea, yes the indicator is created and functionnal. Maybe i'll publish it, probably free + open source as i anyway explained everything ;)
Peace, may the profit be with you all
