Options Blueprint Series [Intermediate]: ES Condor in the Clouds1 — The Market in a Cloud Layer
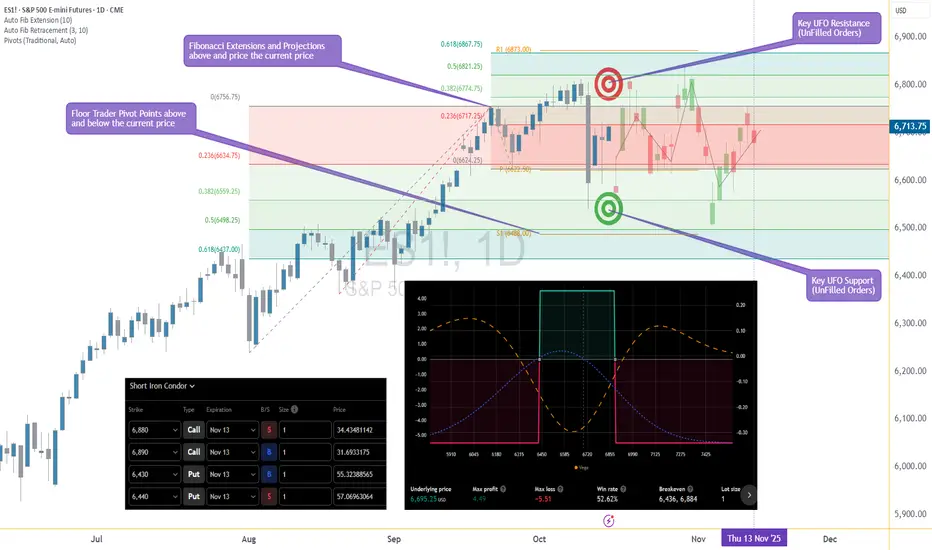
The S&P 500 (E-mini and Micro E-mini) futures have recently been caught in a curious atmospheric pattern — not of weather, but of price action. After a strong sell-off shook the market a few days ago, both Fibonacci extensions and retracement zones now cluster densely above and below the current price. When these are joined by multiple Floor Trader Pivot Points and Unfilled Order (UFO) zones sitting in similar regions, a clear message emerges: this market is potentially trapped in a range.
Resistance has been repeatedly observed near 6,873, while the lower boundary around 6,437 continues to attract buyers. The index seems to be trapped between Fibs — a typical post-volatility consolidation phase.
For traders who understand that sideways markets can be just as valuable as trending ones, this environment presents an opportunity. Instead of chasing direction, the goal becomes to capture time decay while staying within defined risk limits.
2 — The Strategy: Short Iron Condor Fundamentals
A Short Iron Condor combines two credit spreads:
A short call spread above current price
A short put spread below current price
Together, they create a “no-fly zone” for the underlying — a region where the trader earns maximum profit if price remains between the inner strikes.
This position benefits from:
Stable or neutral price movement
Time decay (theta)
Declining implied volatility
The Iron Condor offers defined risk and defined reward, making it a powerful candidate for range-bound markets like the current ES setup. While the maximum gain is limited to the net premium collected, the maximum loss is also capped, making this a risk-defined non-directional strategy.
Because this structure has both call and put spreads, it offers low Vega exposure — meaning it’s not overly sensitive to volatility shocks. For intermediate traders, this makes it a comfortable way to step beyond simple single-leg strategies and into the world of multi-leg, theta-driven structures.
3 — The Setup: Building the ES Condor
For this idea, we’re looking at the ES (E-mini S&P 500 Futures) options expiring on November 13.
The structure is built as follows:
Sell 6880 Call @ 34.43
Buy 6890 Call @ 31.69
Buy 6430 Put @ 55.32
Sell 6440 Put @ 57.07
This results in a net credit, generating the potential for a maximum profit of 4.49 points (per spread), while the maximum risk stands at -5.51 points. The reward-to-risk ratio comes to approximately 0.8:1, with a statistical win rate of 52.6% based on the current volatility surface, and the Breakeven points: 6,436 and 6,884.
As long as the ES price remains between these levels by expiration, the structure will achieve profitability. The Iron Condor works best when volatility remains stable or contracts — a condition currently supported by the post-drop equilibrium visible in implied volatility readings across near-term expirations.
4 — Chart Context: Technical Landscape Supporting the Range
The chart of the E-mini S&P 500 Futures (ES) reveals a tight compression zone forming between Fibonacci extensions and retracement levels above @ 0.618 (≈6,868) and below @ 0.618 (≈6,437). This overlap with Floor Trader Pivots — specifically R1 at 6,873 and S1 at 6,488 — paints a classic range structure. This setup can be the natural habitat for an Iron Condor.
While directional traders may feel frustrated by sideways movement, option sellers can see this as a period of controlled opportunity — where theta decay compensates for the market’s hesitation.
In other words, as long as ES continues to “hover in the clouds,” the Condor quietly collects premium.
5 — CME Product Specifications and Margins
Understanding the underlying contracts is essential when selecting between E-mini S&P 500 Futures (ES) and Micro E-mini S&P 500 Futures (MES) for this options setup.
E-mini S&P 500 (ES) Futures
Tick Size: 0.25 = $12.50 per tick
Trading Hours: Nearly 24 hours (Sunday–Friday, CME Globex)
Margin (approx.): $21,000 per contract
Micro E-mini S&P 500 (MES) Futures
Contract Size: 1/10 of ES
Tick Size: 0.25 = $1.25 per tick
Margin (approx.): $2,100 per contract
(Margins may vary slightly depending on volatility and broker policies.)
For smaller accounts or for traders looking to practice scaling and hedging, the MES provides a highly capital-efficient alternative to ES.
When executing the Short Iron Condor, traders may also consider margin offsets if the structure is risk-defined — a benefit when using portfolio margin accounts. However, margin usage will vary by broker and account type.
6 — Risk Management: Keeping the Condor in the Clouds
Every Iron Condor begins with a disciplined approach to risk.
Here’s how it can be managed:
Position Sizing: Determine exposure based on the maximum loss, not the credit received. For instance, risking 1–2% of account equity per structure keeps risk contained even during volatility spikes.
Exit Before Expiration: Avoid gamma risk in the final days. Closing the trade when 50–60% of the maximum profit is achieved can reduce time risk while locking in gains.
Adjustments: If price nears a breakeven zone (6,436 or 6,884), traders can consider rolling the threatened side further away or closing half of the position to reduce delta exposure.
Volatility Awareness: A volatility spike can temporarily pressure the mark-to-market value.
Because the Iron Condor is short Vega, it benefits from a calm or contracting volatility regime.
When markets are calm, this strategy works beautifully; when storms approach, it’s time to bring the Condor to the ground.
When charting futures, the data provided could be delayed. Traders working with the ticker symbols discussed in this idea may prefer to use CME Group real-time data plan on TradingView: www.tradingview.com - This consideration is particularly important for shorter-term traders, whereas it may be less critical for those focused on longer-term trading strategies.
General Disclaimer:
The trade ideas presented herein are solely for illustrative purposes forming a part of a case study intended to demonstrate key principles in risk management within the context of the specific market scenarios discussed. These ideas are not to be interpreted as investment recommendations or financial advice. They do not endorse or promote any specific trading strategies, financial products, or services. The information provided is based on data believed to be reliable; however, its accuracy or completeness cannot be guaranteed. Trading in financial markets involves risks, including the potential loss of principal. Each individual should conduct their own research and consult with professional financial advisors before making any investment decisions. The author or publisher of this content bears no responsibility for any actions taken based on the information provided or for any resultant financial or other losses.
Rangetrading
XAUUSD 1H - Consolidations Trading Setups - C.I.R.C. MethodThe chart above showcases various consolidations and their formation dynamics.
Consolidation, Initiation, Retracement, Continuation (CIRC)
Consolidations
What are “consolidations”?
Consolidations, often labeled as “ranges” in mainstream trading, hold a deeper meaning at T.T.T. Here, consolidations are the playgrounds of the BFI, zones where prices oscillate between highs and lows, as illustrated below. Within these confines, intentions simmer as BFI stack orders to propel future price movements. We confidently trade consolidations, fully aware of the intricate dynamics unfolding within the market’s underbelly.

XAUUSD 15M - Consolidations Trading Setups - C.I.R.C. MethodThe chart above showcases various consolidations and their formation dynamics.
Consolidation, Initiation, Retracement, Continuation (CIRC)
Consolidations
What are “consolidations”?
Consolidations, often labeled as “ranges” in mainstream trading, hold a deeper meaning at T.T.T. Here, consolidations are the playgrounds of the BFI, zones where prices oscillate between highs and lows, as illustrated below. Within these confines, intentions simmer as BFI stack orders to propel future price movements. We confidently trade consolidations, fully aware of the intricate dynamics unfolding within the market’s underbelly.

Options Blueprint Series: Iron Condors for Balanced MarketsIntroduction:
In the nuanced world of options trading, the Iron Condor strategy stands out as a sophisticated yet accessible approach, especially suited for markets that exhibit a balanced demeanor. This strategy, belonging to the "Options Blueprint Series," is designed for traders who seek to harness the potential of stable markets. Iron Condors offer a way to generate profit from an underlying asset's lack of significant price movement, making it an ideal choice for periods characterized by low volatility.
Understanding Iron Condors:
An Iron Condor is a non-directional options strategy that aims to profit from a market that moves sideways or remains within a specific range. This strategy involves four different options contracts, specifically two calls and two puts, all with the same expiration date but different strike prices. It combines a bull put spread and a bear call spread to create a profitable zone.
To construct an Iron Condor, a trader sells one out-of-the-money put and buys another put with a lower strike price (forming the bull put spread), while also selling one out-of-the-money call and buying another call with a higher strike price (forming the bear call spread). The essence of this strategy is to collect premium income from the options sold, with the trade being most profitable if the underlying asset's price remains between the middle strike prices of the calls and puts sold.
The Iron Condor is lauded for its ability to generate returns in a stagnant or mildly volatile market, making it a preferred strategy among traders who anticipate little to no significant price movement in the underlying asset. However, it requires precise execution and an understanding of the underlying market conditions to mitigate risk and optimize potential returns.
Market Analysis:
The current financial landscape often presents scenarios where markets exhibit balanced behavior, characterized by low volatility and minor price fluctuations. In such environments, traditional directional trading strategies might not always offer the desired outcomes due to the lack of significant market movements. This is where the Iron Condor strategy shines, serving as an ideal tool for traders aiming to capitalize on market stability.
Balanced markets are typically observed during periods of economic uncertainty or when major market-moving events are anticipated but have yet to occur. Investors' wait-and-see attitude during these times results in a trading range where prices oscillate within a relatively tight band. Utilizing Iron Condors in these scenarios allows traders to define a price range within which they believe the market will remain over the life of the options contracts. Successfully identifying these ranges can lead to profitable trades, as the sold options will expire worthless, allowing the trader to retain the premiums received.
Implementing Iron Condors under such conditions requires a keen understanding of market indicators and trends. Traders must analyze historical volatility, forthcoming economic events, and overall market sentiment to gauge whether the market conditions are conducive to this strategy. This analysis is crucial in setting the strike prices for the options contracts, determining the width of the Condor's wings, and ultimately, the trade's risk-reward profile.
Introduction to Silver Futures:
Silver Futures represent a standard contract for the future delivery of silver, a precious metal with both investment appeal and industrial applications. Trading on the COMEX exchange, these futures provide a crucial tool for hedging against silver price volatility and speculating on future price movements.
Key Features of Silver Futures:
Contract Specifications: A standard Silver Futures contract on the COMEX division of the New York Mercantile Exchange (NYMEX) typically involves 5,000 troy ounces of silver. The price quotation is in U.S. dollars and cents per ounce.
Point Values: Each tick (0.005) movement in the silver price represents a $25 change in the value of the Silver Futures contract. This point value is critical for calculating potential profits and losses in silver trading.
Trading Hours: Silver Futures are traded almost around the clock (23 hours per day) in electronic trading sessions, providing opportunities to react to global economic events as they unfold.
Margin Requirements: Trading Silver Futures requires a margin deposit, a form of collateral to cover the credit risk. The initial margin is set by the exchange and varies with market volatility. The current recommendation set by COMEX is $8,000 per contract.
Options on Silver Futures:
Options on Silver Futures offer traders the right, but not the obligation, to buy (call options) or sell (put options) the futures contract at a specified price before the option expires. These instruments allow for strategies like Iron Condors, providing additional flexibility in managing silver price exposure.
Applying Iron Condors to Silver Futures Options:
Implementing Iron Condors within the realm of Silver Futures Options requires a strategic selection of strike prices that reflect a balanced market's expected trading range. By capitalizing on Silver's historical volatility patterns and current market analysis, traders can construct Iron Condors to optimize their chances of success.
Trade Setup:
Underlying Asset: Silver Futures (Symbol: SI1!)
Market Conditions: Anticipation of a stable to mildly volatile market environment.
Strategy Components:
Sell Put Option: Strike Price $22.50
Buy Put Option: Strike Price $21.95
Sell Call Option: Strike Price $23.85
Buy Call Option: Strike Price $24.30
Net Premium Received: 0.2680 points = $1,340
Maximum Profit: Net Premium Received $1,340 per contract
Maximum Loss: Difference between strike prices minus net premium received = 0.55 / 0.005 x 25 – 1,340 = $1,410 per contract
Trade Rationalization:
This trade setup is designed to profit from a range-bound market, where the price of silver is expected to remain between key support and resistance price levels until the options' expiration. The selected strike prices reflect a balanced view of the silver market, aiming to maximize premium income while limiting risk exposure. The trade's success hinges on silver prices staying within the defined range, allowing all options to expire worthless and the trader to retain the collected premiums.
Trade Management:
Managing risks associated with Iron Condors involves closely monitoring silver prices and being prepared to adjust the strategy in response to significant market movements. This may include rolling out positions to different strike prices or expiration dates, or closing out the position to mitigate losses. Understanding the nuances of Silver Futures and their options is crucial for effective risk management in this strategy.
Risk Management:
Effective risk management is paramount when employing Iron Condors, particularly in the volatile commodities market. The Iron Condor strategy, by design, limits the maximum potential loss to the difference between the strike prices of the inner options minus the net premium received. However, market conditions can change swiftly, leading to potential challenges that necessitate proactive risk management techniques.
Monitoring Market Conditions: Continuous observation of market dynamics is essential. Significant economic announcements, geopolitical events, or changes in supply and demand can impact silver prices drastically. Traders should stay informed and ready to act if the market moves against their position.
Adjusting Positions: In the event of unfavorable market movements, traders may need to adjust their positions. This could involve closing out the position early to cut losses or 'rolling' the strategy to different strike prices or expiration dates to better align with the new market outlook.
Use of Stop-Loss Orders: While not always applicable in options trading, setting conditional orders to exit positions can help limit losses. For Iron Condors, this might mean closing the trade if the potential maximum loss is approached.
Diversification: Employing Iron Condors as part of a broader, diversified trading strategy can help mitigate risks. No single trade should expose the trader to disproportionate risk.
Conclusion:
The Iron Condor strategy offers a prudent approach for traders looking to capitalize on balanced markets, such as those often encountered with Silver Futures and Options. By selling options with strike prices outside the expected range of movement and protecting the position with further out-of-the-money options bought, traders can receive premium income while having a clear understanding of their maximum risk exposure.
This strategy thrives in environments of low to moderate volatility, where the underlying asset—silver, in this case—is expected to fluctuate within a predictable range. The inclusion of Silver Futures and Options in this strategic framework not only illustrates the versatility of Iron Condors but also underscores the importance of comprehensive market analysis and robust risk management practices.
By meticulously crafting their positions, monitoring market conditions, and being prepared to make adjustments as necessary, traders can effectively navigate the complexities of the commodities market, harnessing the potential of Iron Condors to enhance their trading portfolio.
When charting futures, the data provided could be delayed. Traders working with the ticker symbols discussed in this idea may prefer to use CME Group real-time data plan on TradingView: www.tradingview.com This consideration is particularly important for shorter-term traders, whereas it may be less critical for those focused on longer-term trading strategies.
General Disclaimer:
The trade ideas presented herein are solely for illustrative purposes forming a part of a case study intended to demonstrate key principles in risk management within the context of the specific market scenarios discussed. These ideas are not to be interpreted as investment recommendations or financial advice. They do not endorse or promote any specific trading strategies, financial products, or services. The information provided is based on data believed to be reliable; however, its accuracy or completeness cannot be guaranteed. Trading in financial markets involves risks, including the potential loss of principal. Each individual should conduct their own research and consult with professional financial advisors before making any investment decisions. The author or publisher of this content bears no responsibility for any actions taken based on the information provided or for any resultant financial or other losses.

Bitcoin's typical weekend activity and "howto" w/Voodoo LevelsVoodoo levels tip: When low volatility is expected (like over the weekend), price on an intraday basis will most likely range between DH1 and DL1 levels.
Exceptions can always happen. But expecting low volatility and mean reversion at the CME open on Sunday is something I continue to bet on.
Enjoy your weekend!

How to identify a trend move using AnchorsIn the video I discuss the concept of Anchors in trading and how I use them in my own trading.
Anchors play a major part in identifying the prime areas to trade and also in risk management when in a trade. I will discuss my prime setups and trading areas using anchors and multi-timeframe analysis.
** If you like the content then take a look at the profile to get more daily ideas and learning material **
** Comments and likes are greatly appreciated **

What is Scalping (How to Scalp the right way)To me scalping is a form of trading that's done when you're in between your moving averages or in between support and resistance levels like inside of those zones or when you are inside of consolidation and distribution areas. A lot of you claim to be scalpers on small time frames when the truth of the matter is you are simply impatient and you use 1 minute, 5 minute, 15 minute or less time frames on your charts.
With that being said one thing that you need to have a good grasp on is how to range trade and in this video I'm going to show you what you should be looking for when you arrange trading.
-------------
Scalping is a trading style that specializes in profiting off of small price changes and making a fast profit off reselling. In day trading, scalping is a term for a strategy to prioritize making high volumes off small profits.
Scalping requires a trader to have a strict exit strategy because one large loss could eliminate the many small gains the trader worked to obtain. Thus, having the right tools—such as a live feed, a direct-access broker, and the stamina to place many trades—is required for this strategy to be successful.
Scalping is a trading style that specializes in profiting off of small price changes and making a fast profit off reselling.
Scalping requires a trader to have a strict exit strategy because one large loss could eliminate the many small gains the trader worked to obtain.
Having the right tools—such as a live feed, a direct-access broker, and the stamina to place many trades—is required for this strategy to be successful.
A successful stock scalper will have a much higher ratio of winning trades versus losing ones, while keeping profits roughly equal or slightly bigger than losses.
A pure scalper will make a number of trades each day—perhaps in the hundreds.

Navigating the Golden Realm❣️"Unveiling Secrets of the Gold Market for Traders"
Welcome to the captivating world of the gold market, where you as (new) trader embark on a metaphorical journey filled with price movements , trends , and profitable opportunities .
In this comprehensive guide , i will delve into the intricacies of trading gold, empowered with knowledge that will enhance trading strategies. From deciphering patterns to understanding correlations , i will unlock the secrets of the golden realm, equiped with the confidence to make informed decisions.
So fasten your seatbelts and get ready to navigate through the twists and turns of this enchanting market.
Range Trading - The Breakfast Feast
Picture yourself at a lavish breakfast buffet, where a wide array of options tempts your taste buds.
Similarly, range trading in the gold market offers a delectable spread of trading opportunities. By identifying key support and resistance levels , you can effectively navigate within a defined price range. Just as you would choose from a buffet, traders can enter buy positions near support and sell positions near resistance.
Deciphering Trends - The Path to Success
In the golden realm, trends serve as beacons of guidance for traders. Analyzing price movements over time helps uncover valuable insights into the direction of the market. By identifying uptrends, downtrends, or sideways trends , strategies can be aligned accordingly. Utilizing tools like moving averages and trend lines, may create a clearer picture of the market's path, allowing you to ride the waves of success.
Breakouts - Seizing the Golden Moments
Just as a phoenix rises from the ashes, breakouts in the gold market signify the birth of new opportunities. Breakouts occur when the price breaches a significant resistance or support level, often indicating a shift in market sentiment. Trades will be positioned to take advantage of these golden moments by entering in the direction of the breakout. However, it is crucial to denote confluences and employ proper risk management techniques or wait for confirmation before diving into the fray.
Correlations - Unveiling Hidden Connections
The gold market is not an isolated realm; it is intricately connected to other financial markets. Understanding correlations between gold and other assets can provide valuable insights. For instance, a negative correlation with the U.S. dollar may indicate that a weaker dollar could lead to increased gold prices. By monitoring these relationships and recognizing their impact, you can make more informed decisions and maximize profit potential.
Retesting - A Second Chance
In the golden realm, opportunities often come knocking twice. Retesting occurs when a price level that was previously broken acts as a new support or resistance. Traders can capitalize on retests by entering positions in the direction of the original breakout. This phenomenon can provide a second chance to those who missed the initial move or wish to reinforce their existing positions. By identifying and evaluating retesting scenarios, you will enhance your trading strategy and seize these hidden but well-known opportunities.
☆
As we conclude this journey through the golden realm, you could now posses a deeper understanding of the gold market's intricacies. By embracing range trading , deciphering trends , seizing breakout moments , unraveling correlations , and recognizing retesting opportunities , you can navigate this enchanting market with confidence. Armed with technical indicators, pattern analysis, and an awareness of session transitions, you will unlock the potential for profitable opportunities.
So, fellow aspiring traders, step into the foreign exchange golden realm armed with knowledge and embark on your path to success, b e ready to make informed decisions and claim your share of the golden treasures.
HappyTrading 🤠 J

How to identify a TREND or RANGE market early in DaytradingTrading and Price Action can be broken down into tow simple terms...a 'range bound' market and a 'trend' market. Being able to identify the price action early is key to successful daytrading.
In the video I discuss how I like to daytrade Indexes and especially how I look to identify a RANGE or a TREND market. As there really is only TWO WAYs to trade....ie/ reversion to the mean or continuation trading...it is important to identify the market conditions early to get on the right side of the market and take full advantage of a move up or down.
I discuss my basic approach to trading and what I look for to identify the market conditions.
I talk about my trading style and general entry criteria.
Any comments or questions welcome below.

Cant wait for price to stop ranging? Do thisFirst of all you are going to need this indicator
Its the Heiken Ashi Algo Oscillator. Click the image below
There are times when price is ranging. When this happens you simply need to see what is the channel where the RSI values are hitting and you want to know WHEN is the RSI breaking out of that channel
In this oscillator the HIGH and LOW part of the RSI Range is the +10 and -10
If price is ranging in between as it is consolidating you dont want to sit there for several hours.
So in this video you can see how to set an alert telling you when the RSI breaks out of the RANGE.
This way, once the alert is set, you can go live life.........
See you next time at the CoffeeShop

Simple trading setup from swing range- Determine directional bias from HTF
- Find high/low trading range from previous day
- Drawn in fib level to see premium/discount zone for entry
- Spot CHoCH in different direction of HTF (Potential to grab liquidity)
- Wait and see Price action with HTF bias (In this case is bearish)
- Price entered premium zone for open short position
- Wait for lower time frame BOS before entry
- Target imbalance zone/ Previous key level low/ Fair value gap (RR 2.65, not bad, since we get entry outside premium zone but more confirmation)

An Idiot's Guide to EURUSD: 5 Steps to Success 💲💲💲Synopsis
If you trade Forex then you know the weekends are the best time to analyse the market. Everybody likes to talk about how volatile EURUSD is, but what they don't tell you is that the market is ranging a good 80%-90% of the time; good deals do NOT last long. In fact, half of a days price movement can play out in 15-45 minutes, It's that fast. The best entries are usually snatched up in a matter of minutes, meaning that slow momentum oscillators and lagging trend following indicators don't perform well in these conditions. EURUSD in my opinion trades a lot like CL (crude WTI), where trading decisions need to be made while volatility is low to mitigate risk. Translation: if you can't win in a range, you're going to blow your account in this market, trust me.
I see so many people on here setting targets 2-3 times the daily atr with the expectation that they'll be paid by the end of the day or the next day. Don't do that, please. It's not a sprint, it's a marathon. Long term gains depend on practical consistent returns, not 10:1 RRs. It's actually a lot more realistic to take ZERO to two 20-40 pip trades per day. Over the course of a week it adds up.
The chart:
This week we came off of a really strong bullish surge away from parity, and the market then did what it does best, range. And the way that prices are moving right now is just classic EURUSD, I love it...I get so nostalgic, because ranges like these are how I learned to trade; the way that the market recycles over and over makes it so fun to trade, it never gets stale. Since it's the weekend and the markets are closed, I wanted to take this opportunity to share with anyone who might be wondering what it's like to day trade this market.
How to trade ranges:
Step 1: Find your levels...
The easiest way is to map out support and resistance zones. On the chart, I use my own variation of the Williams fractals indicator (I call them Neo fractals 😎) for every prominent swing high or swing low, the indicator draws a horizontal ray from the highest, lowest close and projects it out into the future. You can see the spots where lines start stacking up in a certain price range act as stronger support or resistance than the areas with only one dotted line. It only takes about 5-10 minutes per day to do this by hand though, so an indicator definitely isn't necessary. It's really important to be able to eyeball pivot points yourself anyways.
Step 2: Determine market phase...
After you've mapped everything out, it becomes a lot clearer what's happening in the market, and if the market is ranging or trending. If the market's ranging, you will see far more s/r lines on your chart especially once you start seeing s/r lines stacking up close to one another. A clear giveaway that the market is ranging is when price makes strong moves in one direction, only to return back from where it came, later in the day. Once you've determined what phase of the market you're even closer to spotting high quality trades.
Step 3: The next step is to find areas of value...
In general you want to find the areas within the range which provide the most exclusive prices, And steer away from price ranges that hold 80-90% of the activity on the cart. Being 5-10 pips in profit before a big move will completely change the way you feel about a trade when it starts to go against you (plenty winning trades will go against you, especially if you're trading reversals). On the chart you can see that the supply and demand zones only produced 2-4 trades this week, but all of them were for over 50 pips. These aren't the only trades you can take, but they're definitely the highest RR trades, you can get in a ranging market.
Step 4: What for confirmation...
There are so many ways to confirm a move, but my favorite for this market is a phenomena that I like to call a spike. (There's probably an actual name for it, but I'm self taught so I just make stuff up as I go 😅) Find a hammer or star candle on a higher chart like the daily or 4hr and it look at that time period again on a lower timeframe, what you'll see is that the hammer or star is actually just a large price movement in one direction followed by an equally large movement in the other direction. What might appear as a spike on a lower timeframe will appear as a hammer or star on a higher time frame, and the larger and longer the chart pattern takes to complete, the larger and longer the move will be in the opposite direction. These are the Rolls Royce of signals. When you realize that a head and shoulders pattern is really just a series of spikes, it will completely change the way that you trade. In my experience, trading price spikes alone out performs every other chart pattern there is, because most candlestick and chart patterns are made up of a series of spikes anyways. Most consolidation periods end in a large spike followed by a 1-200 pip surge in the opposite direction. They appear most often on higher timeframes as hammers and stars, or large engulfment. but on the lower time frames you can watch these things play out over 5 ,10 or even 100 periods sometimes. The key is to have very strict rules for what you consider a spike to be, how many pips? What kind of ratio are you looking for? is it happening in an area of value? etc.
Step 5: The range leads to the trend...
The reason that trend following strategies under perform in this market is because strong trends don't last long on EU AND getting good value is insanely competitive. The key is to spot these trends early, you have to be looking when nobody else is looking. That means waking up earlier than everyone else and having a plan in place before the move happens...Not seeing a big candle and just hopping in. I try to have a daily strategy in place before the Asian session ends, that way, I''m ready for London and NY. I live in the US, so that means I'm waking up everyday around midnight to 1 in the morning. But most of the time, if my trade starts well, I go back to bed and check back in around 7. If you want to trade EURUSD, that's what it takes though. There might have to be lifestyle changes that you have to make (especially for North and South American traders) in order to really commit yourself to this market and give your trading it the attention that it needs.

How to find THE BEST SHORT entry in a Range bounding market !!!!Welcome to this tutorial
This is my personal take from multiple resources and +20 hours of research and my own experience with trading in a range-bound market.
Range-bound trading or in this case shorting in a range-bound market contains 5 simple phases:
phase A
Range High + Range low forms which lead us to have a Range market.
phase B
Price tends to deviate above the Range High or simply sweep (upthrust) above it.
Reasoning and psychology behind that= in order to catch the liquidity above the range high and trap breakout traders who just opened a long above the high before nuking to the Range Low.
phase C
BOS happens in ltf , triggering a trend reversal.
Supply forms below the resistance, that's where we would like to build our short position later on.
phase D
ltf Range forms after the first sell-off, creating our base to revisit the supply that previously formed above it.
(Ideally, you can enter a scalp long trade in this phase and close right at the supply)
phase E
Price finally revisit the supply in order to test it as resistance. Any bearish price action at the supply or ltf BOS triggers our entry, targetting the Range Low as our take profit point.
There you can have a nice +4 R/R short setup, remember to place your invalidation above the newly made local high just to be safe from stop hunters ;)
Make sure to leave a like and a comment if you find this small article useful
I will share 2 more topics about range bound market and how to trade it in near future so follow me on Tradingview so you don't miss them xoxo

What is a RANGE?Hello Traders,
Here is the most simple & easy explanation about a Range.
In this Lesson I will Show you how to Identify & Trade a RANGE!
These patterns are seen daily in Stocks, Forex and different markets across the Globe.
I hope you will find this information educational & informative.
Your support is appreciated with a follow, like & Comment
Lets dive Right Into it!!
What Is a Range?
Range refers to the difference between the low and high pricesover a specific time period. Range defines the difference between the highest and lowest prices traded for a defined period, such as 4H, day, Week & month. The range is marked on charts, for a single trading period, as the high and low points on a candlestick or bar.
The top of the trading range often provides price resistance, while the bottom of the trading range typically offers price support.
Understanding Trading Ranges
When the Market breaks through or falls below its trading range, it usually means there is momentum (positive or negative) building. A breakout occurs when the price of the Market breaks above a trading range, while a breakdown happens when the price falls below a trading range. Typically, breakouts and breakdowns are more reliable when they are accompanied by a large volume, which suggests widespread participation by traders and investors.
Many traders look at the duration of a trading range. Large trending moves often follow extended range-bound periods. Day traders frequently use the trading range of the first half-hour of the trading session as a reference point for their intraday strategies. For example, a trader might buy a stock if it breaks above its opening trading range.
Ranges and Volatility
Since price volatility is seen as equivalent to risk, a Markets trading range is a good indicator of relative riskiness.
A conservative Trader prefers a Market with smaller price fluctuations compared to Market that are susceptible to significant gyrations. Such an trader may prefer to Trade in more stable Market rather than in more unstable Market.
Trading Range Strategies
Range-bound trading is a trading strategy that seeks to identify and capitalize on a Market trading within price channels. After finding major support and resistance levels and connecting them with horizontal trendlines, a trader can buy a at the lower trendline support (bottom of the channel) and sell it at the upper trendline resistance (top of the channel).
Support and Resistance
If the Market is in a well-established trading range, traders can buy when the price approaches its support and sell when it reaches the level of resistance. Technical indicators, such as the relative strength index (RSI), stochastic oscillator, and the commodity channel index (CCI), can be used to confirm overbought and oversold conditions when price oscillates within a trading range.
For example, a trader could enter a long position when the price is trading at support, and the RSI gives an oversold reading below 30. Alternatively, the trader may decide to open a short position when the RSI moves into overbought territory above 70. A stop-loss order should be placed just outside of the trading range to minimize risk.
Breakouts and Breakdowns
Traders can enter in the direction of a breakout or breakdown from a trading range. To confirm the move is valid, traders should use price action & Structure Break.
For instance, there should be a significant increase in volume on the initial breakout or breakdown as well as several closes outside the trading range ( Structure Break). Instead of chasing the price, traders may want to wait for a retracement / Correction before entering a trade. For example, a buy limit order could be placed just above the top of the trading range, which now acts as a support level.
Thanks for Reading this article, I hope that it was informative and educational As always, If you have any questions / Comment or Concern Please feel free to leave them below.
Thanks to @TradingView for this lovely platform to educate and grow together :)
Hope to see you in the next Educational Post!
Global Fx Education
Tutorial | How To Use ATR & Volume Profile To Project Highs/LowsThere are many ways to project price levels when looking at un charted territory (e.g. new highs). Elliot Wave, Gann, fractals, Fibonacci, or a measured move, all are methodologies that can provide levels to watch to predict range expansion when there is no price to reference.
In this lesson, I show how to use another approach, utilizing the 7-Day Average True Range (ATR) and the prior session Point of Control (POC).
Settings
ATR
Period: 7 Day
EMA
P.S. I didn't mention in the video, but check out how well an ATR Projection worked leading into Jackson Hole Friday. 4470 prior day POC to a high the next day at 4510. I went to California schools, so math ain't my strong suit, but I think that's 40 points or 1 ATR.

Tutorial | How To Identify Potentially Strong Trend DaysI got smoked shorting the MNQ today. And it was avoidable.
The MNQ1! and the MES1! were flashing warning signs since the Sunday open to NOT fade the move. I stayed off the sell side for the opening 30 minute candle, but then got sucked in at a level. The entry was a violation of one of the Golden Rules of Range Trading - STAY AWAY from Outside Days!
In this video, I discuss how to identify Outside Days and look for Untested Prior Session POCs as signs that conditions are pointing to trending price action.

Tutorial | Lesson 2: Signals For Trading Session Volume & VWAPWelcome to Part 2 in the Video Idea Series on using the Volume Scripts in TradingView. On this Fed Day, fun day edition, I cover a few entry signals and/or levels for using Session Volume and a VWAP indicator available in the Public Library.
It's 10 minutes and stick around to the end as I mentioned a way to learn more about futures trading, and these strategies, in a risk-free trading account.

Profit while BTC is -40%? This is the strategy: +44% on spotPlenty of traders are struggling to trade the choppy ranging market of the past couple of months. Especially as it comes after an "up only!!!" period where making a mistake was an exception and (at least some) success the rule. Wicks and stops hunting are not making it easier. We always speak about preparing the strategy for the next leg, but traders still don't use data and help. This is an example of how you do it and create a strategy where when Bitcoin is -40% down, you're comfortably +44% in profit.
WILL POST EVERY POSITION OPEN/CLOSE TIME AND RETURN OVER 6 MONTHS BELOW
The strategy goals:
Any strategy you're running needs to be profitable in different market conditions. It's fine if it particularly successful under particular ones, but it should not be a dud in the long run. So we're going to pose quite a challenge for ourselves:
1. Winning strategy on spot in the past 3 months (March to June) while Bitcoin is down 40%
2. Beat buy and hold over 6 months - we need to have a sufficient sample of trades. The majority of gains on Bitcoin happened before the start of the year so we are looking at Dec-Jun
3. Make more than 100% during a year. Obviously this will be a range based strategy so trading it in a parabolic bull market is not the wisest. However we need to see longer term success to validate the idea.
The strategy:
We'll be using one on of the simplest indicators in range trading - Bollinger Bands. We do need to make the classic set up more responsive by reducing the periods and standard deviation. On account of this we will include ATR (Average True Range) which is a great measure of volatility. If it's not present we don't want to be exposed. You want the opposite in parabolic markets.
On the 1 hour chart we:
- Will open a position when price is crossing up BB_LOWER (period: 15, standard deviation: 1) AND ATR (14) is up by 9% in last day
- Will close a position when price is crossing down BB_UPPER (period: 15, standard deviation: 1) AND ATR(14) is down by 1% in last hour
No stop loss or take profit - the strategy rules are respected 100% of the time. The reduced period and standard deviation on the Bollinger Bands match what you see on the chart here.
The results:
The marriage between Bollinger Bands and ATR is working quite well in ranging markets. Bollinger Bands signal low/high prices while ATR gives you a hint of volatility. It wins about 56% of positions, but the profits are on average 2:1 to the loss which is ideal.
In fact this strategy:
1. Convincingly beat the -40% market in the past 3 months, with profits of +44%
2. Made 86% in the past 6 months, while just holding Bitcoin would have brought you 39.9%
3. Profited +136.5% over the year. Again we do recommend adjusting your strategy to the conditions, but this gives us a large enough sample of trades to validate the idea.
Even max drawdown over the last 3 months was only 9%. That and profits is a wonderful position to be in in a market that's ruled by fear.
The positions (last 6 months):
22/06/2021 16:00
22/06/2021 23:00
7 hours
OP 31,708
+2.76%
Still in position
21/06/2021 14:00
22/06/2021 05:00
15 hours
OP 33,152
CP 32,911
-0.728%
19/06/2021 00:00
19/06/2021 17:00
17 hours
OP 35,820
CP 35,889
+0.192%
08/06/2021 08:00
09/06/2021 01:00
17 hours
OP 32,967
CP 32,886
-0.244%
06/06/2021 00:00
06/06/2021 03:00
3 hours
OP 35,516
CP 36,130
+1.73%
04/06/2021 13:00
05/06/2021 04:00
15 hours
OP 36,880
CP 37,410
+1.44%
01/06/2021 14:00
02/06/2021 20:00
1 day
OP 37,037
CP 37,885
+2.29%
28/05/2021 13:00
30/05/2021 21:00
2 days
OP 36,590
CP 36,050
-1.48%
23/05/2021 20:00
24/05/2021 17:00
21 hours
OP 33,047
CP 37,357
+13%
19/05/2021 15:00
21/05/2021 02:00
1 day
OP 37,502
CP 41,428
+10.5%
16/05/2021 02:00
18/05/2021 04:00
2 days
OP 48,060
CP 44,775
-6.84%
13/05/2021 06:00
14/05/2021 13:00
1 day
OP 50,884
CP 50,311
-1.13%
10/05/2021 23:00
11/05/2021 11:00
12 hours
OP 56,230
CP 55,842
-0.69%
09/05/2021 06:00
10/05/2021 07:00
1 day
OP 58,447
CP 58,834
+0.663%
03/05/2021 18:00
05/05/2021 20:00
2 days
OP 57,959
CP 57,136
-1.42%
29/04/2021 07:00
30/04/2021 11:00
1 day
OP 54,373
CP 54,165
-0.383%
26/04/2021 00:00
26/04/2021 09:00
9 hours
OP 49,067
CP 52,584
+7.17%
23/04/2021 11:00
23/04/2021 22:00
11 hours
OP 49,457
CP 50,298
+1.7%
18/04/2021 13:00
19/04/2021 06:00
17 hours
OP 54,947
CP 56,500
+2.83%
14/04/2021 17:00
16/04/2021 00:00
1 day
OP 63,485
CP 63,159
-0.514%
11/04/2021 00:00
14/04/2021 13:00
4 days
OP 59,769
CP 63,871
+6.86%
07/04/2021 06:00
08/04/2021 10:00
1 day
OP 58,286
CP 56,676
-2.76%
04/04/2021 03:00
05/04/2021 21:00
2 days
OP 57,363
CP 58,773
+2.46%
31/03/2021 13:00
01/04/2021 02:00
13 hours
OP 58,160
CP 59,140
+1.68%
30/03/2021 05:00
30/03/2021 15:00
10 hours
OP 57,567
CP 58,866
+2.26%
25/03/2021 05:00
26/03/2021 03:00
22 hours
OP 52,252
CP 51,697
-1.06%
21/03/2021 14:00
23/03/2021 19:00
2 days
OP 57,022
CP 55,365
-2.91%
15/03/2021 14:00
16/03/2021 17:00
1 day
OP 56,856
CP 55,658
-2.11%
11/03/2021 11:00
12/03/2021 20:00
1 day
OP 55,531
CP 56,942
+2.54%
08/03/2021 11:00
09/03/2021 08:00
21 hours
OP 50,061
CP 53,547
+6.96%
04/03/2021 01:00
06/03/2021 00:00
2 days
OP 50,894
CP 48,747
-4.22%
28/02/2021 20:00
01/03/2021 06:00
10 hours
OP 44,403
CP 46,200
+4.05%
27/02/2021 00:00
27/02/2021 03:00
3 hours
OP 46,277
CP 47,375
+2.37%
26/02/2021 04:00
26/02/2021 19:00
15 hours
OP 47,331
CP 47,317
-0.0301%
21/02/2021 00:00
24/02/2021 07:00
3 days
OP 55,841
CP 50,109
-10.3%
20/02/2021 11:00
20/02/2021 20:00
9 hours
OP 55,895
CP 56,975
+1.93%
16/02/2021 19:00
18/02/2021 02:00
1 day
OP 48,617
CP 52,132
+7.23%
15/02/2021 01:00
16/02/2021 07:00
1 day
OP 48,764
CP 49,021
+0.527%
04/02/2021 13:00
13/02/2021 07:00
9 days
OP 37,619
CP 47,728
+26.9%
01/02/2021 17:00
03/02/2021 00:00
1 day
OP 33,461
CP 35,473
+6.01%
27/01/2021 20:00
30/01/2021 16:00
3 days
OP 30,732
CP 34,210
+11.3%
26/01/2021 02:00
26/01/2021 21:00
19 hours
OP 32,754
CP 31,987
-2.34%
20/01/2021 14:00
22/01/2021 13:00
2 days
OP 34,959
CP 31,550
-9.75%
15/01/2021 22:00
17/01/2021 19:00
2 days
OP 36,234
CP 35,677
-1.54%
10/01/2021 23:00
12/01/2021 09:00
1 day
OP 38,430
CP 35,773
-6.91%
08/01/2021 22:00
09/01/2021 16:00
18 hours
OP 40,076
CP 40,525
+1.12%
08/01/2021 04:00
08/01/2021 18:00
14 hours
OP 38,347
CP 41,009
+6.94%
03/01/2021 21:00
05/01/2021 16:00
2 days
OP 33,726
CP 32,100
-4.82%
27/12/2020 19:00
28/12/2020 16:00
21 hours
OP 27,063
CP 26,916
-0.541%
24/12/2020 06:00
24/12/2020 10:00
4 hours
OP 23,050
CP 23,348
+1.29%

Trading EURUSD after European Gold Pit OpenSimple and affective forex trading strategy explained for the EURUSD, when breaking opening range of the European Gold Pit Open. Combining an EMA cloud to help with Entry

Pro Trader 80-20 StrategyThe 80 – 20 Trading Strategy
The basic idea behind this pro trading strategy is around a simple chart price formation. Particularly, a candlestick bar with a long body and small wicks. Usually, these types of candlestick patterns signal a market reversal. However, there are some price characteristics that need to confirm the reversal signal.
Here are the pro rules:
The body of the candle must take at least 80% of the total candlestick size.
The wicks of the candle must constitute less than 20% (ideally 10% on each side).
Today candle must open 5-15 ticks below (above) the momentum candle (this is meant as a guideline).
Once the market breaks above the momentum candle low you buy.
Stop-loss can be placed below today’s candle low.
Take quick profits as this is a scalping strategy (don’t expect large profits from this chart pattern).
Note* This strategy works best in the futures market, but if you’re a smart trader you can work out some variation of it to make it work on your favorite market be it stocks, forex, or cryptocurrencies.

GOLD buy trade setup using price action, how far can it go???It has been said ever since people were allowed to trade to "trade with the trend" and "the trend is your friend". Although there is logic to this the market unfortunately doesn't always trend and in fact spends most of its time in ranges and channels.
The market environment changes all the time and it's why so many traders struggle with their trading because they do not understand what market environment they're currently in. Price action traders can have an advantage in this regard because they want to see the structure that the price action has laid out as the leading indicator of where price could potentially go next.
As you can see from the 15 Minute chart on Gold, it has been in roughly a $22.00 range for around the last 2 weeks. Although it has been in a longer term uptrend in general, using ranges can help you a lot to work out a higher potential level to enter, while also managing your downside risk.
What we can see is a bullish head & shoulders pattern complete right at the lows of the range which can be seen on the higher time frames, why we like the position of this specific price pattern is because, not only is it pointing to the right side of the larger trend direction which can enable you to jump in on the move. You also get a location that if you are wrong then your stop loss can be placed just below the pattern which also would also lie under the range floor so you can manage smaller risk on this trade.
If you missed this setup then by being patient, price ends up showing you another opportunity with the same bullish head & shoulder pattern that completes just after the initial drive higher from the lows.
When trading any price pattern you should always wait for it to complete first without jumping in too early, but it's the higher inner trend line that we like to use (in the case of a bullish pattern) as our entry point as this can help show more strength in the pattern while also precisely showing you where to enter on the top side retest marked with green arrows.
Even if price doesn't continue in the longer term trend, you can initially target the top of the range and potentially scale out a percentage of your trade to lock in some profits.
We will be keeping a close eye on Gold and watch for any pullbacks that can allow for another bullish price pattern to form potentially indicating another opportunity for a manageable trade.

EURCAD 1D RANGE TRADESRanges are repeatable trading chart patterns.
Ranges are consolidation chart patterns that can breakout either direction.
Each chart pattern will have defining trendlines of the support/resistance levels creating the pattern.
What ever time frame you are trading this chart pattern, wait for a candle close outside of the trendline in the direction of the breakout candle. (Our time frame preference is the Daily chart).
Add volume indicator - Volume is the amount of $ that went into a particular candle or in Forex the # of trades that took place.
Add ATR indicator - Volatility is the amount of price movement that occurred. Use the ATR to measure the price movement.
When you see descending Volume bars and descending ATR line (which indicates volatility) this shows
a dis-interest in traders to invest in this pair creating consolidation which creates the chart pattern.
Trade Management after there is a breakout candle close.
1 - Position size (compare volume bar to volume ma line).
a - Breakout candle must be 100% of average volume for a full position size.
b - If 75% of average volume then ½ position size. (To find 75% of Volume
look at the charts volume settings – divide smaller # into larger # = 75%+)
2 - Enter two trades.
3 - SL for both trades will be 1.5 x ATR.
4 - 1st trade TP will be 1 x ATR.
5 - No TP on 2nd trade – letting profit run and adjusting SL to follow price.
6 - When 1st TP hit – move 2nd trade SL to breakeven.
7 - Adjust the 2nd trade SL to follow price.
*8 – After Breakout candle – if price closes back into chart pattern close trade
*9 - When breakout candle is more than 1 ATR from breakout candle open.
a - Enter 1st trade at candle close with ½ position size.
b - Enter 2nd trade with a pending limit order that is 1 ATR of breakout candle open.
c – Price should pullback to that pending limit order for 2nd trade.
d – If Price returns back into chart pattern close trade before SL is hit.

