How to Filter for Trading CandidatesIntroduction
This post explores how to filter tradable assets using structural and behavioral criteria. While the examples focus on swing trading stocks, the same principles apply across other markets.
A structured selection process helps refine the list of candidates and supports a more consistent approach. The use of filters can reduce the universe of stocks to those that fit the chosen method. For example, in momentum trading, the purpose is to find stocks that have already shown strong movement and may offer continuation opportunities.
There are multiple approaches to selection. This chapter focuses on two practical methods: scan-based filtering and a top-down approach.
Foundational Filters
These basic criteria can be applied across all scans and serve to exclude assets that are illiquid or incompatible with standard execution. The specific thresholds used may depend on personal account size, capital allocation and trading style. This guide focuses on swing trading, where moderate liquidity and price stability are important to ensure consistent fills and manageable risk.
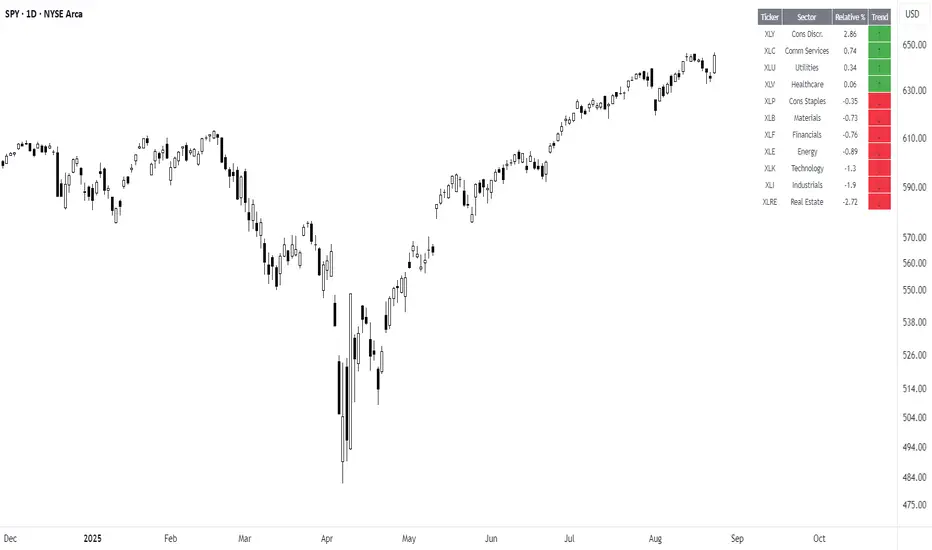
The Sector Relative Strength tool can help show leading sectors versus the S&P 500 Index over the longer term. This optional top-down approach highlights which areas of the market are outperforming and can support manual refinement.
Setup-Based Filters
These examples demonstrate criteria for identifying potential continuation setups following recent momentum. The filters shown are for bullish conditions; for bearish setups, the logic is reversed. For other approaches, such as fading, filters based on excursion/overextension would be applied instead.
Use the Momentum Tracker to visualize when stocks historically met each of these criteria. This helps evaluate the behavior that preceded meaningful setups and refine your filters over time.
Optional Refinement Filters
These filters can help focus the scans further and improve candidate quality.
Candidates can also be sorted based on preference. A common method is to sort by recent volatility, such as ATR%, or distance from the mean price to prioritize price retracement or contraction.
Momentum Scan Example
This sample scan uses normalized momentum to identify new highs in price. The method is standardized and adapts well across different markets. In case the number of candidates is extensive, filters can be more restrictive or additional criteria applied to narrow the selection.
Market Context
Market breadth is the equilibrium between the number of stocks in advance to those in a decline, in other words a method to determine the current market environment. In a positive phase, bullish setups will have improved probabilities and presence, whereas in a bearish phase the opposite would be true. There tends to be a correlation in the market, where stocks often move in line with their sector or the broader index. Being aware of where capital is flowing helps align trades with the broader environment. In case one has an effective scan and review process, much of this assessment is implicitly accounted for.
This guide will not cover these in depth, but there are numerous ways to evaluate market context; such as reviewing index or sector performance, market breadth, and monitoring economic or macro events. The most important part is to be consistent and apply discretion within the chosen process.
Setups
The Edge Of The Fork - The Joker In Your PocketWOW!
\ \ First of all, I want to say THANK YOU for all the boosts, follows, and comments. You guys & gals give me the energy to continue this journey with you.\ \
Today, I want to show you that what we’ve learned with horizontal lines can also be applied to "Medianlines," or Forks.
Listen, I don’t want you to blow your brain with all the rules.
Not at the beginning of this journey, and not later on either.
Don’t ask yourself:
* when to use which Fork
* which swing to measure
* when to trade
* where to set your stop
* what if... bla bla bla
That’s not fun — that’s stress.
I don’t like stress — nobody does.
So let’s just chill and have fun here.
That’s my personal reason for doing all this Trading thing. I want to have fun — the money will take care of itself, just like the destination of a trail takes care of itself, as long as I keep putting one foot in front of the other. And that’s simple, right?
So let’s do it exactly the same way.
Just simple steps, connecting some dots, and BAM! — You’re there before you even know it §8-)
\ Let’s jump to the chart:\
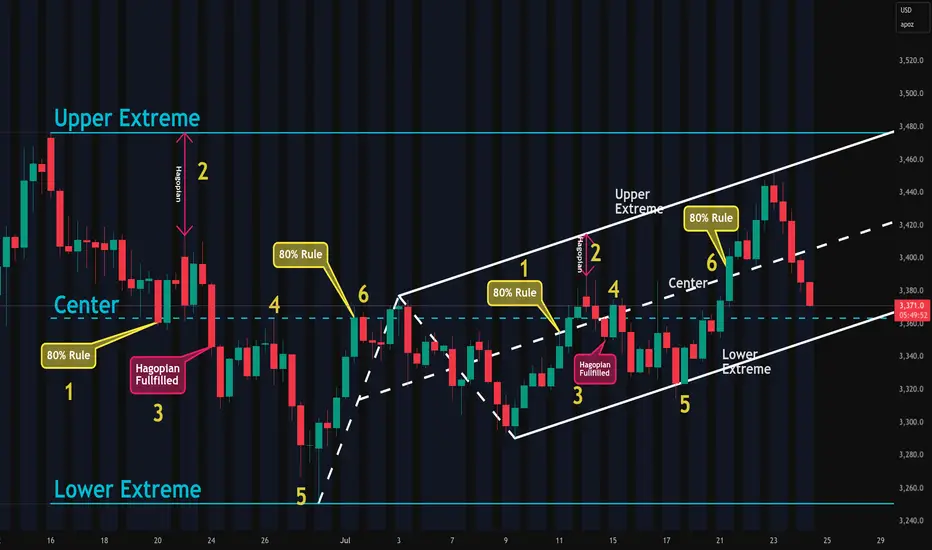
Today, you’ll find out why Medianlines/Forks are a cousin of the horizontal Channel — but NOT the same.
Where are they different?
Forks are different because they’re capable of projecting the most probable path of price. And that’s a HUGE difference.
Yes, you can apply the full rule set of Forks to a horizontal Channel.
But the Channel CANNOT project the most probable path of price.
I hear you, I hear you: "No one and nothing can foresee the future. How is it even possible that Forks can?"
\ Here’s why:\
There’s a thing called "Statistical Importance." And it means that if something happens very often in the same way, we have a higher chance of seeing the same behavior again in the future.
And that’s what the inventor, Allan Andrews, discovered — and he created the rules around his findings.
\ A high probability that price will move in the direction of the projected path, as long as it stays within the boundaries of the Medianlines/Fork.\
That’s the whole "magic" behind Medianlines/Forks.
And the same applies to the "Behavior of Price" within and around Medianlines. That’s really all there is to it.
Look at the chart and compare the Channel and the Fork:
1. Price reaches the Centerline about 80% of the time
2. HAGOPIAN → price goes farther in the opposite direction than where it came from
3. HAGOPIAN’s rule fulfilled
4. Price reaches the Centerline again
5. Price reaches the other extreme
6. Price reaches the Centerline about 80% of the time
You’ll see the same behavior inside the Fork!
That’s beautiful, isn’t it? §8-)
And here’s a little Joker in your pocket — if you know the difference between the Channel and the Forks!
Do you know what it is?
Yep! You’d automatically know the direction to trade — giving you another 10% edge right out of the box — LONG TRADES ONLY. Because the Fork projects the most probable path of price to the upside, not down.
That's all folks §8-)
Like this lesson?
With a simple boost and/or a little comment, you load my Battery so I can continue my next step on the trail with you.
Thank you for spending your time with me §8-)
Parabolic Reversals, A+ setup explained with todays NAS R5 shortRecap of todays NY Session with my shorts on NAS and Gold. I am explaining the parabolic reversal setup in detail since it happens quite often currently and is one of my favourite setups.

📕Low-Quality setups (UNCLEAR) VS High quality (CLEAR) setups📕High quality (Clear) vs Low Quality (Unclear, wicky, random, guessing)
Setups in Our Trading
High quality clear (HQC) setups are best representations of your EDGE, they allow you to feel confident in the MOMENT of placing a trade, and you can feel relatively good about it even if it’s a loser, because you know you traded in clear market environment and did your best
HQC setups bring you HEALTHY excitement and joy from the process of your trading, in case of a winner, usually not leading to overconfidence and doesn’t lead to attachment to random reward, and in case of a loser - you are not dragged into revenge or depression, because you know losers are also part of your strategy and your execution was good
When you enter HQC setups that speaks about you as about a trader you tested their strategy, who knows what they want to see in the market and applied effort to stay away from bad condition and wait for a better one. These skills alone are so much better than 1 random +3R or +5R winner
Low quality unclear (LQU) setups mean something is out of your mental game today, you feel not feel good in longterm perspective trading them, because you kind of KNOW you should trade them, but you still do. It all sucks you into an emotional circle.
LQU setups bring you UNHEALTHY , short term lived overexcitement in case of a winner, attaching you to random rewards, which is fatal for a trader. Every time entering a LQU setup you develop a habit or “teach” yourself that it is easy and fast way of earning money. Just see something distantly reminding about your setup and enter. Sometimes you’ll get away, but longterm you’ll lose more.
LQU setups means you are you fully confident in your core strategy, and so you may unconsciously search for random entries, because you entered like this before and it brought you reward. Trading LQU setups is destroying your mental game and account in the short, medium and longterm
Picture attribution Frame Border PNGs by Vecteezy

Power of setups As discussed in class yesterday.
Similar setup on ES
-Net Short
-Bearish overall bias
-50/vwap bounce (down) with MACD zero bounce( down)
-Old support /New resistance with 50 MA
Powerful setups...
Stay Frosty!

[Trade Review]How I traded $DIS 200% GAINS, $TLRY, $MSFT, FUMBLEIn this video I will reviewing trades I took on June 28, 2021 which were $TLRY, $DIS, $MSFT, $ZM from watchlist I provide from the stream on Saturday! Along with an explanation of my plan as well showed you guys my TA for some possible set ups! Traded these tickers using my knowledge of technical Analysis , sharing my levels: Support & Resistance , my trendlines , Fibs, Waves, Price Action, Channels , Emma's, and prior experienced , while providing both bullish & bearish scenarios for you to be able to understand my analysis and wait for confirmation as always!
Want to see more content like this? Make sure to Like and Subscribe!

[Trade Review]How I traded $PLTR, + TALKS ON EUPHORIA/ LOSSES In this video I will reviewing trades I took on 6/15/2021 which were $PLTR taking a small loss practicing my risk management not a problem since im confident i will make it all back. Traded these tickers using my knowledge of technical Analysis , sharing my levels: Support & Resistance , my trendlines , Fibs, Waves, Price Action, Channels , Emas, and prior experienced , while providing both bullish & bearish scenarios for you to be able to understand my analysis and wait for confirmation as always! Make sure to leave a comment for feedback about cutting back on the trading review videos let me know guys! Will be making videos on trading phycology due to the euphoria in the market so look out!

100 ways to read a chart Especially for beginners it can be very confusing to interpret a chart ... patterns, indicators, oscilators. SDMA, EMAs, Fibonacci.
If you are interested, I would be happy to go into more detail about individual tools and setups, but today I will just give an overview of which tools and types of trade are available.
Timeframe
Trend trading months to years
Swing trading days to weeks
Intraday 1 day
Scalping seconds-minutes
Different markets
Forex
Stocks
raw materials
Indices
Cryptocurrencies
The main technical indicators
Simple moving average (SMA)
Exponential Moving Average (EMA)
Stochastics
Relative Strength Index (RSI)
Commodity Channel Index (CCI)
Moving Average Convergence / Divergence (MACD)
Bollinger Bands (BB)
Chart types
Line chart
Bar chart
Candlestick Chart
Point & Figure Chart
Renko chart
Three line break chart.
Kagi Chart.
Heikin Ashi Chart.
Trade setups basic types
Continuation
Reversal
Sideways
Break out
My personal preferences
EW
Algo's
Pattern
Price action
EMA's MA's
RSI
MACD
KDJ
TAR
Stoch
BB
Pitchfork
Gan
The world of finance is diverse. It is very important to choose a style that suits your psyche, preferences and the amount of time you want to spend.
I would be grateful if you support my post whit likes and comments
Have a nice trading day

EURUSD-2hr's Educational - 7 Steps To have A professional Entry🗒 Just browsing through my analysis means a lot to me.
➡️ Please follow the analysis very carefully and every detail of the chart means a lot. And always entry depends on many reasons carefully studied
Always enter into deals when there are more than 5 reasons
combined
Step Number 1
Turn level Trend .
. Play Support And Resistance Rule In The Past
-----------
Step Number 2
Draw & Find Major Trend 3 Reversal's
------------
Step Number 3
Find Channel Formation Near The Price
------------
Step Number 4
Search For Highest Volume Bar From Price Area
and Draw Rectangle that area
------------
Step Number 5
We Can Use Volume Spark As Very Good Target's level
or take it as Station's for Price and Good Entry's
------------
Step Number 6
Draw Turn level Support and Resistance
------------
Step Number 7
Volume Profile Point Of Control
So Important .. High Success Chance to Take Action Here
--------------
For Example Shorting Position ---
Break Out Point - For Example
---- 1.17000
Trend Break
Turn level Break
Turn level Break
High Volume Break

High Probability Entry using Shoulders and Price ActionWhat we term as a 'shoulder' (Lower High/Higher Low) is a prime entry setup with statistically high probability. The important thing to note is that it is used in conjunction with price action to correctly identity when traders are being 'caught off-guard' on the wrong side of the action and forced to close. We like to term it the 'sweaty palm' feeling when you begin to realize that you are wrong and have to start to look for the exits and minimize losses. In the example on the German DAX index, there were some great opportunities to sell (off the shoulders when sellers stepped in at lower levels and buyers were forced to bail) with a defined risk profile that paid out handsomely...if you are able yo define the key zones and when traders will be put under pressure. Hope this helps and Happy Trading....TradeSetup.
