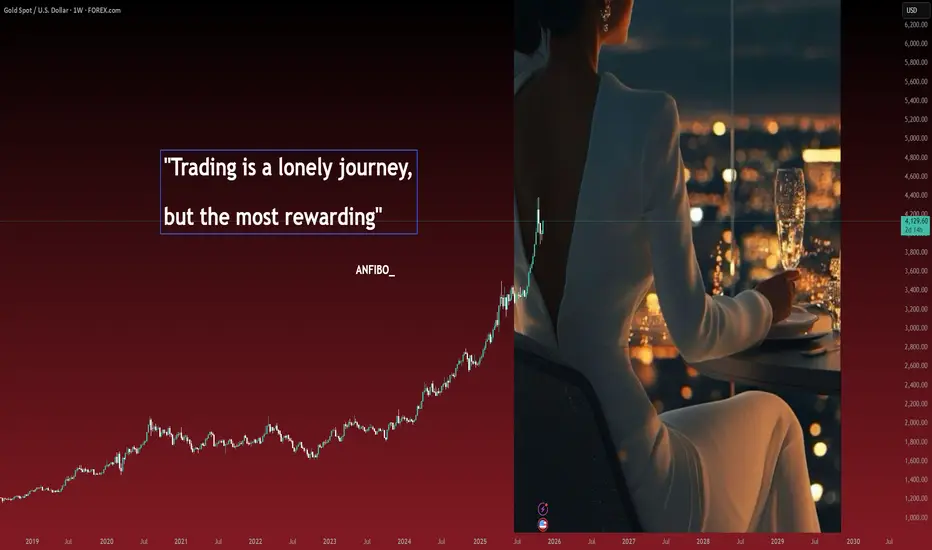
"Trading is a lonely journey, but the most rewarding""Trading is a lonely journey."
I had heard that saying a long time ago, but only when I stepped onto this path did I truly understand what it meant. On the first day I placed a trade, I thought everything was simple , just a few clicks, a few flickering green and red numbers, and I could make money. But the deeper I went, the more I realized that behind the screen was a cold, silent world where I was the only one facing myself.
No one understands the feeling of watching your account evaporate in just a few seconds. Nor can anyone share the tiny joy of a winning trade, because most outsiders only see the results — not the sleepless nights, not the heartbeats racing with every moving candle. Gradually, I learned to stay quiet : no more bragging about profits, no more complaining about losses. Trading taught me that emotions are the cruelest enemy.
There are days I stare at the chart until my eyes ache, my head spinning from those merciless price waves. I ask myself, “Am I really going in the right direction? Is trading even meant for me?” But then, in silence, I open my laptop again - analyze, take notes, place orders, as if it’s a habit I can’t let go of. Every loss hurts, but it also makes me stronger . I’ve learned to accept being wrong, to be disciplined, and to live with loneliness.
Trading isn’t just a battle with the market, it’s a battle with your own ego . It’s lonely, yes, but not meaningless. In that silence, I can hear my own thoughts more clearly ,my limits, and my desire to rise beyond them. Maybe only those who have walked this path can truly understand: behind every click lies countless emotions, unseen scars that only traders carry.
Trading is a lonely journey — but it’s also one of the most valuable journeys of all.
Try harder my friend! ;)
ANFIBO_
Xauusdsetup
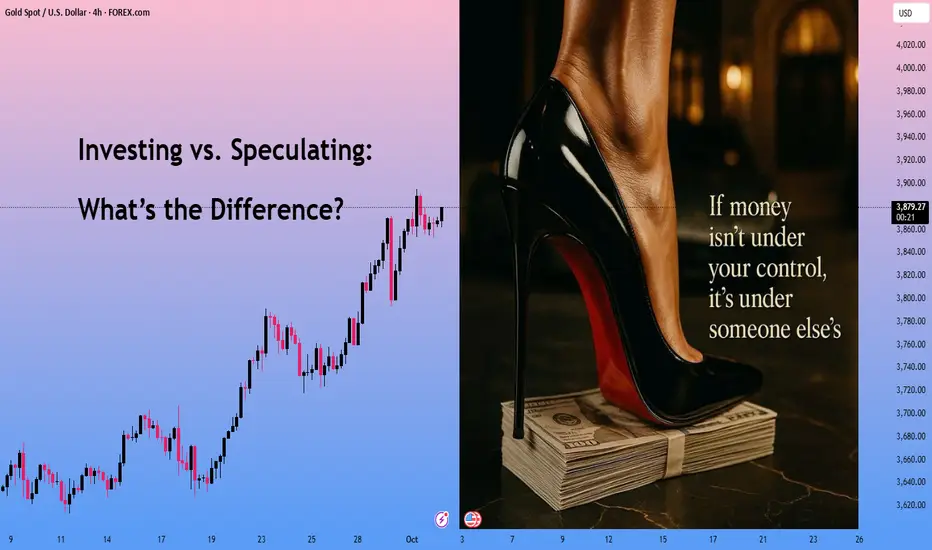
Investing vs. Speculating: What’s the Difference?Hey everyone, you’ve probably heard the words “investing” and “speculating,” but do you really know what sets them apart? Both are about putting money in to make more money, but the mindset and approach are Totally different. Let’s break it down super simply:
What’s Investing? (4 Keywords: Long-term, steady, knowledge, patience)
Investing is like a marathon—it’s about the long game, focusing on things that grow in value over time. You’re aiming for steady, lasting profits, not a quick buck.
When you invest, you do your research. You really understand what you’re putting your money into.
You use knowledge—like studying a company’s finances (FA), looking at market trends (TA), or knowing the rules of the game (FM, RM).
You stay cool-headed, not getting swept up by hype or greed.
Investing isn’t about betting everything on one big win. It’s about protecting your money first, then letting profits grow slowly.
Think of it like planting a tree: you care for it, water it, and wait patiently for the fruit.
For example , let’s say you research a solid real estate deal. You believe a piece of land will grow in value over 3–5 years because it’s in a great spot with new roads being built. You buy it, hold on, and later sell it for a profit. Or you keep it, build a house, or rent it out for monthly cash while owning something valuable.
Investing like this isn’t fazed by short-term ups and downs—it’s all about the long-term payoff.
What’s Speculating? (4 Keywords: Short-term, fast, risky, flexible)
Speculating is like surfing—you jump in to catch a quick wave and make money fast by riding short-term price changes.
You know the term “riding the wave”? That’s it! You need waves to surf, right? If there’s no wave, you’re stuck.
Speculating works the same: it’s a bit daring, and you have to be ready to lose.
When you see a chance, you dive in fast or cut your losses quickly if things go wrong.
For example , back in the day, I got hyped up when Elon Musk tweeted about SHIBA coin. I jumped in, my money shot up 10 times in a short time, and I sold fast. Good thing, because the price crashed right after! If I hadn’t moved quickly, my account would’ve been wiped out.
Speculating is all about quick moves—”buy the rumors, sell the news”, and cashing in on the hype. It’s not about long-term value; it’s about grabbing profits fast. But it’s way riskier, and you can lose everything if you’re not sharp. Knowing when to stop is super important.
So, What’s the Key Difference?
Investing is all about patience.
Speculating is about being quick and flexible.
Someone asked me: “If I trade short-term but do research, is that investing?” Awesome question! But even with research, short-term trading is usually called speculating.
Why?
Because it’s focused on fast profits and higher risks, unlike the steady, long-term foundation of investing.
If you trade short-term with a solid plan, that’s cooler—pros call it systematic trading, way better than just guessing. But in general, short-term moves are still seen as speculating, not investing, because they don’t have that long-term vision.
Investing without a plan? That’s just gambling. (Investing + No plan = Gambling)
Speculating with a strategy? You’re thinking like a smart entrepreneur. (Speculating + Strategy = Entrepreneur)
Whether investing or speculating is better depends on you—your style and your game plan!
That said, choosing between investing and speculatingsometimes depends on each person's position. I’ll share more details in my next video.
If you agree with my opinion, drop a comment here!
I’m Anfibo , just sharing what I know about finance.
Mastering XAUUSD Gold Trading: A Trading Plan For Success!🌟 In this video, I share my detailed trading plan and emphasize why a well-structured strategy is 🔑 to success. Learn how to trade Gold 🪙 using a trend continuation approach while leveraging TradingView's powerful tools and features to gain a real edge in the markets. 🖥️✨
Here’s what we’ll cover:
📊 Trend Analysis: A top-down review of market direction to identify opportunities.
📈 Market Structure & Price Action: Key insights into how price moves and behaves.
🎯 Trade Planning: Using higher timeframe support and resistance levels to set stop loss and target points.
🛠️ TradingView Features: Practical tools to refine your analysis and boost efficiency.
This video is an in-depth guide to trading effectively with a proven strategy, enhanced by TradingView's unique capabilities. 🚀 Please remember, this is not financial advice. 📜

XAUUSD GOLD: Understanding Trend Shifts for Precision Entries👀👉 In this video, we explore the inner workings of market trends and, more importantly, how smart money manipulates price action to sweep liquidity, allowing them to place their orders and sustain the trend. We also showcase a powerful, free indicator from TradingView’s extensive toolset. Here's what we cover:
📊 Understanding Trends: How trends truly operate in the market.
💰 Smart Money Tactics: How institutional traders manipulate price action to sweep liquidity and execute large orders.
🔑 Key Levels: Identifying crucial accumulation and distribution zones to approach potential trade setups effectively.
🛠 TradingView Indicators: Learn how to access tools that help spot when price is overextended.
🔎 Market Structure: Discover how to locate resting liquidity and anticipate price reactions, understanding the role of liquidity in market movement.
📈 Trade Setups: Using a practical approach, we examine price interactions with liquidity, blending Wyckoff theory and ICT concepts for sharper trade decisions.
Disclaimer: This video is for educational purposes only and is not financial advice. Trading involves significant risks. Be sure to conduct your own research before making any decisions. Trade responsibly.

howto set stoploss correctly and do a goodjob of risk managementStop loss is a necessary means to control risk, and using a good stop loss point is the only way for investors to win.
There are two types of methods for setting the stop loss point: the first type is a regular stop loss, that is, when the reasons and conditions for buying or holding disappear due to changes in market conditions, the position must be closed or stopped immediately. The second category is auxiliary stop loss. In practice, the maximum loss method, retracement stop loss, sideways stop loss, expected R multiplier stop loss, key psychological price stop loss, tangent support level stop loss, moving average stop loss, cost moving average stop loss, Bollinger band stop loss, volatility stop loss, K-line combination stop loss, chip intensive area stop loss, CDP (contrarian operation) stop loss, etc.Investors should judge based on their own risk tolerance and choose a stop loss method that suits them.
The market has been fluctuating all the time, and there are opportunities at all times, but before we make a transaction, when we look at a certain position, we also need to refer to whether the stop loss position is well set, how much profit margin can be grasped, and whether it has played a role in using small capital to fight for high returns.
The size of the stop loss: It can be set according to the resistance support in the seeking stop loss point above. The size of the stop loss we are talking about here should be set more based on the profit margin. This is the high return of small capital. When our profit margin can only be seen at 5-8 points, the stop loss can be controlled at about 3 points; The stop loss point for medium- and long-term trading can be appropriately enlarged, and when the profit point is above 30 points, the stop loss can be set to more than 8-10 points.Of course, the size of the stop loss is more of a reference factor in resistance and support.
Spread in stop loss: We all know that the cost of trading is composed of spread and commission. When we place an order, we try to find the best entry point and calculate the spread. Then the same is true when setting the stop loss. The above talked about finding the stop loss point and the size of the stop loss, then in the gold investment market, it is often a decimal point that can change the profit or loss, so we need to calculate the spread when setting the stop loss.
Several principles for setting a stop loss point:
1. Once the stop loss point is set, it is not recommended to change frequently if it is not necessary. It should be implemented decisively. Stop loss is actually a prerequisite and guarantee for profit.
2. The stop loss point should be set before each lot is traded.
3. The stop loss point can be flexibly changed, but it must not be changed day and night.
4. Before setting the stop loss point, it must be based on the current overall trend
In order to facilitate everyone to continue to follow up on my analysis and sharing, you can like and follow me; in addition, I will share the daily real-time strategy in the channel. If you can't follow up in real time, you may make operational errors.You can use the following methods to enter my channel for free to follow the latest news and follow up on market trends in real time.

judgment of technical indicators and application skills1. Simple judgment of support and resistance:
Support and resistance levels are the points in the chart that are subjected to continuous upward or downward pressure.The support level is usually the lowest point in all chart patterns (hourly, weekly, or annual), while the resistance level is the highest point (peak)in the chart.When these points show a downward trend, they are recognized as support and resistance.The best time to buy/sell is near the support/resistance level that is not easy to break.Once these levels are broken, they tend to become reverse obstacles.Therefore, in an uptrend market, the broken resistance level may become support for the upward trend; however, in a downtrend market, once the support level is broken, it will turn into resistance.
2. Understanding of lines and channels:
Trend lines are a simple and practical tool in identifying the direction of market trends.The upward straight line is formed by at least two consecutive low points connected.Naturally, the second point must be higher than the first point.The extension of a straight line helps determine the path along which the market will move.Upward trend is a specific method used to identify support lines/levels.On the contrary, the downward line is drawn by connecting two or more points.The variability of trading lines is to some extent related to the number of connection points.However, it is worth mentioning that each point does not have to be too close.A channel is defined as an upward trend line parallel to the corresponding downward trend line.Two lines can represent price upward, downward, or horizontal corridors.The common attribute of a channel that supports the connection point of a trend line should be between the two connection points of its reverse line.
3. Understanding and understanding of the average line:
If you believe in the creed of "trend is your friend" in technical analysis, then the moving average will benefit you a lot.The moving average shows the average price at a specific time in a specific period.They are called "moves" because they are measured at the same time and reflect the latest average.
One of the shortcomings of moving averages is that they lag behind the market, so they are not necessarily a sign of a trend shift.To solve this problem, using a shorter period moving average of 5 or 10 days will better reflect recent price movements than a 40 or 200-day moving average.Alternatively, the moving average can also be used by combining two average lines of different time spans.Regardless of the use of 5 and 10-day moving averages, or 40- and 200-day moving averages, buy signals are usually detected when the shorter-term average crosses the longer-term average upward.In contrast, a sell signal will be prompted when the shorter-term average crosses the longer-term average downwards.
In order to facilitate everyone to continue to follow up on my analysis and sharing, you can like and follow me; in addition, I will share the daily real-time strategy in the channel. If you can't follow up in real time, you may make operational errors.You can use the following methods to enter my channel for free to follow the latest news and follow up on market trends in real time.
