GOLD - Ascending Channel Holding Strong | FVG Retest in Play
Hey TradingView community! 👋
Gold is looking really interesting right now. Let me break down what I'm seeing on the 45-minute chart.
The Setup
XAUUSD is trading at 4,477 inside a well-defined ascending channel that's been holding since early January. After that sharp rejection from the 4,550 resistance zone, price pulled back and is now consolidating right above a key FVG (Fair Value Gap) zone around 4,460-4,480.
This is exactly the kind of structure I love to see - higher highs, higher lows, and now a healthy retest of the imbalance zone.
Why I'm Bullish
Ascending channel structure intact - buyers defending the rising trendline
FVG zone acting as support - price reacting positively here
Safe-haven demand returning amid geopolitical uncertainty
Performance is insane: +68.24% over the past year, +3.66% YTD already
52-week high at 4,550 - we're knocking on the door
Key Levels I'm Watching
Resistance:
4,500 - Psychological level and recent rejection
4,550 - 52-WEEK HIGH / Major resistance
Support:
4,460-4,480 - FVG zone (current test)
4,408 - Channel support / horizontal support
4,275 - Lower channel boundary
My Game Plan
Primary scenario: If gold holds above the 4,460 FVG zone and respects the rising channel support, I expect buyers to push price back toward 4,500-4,550 resistance. A clean break above 4,550 opens the door for 4,600+.
Risk scenario: A decisive break below 4,408 would weaken the bullish structure and could trigger a deeper pullback toward 4,300-4,350.
The Bottom Line
Structure remains constructive. The ascending channel is intact. Safe-haven flows are supporting gold amid all the Trump policy chaos and geopolitical headlines. As long as we hold above 4,408, I'm staying bullish with targets at 4,500 and 4,550.
What do you think? Are you bullish or bearish on gold here? Drop your thoughts in the comments! 👇
If this analysis helped you, please comment what you want me to analyze next!
#futurestrading

ES (SPX, SPY) Analysis, Levels, Setups for Tue (Jan 6)U.S. stock markets closed on a positive note today, buoyed primarily by gains in the energy sector and large banking institutions. This upside was propelled by headlines related to Venezuela, which invigorated both the energy market and investor risk sentiment. Meanwhile, the ISM Manufacturing Index for December showed a contraction, remaining below the 50 threshold, which reinforces the narrative of uneven economic growth and places increased emphasis on upcoming services data scheduled for release later this week.
Looking Ahead to Tuesday:
The macroeconomic calendar for Tuesday appears relatively light, suggesting that the equity markets may engage in a more directional trading pattern unless unexpected geopolitical developments emerge overnight. The primary risk window looms larger later in the week with significant reports on ADP employment, ISM Services, and the EIA energy outlook, culminating in the Nonfarm Payrolls report.
Overnight Outlook into New York:
The most probable scenario sees a rotation around the 6948.50 level (VWAP), with a two-sided trading dynamic expected. Key support is identified at the 6942.50/6940.00 range, while the first resistance ceiling is placed between 6955.25 and 6963.50. A bullish scenario would emerge with a stable hold above 6942.50 and a successful move through 6955.25, paving the way toward the 6963.50 resistance level and beyond. Conversely, bearish pressure may materialize if the index falls below 6940.00, with a failure to reclaim 6942.50 potentially exposing levels around 6932.75 and the 6912.75-6906.00 range.
Trade Setups for Tomorrow
A++ Long Setup (Preferred):
Entry: 6932-6935 (PDL / NYAM.L test)
Stop: 6927
Target: 6948-6955
B+ Short Setup (Fade Rally) :
Entry: 6950-6955 (VWAP / Y-POC rejection)
Stop: 6960
Target: 6935-6940
Deep Discount Long (If Major Flush):
Entry: 6906-6912 (LO.H / AS.H zone)
Stop: 6900
Target: 6940-6950
Good Luck !!!

How to Trade with Volume Profile in TradingView Master Volume Profile using TradingView's powerful charting tools in this step-by-step tutorial from Optimus Futures.
Volume Profile is an advanced charting indicator that helps traders identify key support and resistance levels, areas of price acceptance, and potential breakout zones by showing where trading activity is concentrated at different price levels.
What You'll Learn:
Understanding Volume Profile as a price-based volume tool that displays trading activity horizontally across price levels
How the Point of Control (POC) represents the price level with the highest traded volume
How the Value Area encompasses approximately 70% of all traded volume, bounded by the Value Area High (VAH) and Value Area Low (VAL)
Why High Volume Nodes signal areas of price acceptance and potential support or resistance
Why Low Volume Nodes signal areas of price rejection where markets tend to move quickly
Recognizing when price trades above or below the previous session's Value Area for directional bias
Why these levels aren't automatic buy or sell triggers, and how to confirm them with other tools like traditional support/resistance or trend analysis
Identifying the "low volume node breakout," a setup where price accelerates through thin areas
Spotting potential mean-reversion trades when price returns to the POC after an extended move
How to add Volume Profile tools on TradingView via the drawing tools panel
Understanding Fixed Range, Anchored, and Session Volume Profile options and when to use each
Practical examples using futures charts
Applying Volume Profile across daily, weekly, and intraday timeframes for market structure analysis and trade planning
Learn more about futures trading with TradingView:
optimusfutures.com
Disclaimer
There is a substantial risk of loss in futures trading. Past performance is not indicative of future results. Please trade only with risk capital. We are not responsible for any third-party links, comments, or content shared on TradingView. Any opinions, links, or messages posted by users on TradingView do not represent our views or recommendations. Please exercise your own judgment and due diligence when engaging with any external content or user commentary.
This video represents the opinion of Optimus Futures and is intended for educational purposes only. Chart interpretations are presented solely to illustrate objective technical concepts and should not be viewed as predictive of future market behavior. In our opinion, charts are analytical tools — not forecasting instruments.

ES (SPX, SPY) Analysis, Key Levels, Setups for Fri (Jan 2nd)Market Overview: Context for Friday
As the market transitions from year-end positioning, traders should anticipate a choppy session influenced by holiday-thinned activity. Initially, expect fluctuations without a clear directional trend, but anticipate more definitive movements once New York cash volume resumes its normal pace.
From a structural standpoint, higher timeframes continue to reflect an uptrend. However, a recent decline from the 6980s has initiated a fresh pullback, leading to a short-term bias focused on “repair mode.” A shift in sentiment could occur if prices can reclaim and hold the mid-6940s.
Currently, prices are stabilizing around the 6920 mark following a sharp decline and subsequent bounce. This positioning places the E-mini S&P 500 (ES) in a mean-reversion zone, where oscillations between key value levels are expected as traders navigate the current landscape.
Forecasting Potential Market Movements
Base Case: Expect a range-bound market with a focus on repairing price levels.
Overnight Activity: The market has shown rotation around key levels of 6916 and 6922.50, with buying interest emerging above 6908.50.
Opening Analysis: As the New York session begins, we anticipate attempts to breach the 6922.50 to 6935.25 range. Should buyers fail to maintain support above 6922.50 during retests, the market is likely to rotate back towards 6916, followed by support at 6908.50.
Bullish Scenario: A strong upward movement could materialize with a decisive breakout above 6922.50.
- Trigger Point: A 15-minute close above 6922.50, followed by pullbacks that maintain support above 6921.50.
- Target Levels: Initial target at 6935.25, with further upside potential towards 6947.50 to 6951.50.
Bearish Scenario: A downward failure could emerge if the market loses the 6908.50 level.
- Trigger Point: Persistent failures to sustain above 6916, accompanied by a 15-minute close below 6908.50.
- Target Levels: An initial downside target at 6895.25, followed by 6890.25 to 6888.00. If 6888 is breached and held, the next level of interest would be 6873.
Events to watch tomorrow (timing is ET)
• 09:45 - S&P Global US Manufacturing PMI (final)
• 16:30 - Fed H.4.1 balance sheet update (released on the next business day when the usual Thursday release falls on a federal holiday)
A++ SETUP 1 (LONG) - Rejection Fade
Entry: 6888.00-6892.25 (buy only after a flush into the pocket, then reclaim)
Stop: 6878.00
• TP1: 6922.50
• TP2: 6935.25
• TP3: 6947.50
• Invalidation: 15m body closes below 6888.00 and does not reclaim quickly
A++ SETUP 2 (SHORT) - Rejection Fade
Entry: 6947.50-6951.50 (sell only after a push up, then fail back under 6947.50)
Stop: 6962.00
• TP1: 6922.50
• TP2: 6916.00
• TP3: 6890.25
• Invalidation: 15m closes and holds above 6951.50 (or a clean push above 6962.00)
Good Luck !!!

When Indexes Stop Agreeing, Markets Start TalkingEver notice how markets can look strong… yet feel a little off?
That’s usually when indexes stop marching in sync — and right now, that’s exactly what’s happening.
Let’s break it down, no jargon overload, no crystal balls.
Four Indexes, Four Different Stories
Here’s the current lineup in US equity index futures:
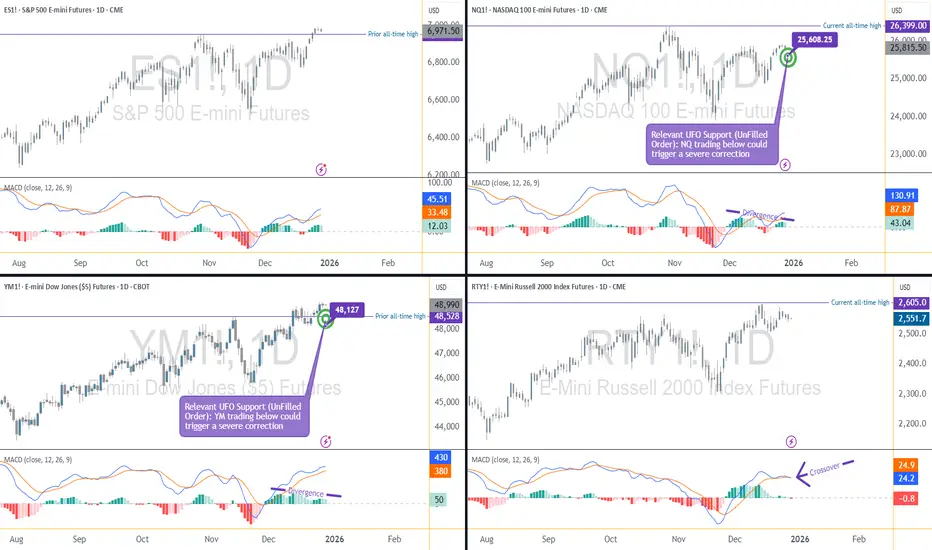
S&P 500 (ES) → Pushing to fresh all-time highs
Dow Jones (YM) → Also holding above prior highs
NASDAQ 100 (NQ) → Lagging below its peak
Russell 2000 (RTY) → Still stuck under its highs
When all four move together, trends tend to behave.
When they don’t? Markets usually get… interesting.
Why This Disagreement Matters
The NASDAQ is packed with technology and AI-related names — the same group that carried much of the upside through 2025. Its failure to confirm new highs raises an eyebrow.
Meanwhile:
The Dow (YM) is strong, despite being less tech-heavy
Small caps (RTY) aren’t joining the party
Leadership is narrowing, not expanding
That’s not a signal by itself — but it is a clue.
Momentum Is Whispering (Not Shouting)
Momentum indicators aren’t screaming danger, but they are quietly tapping the mic:
NASDAQ shows a bearish divergence
Dow also shows a bearish divergence (yes, even while strong)
Russell goes a step further with a divergence and a momentum crossover
The S&P 500? Still holding up — but increasingly alone.
When momentum fades while price stays elevated, markets often shift from trending to fragile.
The Levels That Actually Matter
Here’s where structure comes in.
Two UFO (UnFilled Orders) support zones sit right below price:
NASDAQ (NQ): ~25,608
Dow (YM): ~48,127
Above these levels, structure is intact.
Below them? That’s when momentum warnings could start turning into price action.
Think of these zones as market tripwires — nothing happens until they’re crossed.
Condition-Based Thinking (No Guessing Required)
Instead of asking “Will the market drop?”, a better question is:
What would need to happen for risk to expand?
A simple framework:
NQ below support + YM below support
Weakest and strongest indexes failing together
Divergences resolving through price, not time
That’s when downside scenarios become more relevant — not before.
Quick Note on Contract Specs & Margin
All four index futures discussed are available in E-mini and Micro E-mini versions, moving tick-for-tick with the same underlying index.
At a glance:
Micro contracts = 1/10 the tick value of E-minis
Typical tick values:
ES / MES: $12.50 vs. $1.25
NQ / MNQ: $5.00 vs. $0.50
YM / MYM: $5.00 vs. $0.50
RTY / M2K: $5.00 vs. $0.50
Margin context (approximate):
ES / MES: $22,500 vs. $2,250
NQ / MNQ: $33,500 vs. $3,350
YM / MYM: $14,250 vs. $1,425
RTY / M2K: $9,500 vs. $950
Same market, same analysis — just different risk granularity. This becomes especially useful when markets are hovering near key structural levels.
The Big Takeaway
Markets don’t usually turn when everyone expects them to.
They turn when participation fades, leadership narrows, and structure starts cracking.
Right now:
Some indexes are strong
Others are lagging
Momentum is diverging
Key levels are close
No conclusions. No assumptions.
Just evidence — and levels worth paying attention to as 2026 approaches.
Want More Depth?
If you’d like to go deeper into the building blocks of trading, check out our From Mystery to Mastery trilogy, three cornerstone articles that complement this one:
🔗 From Mystery to Mastery: Trading Essentials
🔗 From Mystery to Mastery: Futures Explained
🔗 From Mystery to Mastery: Options Explained
When charting futures, the data provided could be delayed. Traders working with the ticker symbols discussed in this idea may prefer to use CME Group real-time data plan on TradingView: www.tradingview.com - This consideration is particularly important for shorter-term traders, whereas it may be less critical for those focused on longer-term trading strategies.
General Disclaimer:
The trade ideas presented herein are solely for illustrative purposes forming a part of a case study intended to demonstrate key principles in risk management within the context of the specific market scenarios discussed. These ideas are not to be interpreted as investment recommendations or financial advice. They do not endorse or promote any specific trading strategies, financial products, or services. The information provided is based on data believed to be reliable; however, its accuracy or completeness cannot be guaranteed. Trading in financial markets involves risks, including the potential loss of principal. Each individual should conduct their own research and consult with professional financial advisors before making any investment decisions. The author or publisher of this content bears no responsibility for any actions taken based on the information provided or for any resultant financial or other losses.

ES (SPX, SPY) Analysis, Key Levels, Setups for Wed (Dec 31st)Market Outlook for December 31, 2025 (NY Session)
As we approach the end of the year, investors should be aware of key economic data slated for release that could influence the equity markets, particularly the E-mini S&P 500 (ES).
Economic Calendar (All Times Eastern)
07:00 – MBA Mortgage Applications
While typically seen as a low-impact indicator, this data will be closely watched for any surprises due to its sensitivity to interest rates.
08:30 – Initial Jobless Claims
This report has been advanced this week as Thursday is a federal holiday. Given its implications for labor market strength, it could have noteworthy effects on investor sentiment.
10:00 – NY Fed Corporate Bond Market Distress Index
This indicator serves as a pulse on credit market conditions. A significant change here could signal broader market stress.
10:30 – EIA Weekly Petroleum Status Report
The release of this report comes at a time of heightened scrutiny on energy prices and inflationary pressures. It's advisable to keep an eye on potential spillover effects into the broader indices.
Market Structure Note
Please note that while the US stock market will be open for regular trading hours, the US bond market will have an early close at 2:00 PM ET. This adjusted schedule may influence trading volumes and market dynamics as we wind down the year.
Market Analysis: The Path Ahead Amid Holiday-Induced Thin Trading
The trading session was marked by subdued yet erratic price movements, a natural consequence of reduced market participation during the holiday season. Despite some fluctuations, traders largely refrained from aggressively pursuing dips, while upward movements faced difficulties in maintaining momentum.
In the macroeconomic landscape, the recently released Federal Reserve minutes underscored significant internal divisions regarding prospective interest rate cuts. This lack of consensus diminishes certainty about future rate adjustments, extending uncertainty into early 2026.
As we approach year-end, upcoming trading dynamics will be affected. With Wednesday signaling the final trading day of the year, participants should anticipate a landscape characterized by uneven liquidity. This could lead to increased volatility, particularly around key support and resistance levels, with a heightened potential for stop hunts as markets test widely recognized highs and lows.
Overnight NY Market Forecast: A Scenario Analysis
As we observe the market dynamics, we present a scenario plan that outlines potential movements for the coming hours.
Base Case: Currently, the market is oriented towards a bearish sentiment while trading below the 6950-6953 range. We anticipate a two-way trading environment within the 6928-6950 band, characterized by sharper price fluctuations than typically expected as we approach year-end.
Bullish Scenario: A definitive reclaim and sustained trading above 6953.50 would open pathways for an upward movement into the 6958-6961 range, and potentially to the psychological level of 6969-6970 thereafter.
Bearish Scenario: Conversely, a significant breach below 6928.25 could trigger a cascade towards 6926.25, followed rapidly by 6918.00. Should selling pressure intensify, the 6900 mark may become the next focal point for traders.
SETUP 1 (A++) - Long - Reclaim and go (support to value)
Entry
• Buy 6934.00-6935.00 (only after the reclaim hold is visible)
Hard SL
• 6925.75 (below 6926.25, with extra buffer)
Targets
• TP1 6953.50
• TP2 6957.75
• TP3 6961.50
SETUP 2 (A++) - Short - Rejection fade from upper cap (premium to PDL)
Entry
• Sell 6956.75-6958.00
Hard SL
• 6964.00 (above the 6961.50/6960.75 cap with buffer)
Targets
• TP1 6940.75
• TP2 6930.00
• TP3 6918.00
Good Luck !!!

When Indexes Disagree: Evidence-Based Clues Heading Into 2026Market Context: Why Futures-Based Index Analysis Matters
When equity markets approach historical extremes, surface-level price action often hides important structural information. This is especially true when analyzing cash indices alone. Futures markets, by contrast, provide continuous pricing across all trading sessions, including the Globex (Extended Trading Hours) session, offering a more complete picture of participation, liquidity, and risk transfer.
By focusing on US equity index futures rather than cash indices, traders gain visibility into how markets behave outside regular trading hours — often where meaningful positioning occurs. This becomes particularly important when markets are near all-time highs and internal alignment begins to fracture.
In this analysis, attention is placed on the four most relevant US equity index futures:
E-mini S&P 500 Index Futures (ES)
E-mini NASDAQ 100 Index Futures (NQ)
E-mini Dow Jones Index Futures (YM)
E-mini Russell 2000 Index Futures (RTY)
Together, these markets represent large-cap growth, broad market exposure, industrial and value-oriented components, and small-cap participation. When these indexes move in harmony, trends tend to persist. When they diverge, conditions often become more fragile.
All-Time Highs in Focus: Who Is Leading and Who Is Lagging
A defining characteristic of the current environment is disagreement among indexes, despite elevated price levels.
The E-mini S&P 500 Index Futures (ES) has recently pushed to a new all-time high. This reflects ongoing strength in the broader market and confirms that headline risk appetite remains intact.
In contrast, the E-mini NASDAQ 100 Index Futures (NQ) has failed to confirm this strength. Despite previous leadership, NQ is currently trading below its all-time high. This matters because the NASDAQ is heavily weighted toward technology and growth-related stocks, including those linked to artificial intelligence (AI) — sectors that provided a significant portion of upside momentum throughout 2025.
Meanwhile, the E-mini Dow Jones Index Futures (YM) is trading above its prior all-time high. This is notable because the Dow has a more diversified sector composition and is less concentrated in high-growth technology names. Its relative strength suggests that current market resilience may be coming from areas outside of the technology complex.
Finally, the E-mini Russell 2000 Index Futures (RTY) remains below its all-time high. Small- and mid-cap stocks often act as a confirmation layer for broader economic participation. When large-cap indexes make new highs while small caps lag, it can signal uneven economic traction and rising internal imbalance.
This combination — ES and YM showing strength, while NQ and RTY lag — forms the foundation of the current intermarket tension.
Momentum Evidence: What MACD Is Revealing Across Indexes
Price alone rarely tells the full story near extremes. Momentum indicators, when used correctly, help evaluate the quality of participation behind price movement.
In this case, the MACD indicator reveals important divergences across multiple indexes.
The NQ is displaying a bearish momentum divergence, where price remains elevated but momentum fails to confirm. This suggests that upside participation is narrowing rather than expanding.
The YM — despite being one of the strongest indexes — is also showing a bearish divergence on MACD. This is particularly important because divergences forming in strong markets often precede broader shifts, not because price must reverse immediately, but because momentum strength is no longer accelerating.
The RTY presents the most advanced signal set. It is not only showing a bearish divergence, but also a MACD crossover, which can be interpreted as early-stage downside momentum attempting to assert itself.
The ES, while not currently exhibiting the same degree of momentum weakness, stands increasingly isolated. When leadership narrows to one index, risk becomes asymmetric rather than evenly distributed.
Structural Risk Zones: Interpreting UFO (UnFilled Orders) Support
Momentum divergences alone do not constitute actionable signals. They require structural confirmation.
This is where UFO support and resistance levels (UnFilled Orders) become relevant. UFO zones represent areas where liquidity previously failed to transact fully, often acting as structural support or resistance when revisited.
In the current structure, two UFO support zones stand out due to their proximity to price and their relevance to both the strongest and weakest markets:
NQ: UFO support ending near 25,608.25
YM: UFO support ending near 48,127
These levels are significant because they sit directly beneath current price action. As long as price remains above these zones, structure remains intact despite momentum warnings.
However, a violation of such UFO supports would represent a meaningful shift. It would indicate that buyers previously willing to defend these levels are no longer present, allowing momentum divergences to express themselves more fully.
Conditional Scenarios: What Would Confirm a Broader Risk Shift
Rather than anticipating outcomes, evidence-based analysis focuses on conditions.
From a structural standpoint, bearish scenarios would gain credibility if:
NQ trades below 25,608.25, violating its nearby UFO support
YM trades below 48,127, removing structural support from the strongest index
Weakness emerging simultaneously in both the weakest and strongest indexes would suggest that divergence is resolving through price rather than consolidation. In such a case, broader downside expansion could develop, potentially manifesting as a sharp corrective phase.
Importantly, this framework does not assume that such a move must occur. It simply defines what conditions would matter if they do.
Illustrative Trade Framework (Educational Example Only)
For traders studying downside scenarios, a hypothetical bearish framework could be structured as follows:
Trigger: Confirmed daily close below relevant UFO support
Risk Definition: Invalidation above reclaimed structure
Objective: Next lower structural liquidity zone
Reward-to-Risk: Favorable only if structure breaks decisively
This framework is illustrative and intended solely to demonstrate how structure, momentum, and confirmation can align. It does not imply expectations or outcomes.
E-mini vs. Micro E-mini Contracts
All four equity index futures discussed — ES, NQ, YM, and RTY — are available in both E-mini and Micro E-mini formats. Both versions track the same underlying index and move tick-for-tick together. The difference lies in how risk is expressed.
ES / MES Tick size: 0.25 index points = $12.50 (ES) | $1.25 (MES)
NQ / MNQ Tick size: 0.25 index points = $5.00 (NQ) | $0.50 (MNQ)
YM / MYM Tick size: 1 index point = $5.00 (YM) | $0.50 (MYM)
RTY / M2K Tick size: 0.10 index points = $5.00 (RTY) | $0.50 (M2K)
Across all four indexes, Micro E-mini contracts represent one-tenth of the tick value of their E-mini counterparts.
Margin requirements vary by broker and market conditions. From a structural perspective:
ES / MES required margin = ~$22,500 (ES) | ~$2,250 (MES)
NQ / MNQ required margin = ~$33,500 (NQ) | ~$3,350 (MNQ)
YM / MYM required margin = ~$14,250 (YM) | ~$1,425 (MYM)
RTY / M2K required margin = ~$9,500 (RTY) | ~$950 (M2K)
This difference allows traders to express the same market thesis with far greater precision, especially when working around tight structural levels or conditional triggers.
With momentum divergences developing and key structural zones nearby, position sizing flexibility becomes critical. Micro E-mini contracts make it possible to:
Scale exposure gradually
Reduce concentration risk
Align risk more closely with invalidation levels
The analysis remains identical across E-minis and Micros — only the risk calibration changes.
Risk Management Considerations
Divergences can persist longer than expected, especially in strong trends. Acting without confirmation often leads to premature positioning.
Key principles include:
Waiting for structural validation
Defining risk before engaging
Managing exposure across correlated instruments
Avoiding overconfidence near historical extremes
Markets rarely turn because of opinion. They turn when structure and participation change.
Final Takeaway: Evidence Over Assumptions
As 2025 comes to a close, US equity index futures present a market that is strong on the surface but fractured underneath. Leadership is narrowing, momentum is diverging, and structural levels are increasingly relevant.
Whether these signals resolve through consolidation or correction remains unknown. What matters is that the evidence is now visible — and futures markets provide the clarity needed to observe it.
Data Consideration
When charting futures, the data provided could be delayed. Traders working with the ticker symbols discussed in this idea may prefer to use CME Group real-time data plan on TradingView: www.tradingview.com - This consideration is particularly important for shorter-term traders, whereas it may be less critical for those focused on longer-term trading strategies.
General Disclaimer
The trade ideas presented herein are solely for illustrative purposes forming a part of a case study intended to demonstrate key principles in risk management within the context of the specific market scenarios discussed. These ideas are not to be interpreted as investment recommendations or financial advice. They do not endorse or promote any specific trading strategies, financial products, or services. The information provided is based on data believed to be reliable; however, its accuracy or completeness cannot be guaranteed. Trading in financial markets involves risks, including the potential loss of principal. Each individual should conduct their own research and consult with professional financial advisors before making any investment decisions. The author or publisher of this content bears no responsibility for any actions taken based on the information provided or for any resultant financial or other losses.
ES (SPX, SPY) Analysis, Key Zone, Setups for Fri (Dec 26)Market Overview: Context for Tomorrow
Trend Analysis: The market maintains a risk-on sentiment as we approach the holiday period, characterized by strong index performance accompanied by light trading volume. This condition often results in a “grind up or chop up” scenario, although we may witness abrupt price movements due to diminished liquidity.
E-mini S&P 500 (ES) Positioning: Currently, prices are situated in the upper range of the recent swing high, indicating a premium area. This positioning heightens the probability of a retracement towards mid-range levels before any further upward momentum takes place.
Looking Ahead to Tomorrow: Investors should anticipate one of two scenarios: (a) a decisive dip that finds support at the Volume Weighted Average Price (VWAP) or Value Area Low (VAL), followed by a re-acceleration towards the Previous Day High (PDH) or Value Area High (VAH), or (b) a definitive rejection at the PDH/VAH that results in a retracement back to the VWAP/VAL zone.
Event Risk - Friday Schedule (ET):
Macro Releases: No major U.S. economic data is scheduled for release tomorrow.
Notable Item: The NY Fed Staff Nowcast will be published at 11:45 a.m. ET, though it typically produces limited market impact relative to key indicators like CPI or NFP.
Implications for the Market: With fewer scheduled economic shocks on the calendar, we can expect a market environment driven more by trading flows than by significant data releases, indicative of a "holiday hangover" effect.
New York Session Forecast
As we head into the New York trading session, the anticipated price path for the day suggests a cautious approach.
The primary range rotation is centered around key levels at 6982.50 (Y-POC) and 6976.75 (VWAP). We expect two-way trading to persist within the confines of 6971.50 to 6988.50 until we see a clearer indication of cash volume dynamics in New York.
Bullish Scenario:
In a bullish scenario, we would need to maintain support in the range of 6976.75 to 6971.50 on any pullbacks. A sustained rally would then target upward moves, aiming for 6988.00 to 6988.50. A decisive break above 6988.50 could trigger a significant advance towards the 6996 to 7000 range.
Bearish Scenario:
Conversely, if we experience a failed attempt to break into the 6988.00 to 6996 area—indicative of a lack of acceptance—we may see a pullback towards 6976.75. A breach of the critical support at 6971.50 could lead to testing lower levels at 6962.75 and 6957.25.
A++ SETUP 1 - LONG (pullback reclaim)
Entry: 6976.75-6971.50
Trigger: 15m tags pocket and closes back above 6976.75 -> 5m higher-low -> 1m pullback holds then push
SL: 6966.00
• TP1: 6988.50
• TP2: 6996.00-7000.00
• TP3: 7006.00-7012.00
A++ SETUP 2 - SHORT (top rejection)
Entry: 6988.00-6996.00
Trigger: 15m pushes into band then closes back below 6988.50 -> 5m lower-high -> 1m pullback fails then drop
SL: 6999.00
• TP1: 6971.50
• TP2: 6962.75
• TP3: 6957.25
Good Luck !!!

Forget the Textbook: A 30-Year Reality CheckA Big Policy Moment
A central bank (BOJ) just pushed interest rates to levels not seen in 30 years.
That’s not a routine tweak — that’s a regime shift.
Textbooks might suggest a clean, logical market response.
Reality? Markets got emotional. Fast.
Selling Got Loud
Instead of an orderly adjustment, selling pressure exploded.
Not just “price going down,” but effort going through the roof.
That’s where Volume Delta comes in — the net difference between buying and selling volume. It tells us who is pressing the gas pedal.
And in this case, sellers floored it.
When an Indicator Starts Yelling
Now here’s the interesting part.
Bollinger Bands weren’t applied to price…
They were applied to Volume Delta itself.
Result?
Volume Delta plunged far below its lower Bollinger Band.
That’s not normal selling.
That’s everyone trying to get out at the same time.
Does that mean price must reverse?
Nope. But it does suggest selling is becoming inefficient.
No Safety Net Below
Here’s the catch.
There are no meaningful UFO supports (UnFilled Orders) below current price.
No obvious institutional “safety net.”
Instead, only two old technical floors remain:
0.0063330
0.0062415
Think of them as floors, not trampolines. Price may react… or punch straight through.
Reaction Beats Guessing
This is where patience matters.
Extreme selling doesn’t mean “buy now.”
It means watch closely.
At those levels, traders are looking for:
Selling pressure slowing down
Price stabilizing
Daily closes showing acceptance or rejection
No assumptions. Only reactions.
Don’t Forget the Ceiling
Even if price bounces, there’s a ceiling waiting above.
A clear sell-side UFO resistance sits near 0.0065640.
That’s leftover supply — the kind that often stops rallies in their tracks.
So any upside move?
Treat it as corrective until structure says otherwise.
Contract Specs
This analysis uses both standard and micro futures to illustrate scalable risk. Japanese Yen Futures (6J) have a tick size of 0.0000005 with a $6.25 tick value and currently require roughly ~$2,800 in margin per contract, while Micro JPY/USD Futures (MJY) use a 0.000001 tick size with a $1.25 tick value and margin closer to ~$280. Margin requirements vary by market conditions and broker policies, and micro contracts can be especially useful when volatility expands following major macro events.
The Big Takeaway
Historic policy decisions don’t end stories — they start messy chapters.
Extreme Volume Delta shows stress, not certainty.
Structure decides what comes next.
When markets digest big shocks, the edge doesn’t come from predicting —
It comes from staying disciplined while everyone else reacts.
Want More Depth?
If you’d like to go deeper into the building blocks of trading, check out our From Mystery to Mastery trilogy, three cornerstone articles that complement this one:
🔗 From Mystery to Mastery: Trading Essentials
🔗 From Mystery to Mastery: Futures Explained
🔗 From Mystery to Mastery: Options Explained
When charting futures, the data provided could be delayed. Traders working with the ticker symbols discussed in this idea may prefer to use CME Group real-time data plan on TradingView: www.tradingview.com - This consideration is particularly important for shorter-term traders, whereas it may be less critical for those focused on longer-term trading strategies.
General Disclaimer:
The trade ideas presented herein are solely for illustrative purposes forming a part of a case study intended to demonstrate key principles in risk management within the context of the specific market scenarios discussed. These ideas are not to be interpreted as investment recommendations or financial advice. They do not endorse or promote any specific trading strategies, financial products, or services. The information provided is based on data believed to be reliable; however, its accuracy or completeness cannot be guaranteed. Trading in financial markets involves risks, including the potential loss of principal. Each individual should conduct their own research and consult with professional financial advisors before making any investment decisions. The author or publisher of this content bears no responsibility for any actions taken based on the information provided or for any resultant financial or other losses.

ES (SPX, SPY) Analysis, Key Zones, Setups for Wed (Dec 24th)Market Overview: Insights from Today's Trading
U.S. equities closed higher once again, reaching fresh highs primarily driven by large-cap technology and AI stocks, although broader market participation appeared mixed. The momentum was fueled by stronger-than-expected Q3 GDP data, which, combined with a dip in consumer confidence, suggests that economic growth may remain robust even as interest rates trend lower in the future. As we approach the holiday season, thinner liquidity in the markets is becoming increasingly relevant, often resulting in subdued trading activity punctuated by abrupt moves in response to key economic releases.
Analyzing the structure, the E-Mini S&P 500 (ES) is positioned in the upper range of recent trading and is approaching a notable overhead supply zone, characterized by the recent swing highs. The recent upward movement was significant, demonstrating a rapid recovery from the low 6900s to the mid-to-high 6900s; however, the price is currently stalling beneath a well-defined resistance level. This scenario typically leads to one of two potential developments:
1. A prolonged period of consolidation beneath the resistance, followed by a sharp breakout, often triggered by key economic data released at 8:30 AM.
2. A failure to maintain support at mid-range levels, which could result in a downward rotation toward previous demand zones, commonly aligning with metrics such as VWAP, Y-VAL, or PDL.
Market Update: Key Economic Indicators and Early Closures
This Wednesday, investors should pay close attention to the following economic releases:
- 8:30 AM ET: Initial Jobless Claims report, adjusted for the holiday schedule.
- 8:30 AM ET: Advance Durable Goods Orders and the Philly Fed Non-Manufacturing Survey will also be released.
- 11:30 AM ET: Weekly Economic Index will provide additional insights into economic trends.
Please note that equity markets will close early at 1:00 PM ET, while bond markets are set for an even earlier close at 2:00 PM ET.
In noteworthy news from the energy sector, the EIA Weekly Petroleum Status Report will not follow its regular schedule this week. The next anticipated release is slated for December 29, 2025.
Overnight Forecast into the NY Session
Base Case Scenario:
Expect a period of consolidation overnight, with prices likely fluctuating within the range of 6948 to 6964. The key moment will come during the 8:30 AM ET data announcement, which should provide a clearer directional bias. If the support level at 6948-6938 holds through this data window, we anticipate another attempt to test the resistance levels at 6963.75 and 6968.75. However, a failure to surpass 6968.75 typically leads to a retraction back towards the 6947-6943 region, with a potential dip to 6938.
Upside Potential:
A decisive push above 6968.75, particularly if it sustains on a pullback rather than merely wicking through, could pave the way for movement toward the 6985-7000 range. Given that tomorrow marks a shortened trading session, these higher targets may be more suitable for “runner” strategies unless we see significantly robust momentum.
Downside Risk:
Conversely, if the 6938.50 level gives way and fails to rebound swiftly, the market is likely to rotate towards the 6919-6913 zone. This area represents the initial support level where buyers may have a viable opportunity to regain control.
A++ Setup 1 - Short rejection from the top
Entry: 6962.50-6966.00 (only after a test into 6963.50-6968.75 fails and price closes back below 6963.75)
Stop: 6974.25
TP1: 6943.50
TP2: 6938.50
TP3: 6919.25-6918.75
A++ Setup 2 - Long breakout and hold
Entry: 6970.50-6972.25 (only after a 15m close above 6968.75, then a pullback that holds above 6963.75)
Stop: 6961.75
TP1: 6998.75-7000.00
TP2: 7012.50
TP3: 7036.75-7040.00
If you enjoy our analysis, please consider boosting and sharing our post.
Good Luck !!!

Why is gold fluctuating in futures towards the target of 5120?Since 1975, with the increasing decline in the value of the world's most worthless currency, the dollar, all holders of this worthless fiat have been facing losses day by day against a valuable peak in physical assets!
Currently, the dollar is proud to be at the peak of worthlessness with rulers with a brilliant record of abusing children and girls at a very young age, even less than 5 years old, for sexual slavery, and every day, the yellow pumpkin head with a flat stomach the color of its own impurity, with a speechless tongue, is showing the consequences of accompanying these impurities and its fellow cups.
What makes us think is at what moment in history this swamp will drown all its companions forever. With the hope that this will happen soon!!
Good luck

ES (SPX, SPY) Analysis, Levels, Setup for Tue (Dec 23rd)MARKET OVERVIEW: Key Highlights of the Day
Investor sentiment remained resilient as equity markets advanced ahead of a holiday-shortened trading week, with large-cap technology and AI-related stocks driving the momentum. This robust performance sets a positive tone as we approach year-end. Notably, hard assets, particularly gold and silver, displayed continued strength, indicating that investors are still seeking hedges amid a rising equity environment. Meanwhile, oil prices remain sensitive to geopolitical developments. Interest rates held steady without causing significant disruptions.
For the E-mini S&P 500 (ES), the overarching trend remains upward; however, the holiday trading environment can lead to choppy price movements. Currently, the ES is testing the upper boundary of its range, making this nearby resistance level a critical point to watch as we progress into overnight trading and the New York session.
Nvidia's stock rose over 1% following a Reuters report indicating that the company plans to start shipping its H200 chips to China by mid-February. Micron Technology experienced a surge of approximately 4%, while Oracle's shares climbed more than 3%. This movement underscores Nvidia’s profound impact, as it now makes up a remarkable 8% of the S&P 500, marking the highest concentration for a single stock in over fifty years. Institutional investment flows continue to be fueled by ongoing developments in AI infrastructure.
The Federal Reserve concluded its December meeting with a 25 basis point reduction in the federal funds rate, adjusting it to a range of 3.50% to 3.75%. This marks the third consecutive rate cut, bringing rates to their lowest since November 2022. Notably, the committee exhibited a divide, with three members dissenting against the cut, reflecting the most disagreement since September 2019. The updated "dot plot" suggests only one additional 25 basis point cut in 2026, followed by another in 2027.
Equity markets have successfully recovered their December losses, positioning the S&P 500 for what could be its eighth consecutive month of gains, the longest winning streak since 2018. On Monday, nearly 400 stocks within the index posted gains as it approached record highs. Historically, the so-called Santa Claus rally has yielded positive results about 80% of the time, averaging a gain of 1.6% since 1928.
TOMORROW - EVENTS TO RESPECT (ET)
08:30 - GDP (Q3 estimate) + Corporate Profits
08:30 - Durable Goods (advance report)
10:00 - Consumer Confidence
10:00 - New Home Sales
16:30 - API crude oil inventory
Liquidity note: shortened week continues - moves can be sharp, then stall quickly.
NY PATH MAP: Overnight Analysis
The market is expected to navigate a range between 6908.50 and 6948.25. Notably, the “gravity pocket” is identified around the 6929.75 to 6925.75 range. Maintaining a position above 6920.50 is crucial for sustaining a bullish outlook. However, a decisive move between 6936.25 and 6948.25 would likely pave the way toward a target of 6983.00.
Bullish Scenario: For a bullish trajectory, it is imperative for the market to defend the 6920.50 level during the Asian and London trading sessions. A successful reclaim and sustain above 6948.25 in New York would open possibilities for a push towards 6983.00, with 7000.00 serving as an upper stretch target.
Bearish Scenario: On the downside, a rejection within the 6936.25 to 6948.25 range, coupled with a drop below 6908.50, would shift the odds in favor of a move towards 6891.00 to 6887.00. Continued selling pressure could then target levels between 6846.00 and 6840.00.
A++ SETUPS (Level-KZ 15/5/1 execution, two plays only)
A++ SETUP 1 - LONG - Break and hold above R1 (pop-and-go)
15m trigger: full body close above 6948.25
5m confirm: pullback holds 6948.25 and re-closes back above it
1m entry: buy 6946.75 to 6948.25 on the first pullback after the hold is proven
Hard SL: 6935.75
TP1: 6983.00
TP2: 7000.00
TP3: 7070.00
A++ SETUP 2 - SHORT - Rejection from R1 (pop-and-fail)
15m trigger: push into 6936.25 to 6948.25, then 15m close back below 6936.25
5m confirm: re-test of 6933.50 to 6936.25 fails and 5m re-closes lower
1m entry: sell 6932.75 to 6934.25 on the first lower-high after the failure is proven
Hard SL: 6949.75
TP1: 6889.00 (middle of S1)
TP2: 6846.00
TP3: 6820.00
If you enjoy our analysis, please consider boosting and sharing our post.
Good Luck !!!

3-Decade Rate Milestone: How Markets Digest Policy ShocksA Central Bank Decision Decades in the Making
When a central bank moves interest rates to levels not seen in three decades, markets rarely respond in a linear or orderly fashion. Such decisions are not interpreted as isolated adjustments, but as structural signals that force participants to reassess positioning, risk, and longer-term assumptions.
The recent interest rate increase by the Bank of Japan marked exactly that kind of milestone. Beyond the numerical change itself, the decision carried symbolic weight: a clear departure from an era defined by extraordinary accommodation. Yet, rather than triggering a straightforward repricing, the immediate market response leaned heavily toward aggressive selling pressure in the Japanese Yen.
This disconnect between policy intent and market reaction highlights an important reality: markets do not simply react to decisions — they digest them. And digestion is often messy.
From Policy Shock to Positioning Shock
Major policy announcements tend to unfold in two phases. The first phase is informational, where the headline is absorbed. The second phase is positional, where traders and institutions adjust exposure based on how that information interacts with existing risk.
In this case, the rate hike represented a known risk event, but its implications were far from binary. Messaging around future policy paths, real-rate dynamics, and external yield differentials all contributed to uncertainty. That uncertainty translated into heavy participation on the sell side, not because the outcome was definitively bearish, but because positioning needed to be reset.
This is where flow-based tools become especially valuable. Price alone often obscures what is really happening beneath the surface.
Flow Exhaustion as an Analytical Framework
Flow exhaustion is not about calling tops or bottoms. It is about identifying moments when participation becomes unusually one-sided, increasing the probability that continuation becomes harder to sustain.
One easy way to observe this phenomenon is through Volume Delta, defined as the net difference between buying volume and selling volume over a given period. Volume Delta provides insight into how aggressively one side of the market is pressing its case.
Unlike traditional price-based indicators, Volume Delta focuses on effort rather than outcome. Price can move modestly while effort is extreme — and it is often in those situations where future responses become most interesting.
Bollinger Bands® on Volume Delta, Not Price
In this framework, Bollinger Bands® are applied not to price, but to Volume Delta itself. This distinction is critical.
Bollinger Bands® on price measure volatility relative to price behavior. Bollinger Bands® on Volume Delta measure participation extremes relative to historical flow behavior. When Volume Delta trades far beyond its lower band, it signals that selling pressure is not just dominant, but statistically stretched.
On the daily chart, Volume Delta recently moved well below its lower Bollinger Band®. This represents an exaggerated imbalance, suggesting that sellers were acting with urgency and intensity rarely sustained over extended periods.
Importantly, this does not imply that price must reverse. It simply indicates that the marginal impact of additional sellers may be diminishing.
What Extreme Selling Really Means
Extreme selling does not mean that buyers suddenly appear in force. It means that the market has already absorbed a significant amount of sell-side participation.
In practical terms, when Volume Delta reaches such depressed levels, one of two things tends to occur:
Selling slows, leading to consolidation or corrective movement.
Price seeks lower levels where new participants are willing to engage.
Which outcome unfolds depends heavily on structure — specifically, what lies beneath price.
The Support Landscape Below Price
A critical observation in the current structure is the absence of UFO support levels (UnFilled Orders) beneath current price levels. UFO supports represent areas where prior institutional participation was not fully satisfied, often acting as structural reference points.
Without meaningful UFOs below, the market cannot rely on obvious liquidity-backed demand. Instead, attention shifts to historical technical supports derived from prior pivot lows.
Two such levels stand out:
0.0063330
0.0062415
These levels represent areas where price previously found acceptance.
Reaction Zones, Not Assumptions
At this stage, the distinction between anticipation and reaction becomes essential. Extreme Volume Delta does not justify preemptive positioning. Instead, it highlights zones where observation becomes critical.
At each technical support, traders may evaluate:
Whether selling pressure visibly decelerates
Whether price stabilizes despite continued effort
Whether daily closes show acceptance or rejection
The first support may hold. It may also fail. The absence of structural UFO support means the market retains flexibility, and traders must adapt accordingly.
Overhead Structure: Supply Still Matters
While attention often gravitates toward potential downside exhaustion, it is equally important to recognize what exists above price.
A relevant sell-side UFO resistance is located near 0.0065640. This zone represents UnFilled Sell orders and remains structurally intact.
Should price respond positively from lower levels, this area becomes a natural reference point where supply could reassert itself. In downtrending environments, rebounds frequently encounter resistance before any broader shift occurs.
This reinforces the importance of framing any upside move as corrective unless proven otherwise by structure.
Hypothetical Trade Framework (Illustrative Case Study)
To translate these observations into a practical framework, consider a purely illustrative example.
A hypothetical long-side case study could involve:
Monitoring price behavior at either technical support level
Waiting for evidence of stabilization or responsive buying
Using the support zone as a contextual risk reference
Defining invalidation below the chosen support
Referencing the overhead UFO resistance as a potential objective (target)
The reward-to-risk profile in such a framework depends entirely on execution and confirmation. This example is presented solely to demonstrate how flow exhaustion and structure may be combined.
Contract Specifications
This analysis references both standard and micro futures contracts to illustrate scalability and risk calibration.
Japanese Yen Futures (6J):
Tick size: 0.0000005
Tick value: $6.25
Currently ~$2,800 per contract
Micro JPY/USD Futures (MJY):
Tick size: 0.000001
Tick value: $1.25
Currently ~$280 per contract
Margin requirements vary by market conditions and broker policies. Micro contracts can be particularly useful in environments where volatility expands following macro events.
Risk Management Considerations
Policy-driven markets tend to remain unstable longer than expected. Even when selling pressure appears exhausted, uncertainty persists.
Key risk management principles include:
Defining risk before engagement
Adjusting size to reflect volatility
Avoiding emotional responses to extreme indicators
Accepting that not all exhaustion leads to reversals
Structure, not conviction, should guide decision-making.
How Markets Digest Policy Shocks
Major policy milestones do not resolve narratives — they reshape them. Flow extremes reveal stress points in positioning, not certainty in direction.
In the aftermath of a 3-decade rate milestone, the market enters a digestion phase. Volume Delta extremes suggest that selling pressure has been intense, but structure determines how that pressure resolves.
Patience, observation, and disciplined reaction remain the most reliable tools when markets recalibrate after historic decisions.
Data Consideration
When charting futures, the data provided could be delayed. Traders working with the ticker symbols discussed in this idea may prefer to use CME Group real-time data plan on TradingView: www.tradingview.com - This consideration is particularly important for shorter-term traders, whereas it may be less critical for those focused on longer-term trading strategies.
General Disclaimer
The trade ideas presented herein are solely for illustrative purposes forming a part of a case study intended to demonstrate key principles in risk management within the context of the specific market scenarios discussed. These ideas are not to be interpreted as investment recommendations or financial advice. They do not endorse or promote any specific trading strategies, financial products, or services. The information provided is based on data believed to be reliable; however, its accuracy or completeness cannot be guaranteed. Trading in financial markets involves risks, including the potential loss of principal. Each individual should conduct their own research and consult with professional financial advisors before making any investment decisions. The author or publisher of this content bears no responsibility for any actions taken based on the information provided or for any resultant financial or other losses.

ES (SPX, SPY) Week-ahead Analysis (Dec 22-26)This week is notably shortened due to the holiday, resulting in thinner liquidity and heightened volatility. Market participants should prepare for an early close on Wednesday, December 24, with the markets remaining shut on Thursday, December 25. Normal trading hours will resume on Friday, December 26.
Investors should approach breakouts with caution, demanding clearer confirmations at critical levels and exercising stricter time stops.
Multi-Timeframe Analysis (ES)
Weekly Overview:
The broader trend remains upward, suggesting that the larger swing is constructive; however, prices are testing a weekly supply cap near recent highs, entering a premium zone. Momentum has tempered from previous peaks, raising the risk of a "grind and fade" scenario rather than a straightforward continuation.
The market is currently experiencing a rebound leg, yet it is now hitting a daily supply band overhead, where previous selling pressure originated. Upside potential is limited by the upper band near prior highs, while downside risk is anchored by the last swing base and value areas below.
The most recent movement displays an impulsive rally from a base, followed by a controlled pause - though it does not indicate a full reversal at this stage. As long as pullbacks remain above the recently established reclaim shelf (mid to high 6800s), current price action is indicative of "healthy digestion." A breach below this shelf could signal a deeper correction.
1-Hour Context (Intraday):
Prices are currently positioned in the upper range of the recent trading day, approaching key overhead levels. This presents a pivotal moment for either a breakout continuation or a potential failure.
Momentum/Oscillator Analysis (Weekly + Daily):
- Weekly Perspective: Momentum is currently in a neutral zone—not excessively overbought, yet not undervalued either - as it has eased from earlier peak levels.
- Daily Perspective: Momentum has improved off the lows and is showing upward curvature, indicating that dips are being supported; however, the presence of overhead supply may lead to rapid stalls in momentum.
The key trend delineation, or "line in the sand," for market observers currently stands at 6760.
For trading positions resting above this benchmark, any pullbacks can still be classified as "corrections within an overarching uptrend." This suggests that the bullish sentiment remains intact as long as the market holds above this critical threshold. Conversely, a decisive move below 6760 - particularly if there’s acceptance level would signal potential damage to the rebound narrative, indicating that the market is showcasing areas of diminished demand.
NQ Intraday Reference Map:
For the Nasdaq (NQ), immediate resistance is noted between 25600 and 25645, aligning with prior highs and current push zones, followed by further resistance at 25800 to 26000, which serves as the next magnet zone for traders.
On the support side, key levels to watch include 25592 to 25568, which represents a value shelf, descending to the levels of 25504, and further extending to 25393 to 25357, marking the prior day’s low pocket. Should the market breach these levels, the overnight low at 25210 will be significant in assessing downward momentum.
Volatility Metrics Overview
VIX Analysis
The VIX has been trading in the mid-teens recently, with a notable decline observed late last week, indicating a growing risk appetite among investors, albeit with a continued sensitivity to market headlines. FRED's latest reported close was at 16.87 on December 18. However, a subsequent market data feed indicated a significant drop on December 19, with a low/close around 14.91. The takeaway here is that a lower VIX tends to support dip-buying strategies; however, sudden spikes in the VIX during a holiday week often result in sharp mean-reversions.
Rates Volatility - MOVE Index
The MOVE index is currently sitting at approximately 59, indicating a low-to-moderate level of stress in the rates market. This suggests that there is no acute funding stress present, which typically supports equities by mitigating the risk of disorderly sell-offs.
Tail Risk Pricing - SKEW Index
The SKEW index remains elevated in the mid-150s range. This suggests that while the market is not experiencing daily panic, investors are willing to pay a premium for crash insurance, indicating a cautious approach to tail risks.
Options and Positioning
The put/call ratios indicate a measured market sentiment, with the total put/call ratio currently at approximately 0.88 (based on a 10-day moving average), suggesting a balanced approach rather than extreme fear. On a daily basis, the total put/call ratio hovers around 0.86, while the equity put/call ratio is more subdued at about 0.59.
From a qualitative perspective, the VIX trading in the mid-teens, coupled with stable put/call ratios, suggests that dealers are likely positioned closer to long gamma in this range, indicating potential for pinning and mean-reversion behavior unless an external macro catalyst disrupts the current balance. This observation, while not rooted in explicit positioning reports, draws from the context provided by volatility and options data.
Market Breadth and Internals
The NYSE breadth snapshot reveals a positive market internal dynamic, with 1,424 advancing issues versus 1,338 declining, yielding a net advance of 86. The McClellan Oscillator stands at approximately +12.8, indicating that market breadth is not experiencing significant deterioration. Current data suggests we are witnessing a “minor wobble/digestion” phase rather than a full-blown distribution cascade.
Credit and Funding Environment
In the realm of credit markets, US high yield option-adjusted spreads (OAS) are around 2.95%, indicating a tight and orderly credit environment. The NAV of HYG is approximately 80.24, while JNK trades close to 96.82. These observations suggest that the credit markets are not currently signaling a risk-off narrative. However, any rapid widening of spreads may be interpreted as an indicator of shifting sentiment toward a more cautious stance.
Sentiment and Crowd Positioning
The latest reading from the AAII survey reflects a balanced sentiment landscape, with about 44% bullish, 23% neutral, and 33% bearish positions. This lack of overwhelming fear suggests reduced potential for a sustained market squeeze driven solely by under-positioning, unless the price action returns decisively above previous highs.
Cross-Asset and Global Risk Tone
In the cryptocurrency markets, Bitcoin is trading around $88,600, while Ethereum is near $3,000. This firmness in crypto typically aligns with a risk-on sentiment but may also serve as a precursor to heightened volatility should macro developments arise.
Lastly, recent trading has showcased strength in the Nasdaq and tech sectors. Should the Nasdaq (NQ) begin to underperform relative to the S&P 500 (ES) at these elevated levels, it may serve as an early warning signal for a potential fade in risk appetite.
MACRO AND DATA-CALENDAR (EVENT RISK)
Key US Economic Releases This Week (ET)
Monday, December 22
No significant economic data scheduled for release.
Tuesday, December 23
- 8:30 AM: Q3 GDP (delayed due to government shutdown)
- 8:30 AM: Durable Goods Orders (also delayed)
- 10:00 AM: Conference Board Consumer Confidence
Wednesday, December 24** *(Early market close at 1:00 PM ET)
- 8:30 AM: Weekly Jobless Claims
Thursday, December 25
Markets will be closed in observance of Christmas.
Friday, December 26
Markets will reopen with normal hours; however, no notable economic data is scheduled for release.
Event Impact Analysis:
- GDP and Durable Goods: Historically, these releases can lead to rapid volatility spikes, potentially mean-reverting if prices remain confined within established ranges. A breakout, however, could serve as fuel for further trends, particularly if it breaks through resistance levels R2/R3 or support levels S3/S4.
Good Luck !!!
- **Consumer Confidence:** This indicator typically influences equity markets based on growth expectations. A key point of analysis will be the NASDAQ index's reaction, which can provide a clearer picture of risk-on sentiment.
- **Jobless Claims on Early-Close Day:** Expect an increase in volatility, as lower liquidity may lead to exaggerated initial moves, potentially setting traps for traders.
As always, we advise close monitoring of these releases for potential market implications and trends.

NQ Update 24,816 - Funded Future's TraderMy target for EOD tomorrow. Obviously through future's you have the ability to follow these through options a bit better.
100% On all future callouts and option callouts. I stream live on YT everyday.
Ask about the indicator it's free.

SR3 (SOFR 3 Month) Finds Balance After a Multi-Year DowntrendBackground: What is SR3 and what drives it?
SR3 refers to the three month SOFR futures contract. SOFR, or the Secured Overnight Financing Rate, represents the cost of overnight borrowing collateralized by US Treasuries. The three month SOFR future prices in the market’s expectation of average SOFR over a future three month period, making it one of the cleanest instruments for expressing interest rate expectations tied to Federal Reserve policy.
This instrument is primarily used by institutions to hedge short term interest rate exposure and to speculate on the future path of monetary policy. Because of this, SR3 is highly sensitive to macro data, Federal Reserve communication, inflation prints, labor market data, and shifts in risk sentiment. When markets expect easing, SR3 prices tend to rise. When expectations move toward higher for longer policy, prices tend to fall.
Since 2022, the dominant narrative has been centered around aggressive tightening followed by a prolonged restrictive stance. That narrative has kept SR3 in a broader downtrend. More recently, sentiment has shifted toward patience and data dependence rather than urgency in either direction. This has resulted in compression, balance, and range trade as participants wait for clarity on the next policy inflection.
What the Market Has Done
• The market has been in a downtrend since 2022 but has found a base with strong responsive selling at 96.575 and responsive buying at 96.325. This has formed a defined daily range that has contained price since June.
• From August to October, the market traded in a two way rotation with higher highs and higher lows. Buyers stepped up bids and were able to push price marginally higher, but each test of the 96.58 area was met with responsive selling that capped continuation.
• Toward the end of October, buyers failed to defend the higher lows. Price rotated back down into bid block one in the 96.42 to 96.37 area, where buyers successfully held price through mid November, establishing what is now bid block two.
• Sellers gained slight control as they were able to offer prices back down toward the lower end of the range near 96.325.
• The market performed a liquidity check below this level, but responsive buyers quickly stepped in and bid price back up through the daily range.
• Price is currently repairing the October 29 single print and is now trading between the established offer block and bid block two.
What to Expect in the Coming Week
The key level to watch remains 96.52, which sits near the upper portion of the current balance area and acts as a decision point.
Bullish scenario
• If the market is able to accept above the 96.52 area, continuation toward 96.575 becomes likely.
• A further extension toward 96.6125, which marks the October 17 high, is possible.
• Responsive selling is expected in this region.
• Failure to sustain trade above these levels would likely result in rotation back down into the range.
Neutral scenario
• In the absence of a meaningful news catalyst, a two way auction remains the highest probability outcome.
• Price could continue rotating between the offer block and bid block one.
• This rotation would serve to further repair the October 29 single print and the associated low volume area.
Bearish scenario
• If 96.435, which marks the high of bid block two, fails to hold, expect a sweep through bid block two.
• This would open the door for a revisit of the lower range boundary near 96.32.
• Responsive buyers are expected to defend this area based on prior behavior.
Conclusion
SR3 appears to have found a base and shifted from a structural downtrend into a period of sideways accumulation. Price has settled into a well defined range as market participants balance expectations around monetary policy and incoming data. Recent Federal Reserve commentary supports this shift in sentiment. The Fed has delivered multiple rate cuts this year and appears cautious about future moves, signaling a more data dependent approach and a potential pause after the most recent easing cycle, which aligns with range trade rather than directional conviction. Markets are pricing in additional easing but Fed officials have shown clear disagreement on the timing and pace of future cuts, which has dampened strong trend conviction and encouraged balancing action in rate sensitive instruments like SR3. Some officials have publicly indicated that further rate cuts could be warranted if economic conditions soften, while others have urged caution, emphasizing the need for clearer labor market and inflation signals before making additional adjustments. This split messaging has contributed to a neutral market structure where price oscillates within value rather than trending strongly higher or lower.
Interested in how others are mapping Fed communication and data dependency onto this range, and what catalysts you see as capable of breaking this structure. Please drop a comment and give a boost so that more from the community can join in the conversation. Thank you.
Disclaimer: This is not financial advice. Analysis is for educational purposes only; trade your own plan and manage risk.

NQ; Continuation to lower demand? 📈 Hey Traders!
Here’s a fresh outlook from my trading desk. If you’ve been following me for a while, you already know my approach:
🧩 I trade Supply & Demand zones using Heikin Ashi chart on the 4H timeframe.
🧠 I keep it mechanical and clean — no messy charts, no guessing games.
❌ No trendlines, no fixed sessions, no patterns, no indicator overload.
❌ No overanalyzing the market; use only two time frames.
❌ No scalping, and no need to be glued to the screen.
✅ I trade exclusively with limit orders, so it’s more of a set-and-forget style.
✅ This means more freedom, less screen time, and a focus on quality setups.
✅ Just a simplified, structured plan and a calm mindset.
💬 Let’s Talk:
💡Do you trade supply & demand too ?
💡What’s your go-to timeframe ?
💡Ever tried Heikin Ashi ?
📩 Got questions about my strategy or setup? Drop them below — ask me anything, I’m here to share.
Let’s grow together and keep it simple. 👊

Gold Futures (GC) Technical Analysis at Key ResistanceGold futures are approaching a major higher-timeframe resistance between 4,414.4 and 4,399.4. This analysis focuses on price behaviour, volume reaction, and institutional participation rather than prediction. No trade is taken until price reaches the zone and confirms intent through volume and structure.

ES (SPX, SPY) Analysis, Key Levels, Setups for Thu (Dec 18)TOMORROW EVENT STACK (ET)
07:00 - Bank of England rate decision + statement
04:00 - Norges Bank rate decision (Norway)
08:15 - ECB policy statement release
08:30 - CPI (Nov) + Real Earnings (Nov)
08:30 - Initial Jobless Claims
08:30 - Philly Fed Manufacturing (Dec)
08:30 - ECB press conference begins (adds FX noise, CPI still dominates ES)
High-impact window: The peak whip risk occurs from 08:30 to 08:45 ET. After the market opens at 09:30, it often either continues the 08:30 trend or reverses back to fair value.
October CPI Release and Its Implications
The absence of the October CPI data from the Bureau of Labor Statistics (BLS) introduces significant complexity to the upcoming November CPI release. Notably, the November figures will omit certain one-month percent changes due to the missing October data. This gap is likely to lead to increased volatility in market reactions, as traders may rely more heavily on year-over-year comparisons and overarching narratives. It's important to emphasize that this presents a data-quality risk rather than a straightforward price forecast.
Current projections from Reuters indicate a CPI rise of 0.3% month-over-month, with a year-over-year increase of 3.1%. Additionally, core CPI is expected to mirror this 0.3% monthly change, while the year-over-year core figure is anticipated to remain at 3.0%. These benchmarks represent the market's baseline, and any significant deviation—either a miss or beat—could trigger a pronounced market reaction.
Navigating Market Dynamics: A Practical Guide for E-mini S&P Traders
- Hot Scenario: A core CPI increase of 0.4% or more, or any unexpected data that raises inflation concerns, is likely to drive yields upward. In this case, E-mini S&P futures may see selling pressure on initial rebounds, as traders react to renewed inflation fears and test support levels.
- Cool Scenario: Conversely, if the core CPI prints at 0.2% or below, or if there’s a clear downside surprise against expectations, we might witness a drop in yields. This scenario could facilitate a breakout for E-mini S&P futures, allowing for upward progression through resistance levels as shorts are squeezed.
- In-Line Scenario: The market may react chaotically to the initial news, but typically, direction stabilizes upon the first pullback following the 09:30 cash market open.
To ensure effective trading during the CPI release, adhere to the following guidelines:
1. Avoid initiating new positions in the final 60 seconds leading up to the 08:30 release.
2. Establish four key reference points: the high and low of the pre-CPI trading range (08:20-08:29) and the high and low resulting from the CPI spike (08:30-08:33). These levels frequently serve as pivotal points for price action during the first 30 to 90 minutes of trading post-release.
By keeping these dynamics in mind, traders can better navigate the potentially tumultuous waters of the upcoming CPI announcement.
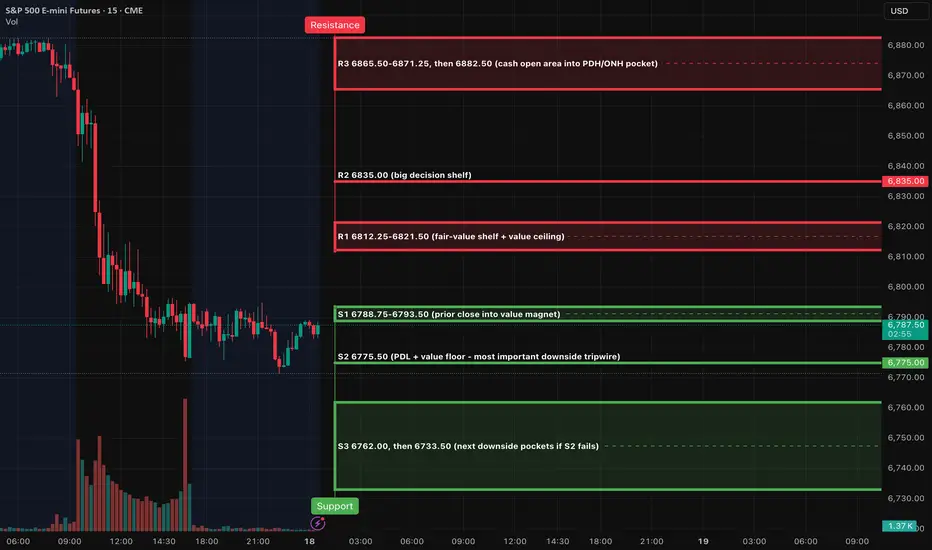
Market Analysis: Short-Term Outlook
In the broader context, the recent trading action suggests a failure to maintain momentum after reaching the upper resistance band. The most recent price structure indicates a downward trend, with the market currently trading below key resistance levels. For upcoming sessions, this is critical; any attempts at upward movement will need to overcome the 6821-6835 range to signify a genuine reversal rather than mere corrective action.
On the 4-hour timeframe, we observe a distinct sell-off followed by a consolidation phase. There are several resistance zones left untested from the recent decline, which could hinder any potential rallies. The immediate resistance is located between 6812 and 6821, with a higher barrier at 6835. Should the price exceed 6835, it might have the potential to rally toward the 6865-6882 range.
The 1-hour perspective reveals a classic pattern characterized by a sharp decline followed by a basing phase. Notably, trading volume surged during the sell-off before tapering as prices stabilized near the close. This dynamic sets the stage for either a rebound toward immediate resistance levels or a further decline if the established support fails.
The oscillator is currently in a deeply oversold position, registering in the low teens and beginning to show signs of a potential upward turn. This development suggests some bounce potential, although it does not guarantee a trend reversal on its own. A credible shift in trend will require the price to reclaim the R1 resistance and maintain levels above R2.
Overnight Market Outlook: NY Session Forecast
Base Case Scenario (Pre-CPI): Anticipate a period of rotational trading between support level S2 at 6775.50 and resistance range R1 at 6812-6821.
Bullish Scenario: Should the market hold at S2, a reclaim of R1 would be crucial. A successful transition of R2 (6835) from a resistance level to a support floor could propel prices toward R3 (6865-6871), with the potential to reach 6882.50 if bullish momentum remains strong.
Bearish Scenario: Conversely, if the market slips below S2 and fails to reclaim the 6775.50 level, we could see a decline towards S3 at 6762, with a further slide to 6733.50 if selling pressure intensifies.
A++ Setup 1 - Short Position (Rejection at Resistance Level 1)
Entry Criteria: Monitor the market for a minimum of 30 minutes. The ideal entry is between 6816.00 and 6821.00.
- Stop Loss (SL): 6838.00
- Take Profit (TP) Targets:
- TP1: 6775.50
- TP2: 6762.00
- TP3: 6733.50
**Invalidation Point:** The setup will be invalidated if price sustains above 6835.00.
A++ Setup 2 - Long Position (Continuation through Resistance Level 2)
Entry Criteria: Again, monitor for a duration of at least 30 minutes. The target entry range is between 6830.00 and 6836.00.
- Stop Loss (SL): 6818.50
- Take Profit (TP) Targets:
- TP1: 6871.25
- TP2: 6882.50
- TP3: 6936.25
Invalidation Point: The trade will be considered invalid if there is a decisive drop back below 6821.50 after the reclaim action.
Good Luck !!!
How to Trade Breakouts in TradingViewBreakout trading is a strategy that aims to capture strong price movements when markets break through key support or resistance levels, often signaling the start of a new trend or continuation move.
What You'll Learn:
Understanding breakouts as price movements beyond established support or resistance levels
How breakouts can occur at horizontal levels, trendlines, or chart patterns like triangles, rectangles, and flags
Why consolidation patterns often precede strong breakout moves
Recognizing the difference between false breakouts and confirmed breakouts
How to use candle closes beyond key levels as confirmation rather than relying on quick spikes
The critical role of volume in validating breakouts and separating real moves from fakeouts
Why expanding ATR during a breakout confirms increasing volatility and momentum
Understanding the break and close entry method for conservative breakout trades
How to scale into positions by entering partially on the break and adding on continuation
Using the pullback entry strategy to trade retests of broken levels as new support or resistance
Setting stop losses using ATR-based methods or placing them beyond consolidation patterns
Calculating profit targets with measured move techniques by projecting pattern heights
How to mark key levels in TradingView using the horizontal line tool from the left toolbar
Drawing trendlines and connecting swing points for pattern recognition
Accessing built-in pattern recognition tools through the Indicators menu
Practical examples using futures charts across multiple timeframes
This tutorial is designed for futures traders, day traders, and swing traders who want to capitalize on momentum moves and volatility expansion using technical breakout strategies.
The methods discussed may help you identify high-probability breakout setups, manage entries with proper confirmation, and set risk-appropriate stops and targets across multiple markets and timeframes.
Learn more about futures trading with TradingView: optimusfutures.com
Disclaimer
There is a substantial risk of loss in futures trading. Past performance is not indicative of future results. Please trade only with risk capital. We are not responsible for any third-party links, comments, or content shared on TradingView. Any opinions, links, or messages posted by users on TradingView do not represent our views or recommendations. Please exercise your own judgment and due diligence when engaging with any external content or user commentary.
This video represents the opinion of Optimus Futures and is intended for educational purposes only. Chart interpretations are presented solely to illustrate objective technical concepts and should not be viewed as predictive of future market behavior. In our opinion, charts are analytical tools, not forecasting instruments.

SignalViper Suite — Quick Scalp on Gold FuturesSignalViper Suite — Quick Scalp on Gold Futures (GC)
3-minute trade.
$1,200 profit.
Here's the setup:
RECON showed full alignment:
• Coil: CLEAR — no chop
• Strike: LONG confirmed
• Rush: Momentum RISING
• MTF: All timeframes bullish
• Fangs: Near key S/R levels
The missing piece? Venom was showing CONTESTED — buyers and sellers fighting for control.
I waited.
Next bar, Venom flipped to BUYERS.
That was my trigger. Entry: 4370.80 Exit: 4372.00 Duration: 3 minutes
Result: +1.20 pts on my Apex Trader Fund account. No guessing. No FOMO. Just waited for all 8 indicators to align, then executed. That's what confluence looks like.
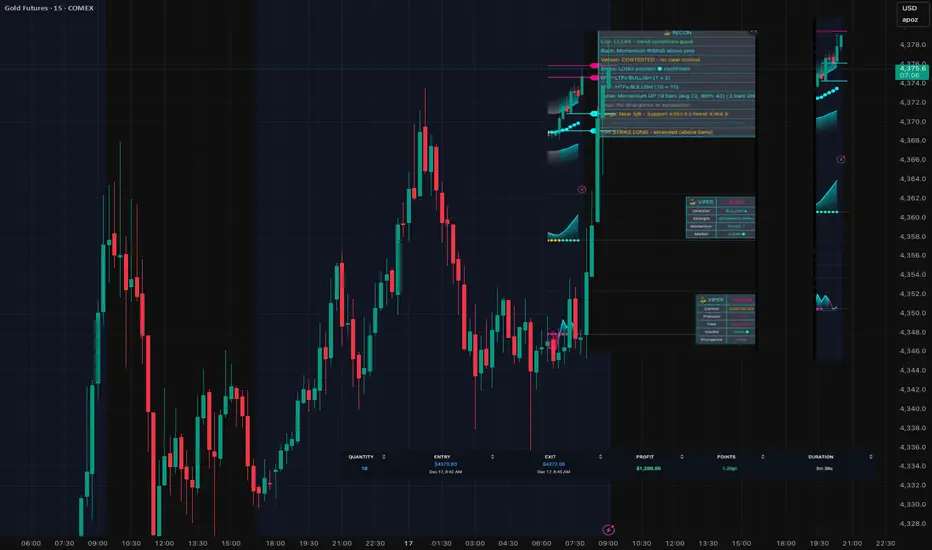
When Price Gets Ahead of ItselfMarkets love drama.
Price breaks out, momentum accelerates, and suddenly everything feels obvious. Charts look clean, conviction is high, and everyone agrees — this thing is strong.
But here’s the catch: strong doesn’t always mean sustainable.
When price moves too far too fast, it stretches liquidity, pulls in late participants, and often leaves structure behind. That’s when volatility expands, Bollinger Bands® get left in the dust, and the market quietly becomes fragile.
This is where mean reversion sneaks into the conversation — not as a call for collapse, but as a reminder that markets like balance. Extremes attract attention, and attention attracts counter-flow.
Add in order-flow context — like UnFilled Orders (UFOs) lining up near pattern objectives — and suddenly those “obvious” moves don’t look quite as comfortable anymore.
Mean reversion trades aren’t about being right.
They’re about managing risk when price runs ahead of itself.
Because in trading, the real edge isn’t momentum.
It’s knowing when momentum starts to wobble.
Know your specs…
Standard Futures Contract (6E)
Minimum price fluctuation (tick): 0.000050 per Euro increment = $6.25
Typical margin characteristics: ~$2,700 per contract
Micro Futures Contract (M6E)
Minimum price fluctuation (tick): 0.0001 per euro = $1.25
Typical margin characteristics: ~$270 per contract
Want More Depth?
If you’d like to go deeper into the building blocks of trading, check out our From Mystery to Mastery trilogy, three cornerstone articles that complement this one:
🔗 From Mystery to Mastery: Trading Essentials
🔗 From Mystery to Mastery: Futures Explained
🔗 From Mystery to Mastery: Options Explained
When charting futures, the data provided could be delayed. Traders working with the ticker symbols discussed in this idea may prefer to use CME Group real-time data plan on TradingView: www.tradingview.com - This consideration is particularly important for shorter-term traders, whereas it may be less critical for those focused on longer-term trading strategies.
General Disclaimer:
The trade ideas presented herein are solely for illustrative purposes forming a part of a case study intended to demonstrate key principles in risk management within the context of the specific market scenarios discussed. These ideas are not to be interpreted as investment recommendations or financial advice. They do not endorse or promote any specific trading strategies, financial products, or services. The information provided is based on data believed to be reliable; however, its accuracy or completeness cannot be guaranteed. Trading in financial markets involves risks, including the potential loss of principal. Each individual should conduct their own research and consult with professional financial advisors before making any investment decisions. The author or publisher of this content bears no responsibility for any actions taken based on the information provided or for any resultant financial or other losses.

ES (SPX, SPY) Analysis, Key Zones, Setups for Wed (Dec 17th)Market Update: ES Faces Critical Decision Point
The ES market is currently navigating a narrow “decision pocket” between 6850 and 6865, following a significant selloff and a subsequent bounce that has yet to establish a definitive trend. The situation is clear: buyers must defend the lower range of 6834 to 6817 to maintain market stability within this range. Conversely, sellers are focusing on the upper threshold between 6880 and 6892. With the Consumer Price Index report scheduled for release on Thursday morning, traders are likely to become more reactive, potentially taking profits swiftly and responding sensitively to any news regarding interest rates.
What can move ES tomorrow (high-impact catalysts, ET)
7:00 MBA Mortgage Applications - usually a modest mover, but it can nudge rates early.
8:15 Fed Governor Waller (Economic Outlook) - big rates sensitivity; ES can whip on any change in tone.
9:05 NY Fed President Williams - opening remarks at an NY Fed conference; still headline-capable.
10:30 EIA Weekly Petroleum Status Report - can move crude and inflation expectations, which can leak into ES.
11:00 Treasury buyback details (eligible bonds list) - rates pulse risk.
1:00 20Y Treasury auction (competitive bids) - one of the bigger intraday “rates steering wheel” moments.
1:40-2:00 Treasury buyback operation window - can add another yields swing in the early afternoon.
Macro and News Themes to Watch Ahead of Tomorrow’s Market
In the current environment, interest rates are proving to be the primary driver of market dynamics. Any increase in long-term yields exerts downward pressure on the equity markets, particularly when key indices like the S&P 500 are hovering near critical resistance levels.
The Federal Reserve's messaging remains notably inconsistent. While some officials are emphasizing the importance of maintaining inflation credibility and adopting a cautious stance towards future rate cuts, others suggest that monetary policy is already positioned effectively and anticipate a gradual cooling of inflation. This divergence creates a volatile atmosphere, leading to heightened market reactions surrounding Fed speeches.
On the geopolitical front, oil prices are responding to ongoing developments, particularly concerning Venezuela, which has raised supply-risk concerns. This uptick in crude prices has the potential to reinforce inflation narratives and influence equity market sentiment.
Additionally, the looming Bank of Japan (BOJ) meeting, where a rate hike is expected, adds another layer of complexity. Even ahead of this anticipated move, shifts in foreign exchange and global rates could significantly impact U.S. index futures and overall market positioning.
Overnight NY Market Forecast
Base Case Scenario: The market is expected to trade within a range of 6832.75 to 6880.50. Watch for potential retracements towards the 6849.00-6849.75 level, which appears to be a pivotal support point.
Bullish Scenario: Should the index manage to sustain a position above 6880.50, a decisive break above 6892.00 would likely drive prices towards 6936.25, a key resistance level.
Bearish Scenario: Conversely, a confirmed drop below 6817.50 would pave the way for a test of 6800.00 initially. If sellers maintain their grip on the market, further declines to 6767.75 and 6733.75 may follow.
A++ Setup 1 (Rejection Fade short from the upper shelf)
Entry: 6887.00-6891.75
Hard SL: 6896.25
TP1: 6863.50
TP2: 6849.75
TP3: 6834.50
A++ Setup 2 (Acceptance Continuation short under PDL)
Entry: 6814.50-6817.25
Hard SL: 6823.75
TP1: 6800.00
TP2: 6767.75
TP3: 6733.75
Good Luck !!!
