USDCHF REBOUND AHEAD|LONG|
✅USDCHF swept sell-side liquidity into a higher-timeframe demand zone, where displacement confirms bullish intent. Expect mitigation and consolidation above the demand before a push toward buy-side liquidity resting at the marked target area. Time Frame 2H.
LONG🚀
✅Like and subscribe to never miss a new idea!✅
#usdchf#forex

USD/CHF Trades Below Key Moving Averages Amid Bearish BiasThe chart for USD/CHF highlights a persistent bearish structure, with price action currently below both the 50-day (blue) and 200-day (red) moving averages. This alignment suggests a dominant downtrend, reinforced by the following observations:
Moving Averages: The 50-day MA remains well below the 200-day MA, confirming a long-term bearish crossover. Price trading beneath both averages adds weight to the downside bias.
MACD: The MACD histogram shows subdued momentum, and the signal lines are positioned below the zero line, indicating continued bearish pressure. However, the histogram narrowing hints at potential weakening of the current trend.
RSI: The RSI hovers near the midline, suggesting neutral momentum rather than oversold conditions. This could imply consolidation before the next directional move.
Key Levels:
Support: 0.87461
Resistance: 0.94600
The pair remains in a range but under structural bearish pressure. A sustained break below support could extend the downtrend, while a recovery above the 50-day MA would be an early sign of trend reversal.
-MW

USDCHF Remains Range-Bound as Momentum WeakensUSDCHF continues to oscillate within a clearly defined horizontal range that has contained price action since mid-summer. The pair is once again pressing into the lower portion of this consolidation zone, following a sharp downswing that reflects renewed bearish pressure within the structure.
The broader trend context remains downward, with price trading below both the 50-day SMA and the 200-day SMA. The 50-day average has acted as dynamic resistance through most of the range, and the 200-day SMA continues to slope lower, reinforcing the longer-term bearish bias even as price fluctuates sideways in the near term.
Momentum indicators align with this softness. The MACD hovers near the zero line, showing weak directional conviction and minimal trend acceleration. The RSI has slipped toward the lower half of its range, suggesting that downside momentum is increasing but not yet stretched into oversold territory. Combined, these readings imply a lack of upward momentum as the pair tests the lower boundary of its multi-month box.
Overall, USDCHF remains in a neutral-to-bearish posture while contained inside its established range. How the market responds around the lower edge of this structure may determine whether consolidation continues or broader trend forces reassert themselves.
-MW

Forex Trading USDCHF BASIC HH‑LL STRATEGY
1. IDENTIFY TREND – Look for a series of HIGHER HIGHS + HIGHER LOWS (up‑trend) or LOWER LOWS + LOWER HIGHS (down‑trend).
2. ENTRY – Enter long when price breaks above the latest HIGH in an up‑trend; enter short when price breaks below the latest LOW in a down‑trend.
3. STOP LOSS – Place it just below the most recent LOW (for longs) or above the most recent HIGH (for shorts).
4. TARGET – Measure the height of the previous swing and project that distance from the entry point, or use a trailing stop to lock profits as the trend continues.
⚠️ Disclaimer:
This setup is shared for educational purposes only. It is not financial advice. Always do your own analysis and apply proper risk management before trading any setup.

USD/CHF Consolidates Within Prolonged RangeUSD/CHF continues to trade within a well-defined horizontal range between approximately 0.7850 and 0.8100, showing limited directional momentum over recent months. The pair’s repeated rejections from both upper and lower boundaries highlight market indecision and equilibrium between buyers and sellers.
The 50-day simple moving average (SMA) near 0.7987 has acted as a median line within the range, while the 200-day SMA around 0.8218 remains well above current price, signaling that the broader trend bias is still neutral to slightly bearish. The MACD is marginally above the signal line, suggesting mild bullish momentum, though not yet sufficient to confirm a breakout. Meanwhile, the RSI hovers around 59, reflecting improving sentiment without reaching overbought conditions.
For now, USD/CHF remains confined within its established consolidation structure. A decisive close above 0.8100 would indicate a potential shift in momentum, while a move below 0.7850 would reaffirm range continuity or open the door to renewed weakness.
-MW

USDCHF WILL KEEP GROWING|LONG|
✅USDCHF taps the demand block and shows displacement, suggesting bullish order-flow returning after liquidity sweep beneath the short-term low. Expect a corrective pullback into the imbalance before targeting the higher buy-side liquidity. Time Frame 1H.
LONG🚀
✅Like and subscribe to never miss a new idea!✅

USDCHF FREE SIGANL|SHORT|
✅USDCHF taps the major supply block after a sharp rally, creating a premium shorting opportunity. A rejection from this imbalance zone may deliver a clean displacement toward downside objectives.
———————————
Entry: 0.80534
Stop Loss: 0.80760
Take Profit: 0.80210
Time Frame: 3H
———————————
SHORT🔥
✅Like and subscribe to never miss a new idea!✅

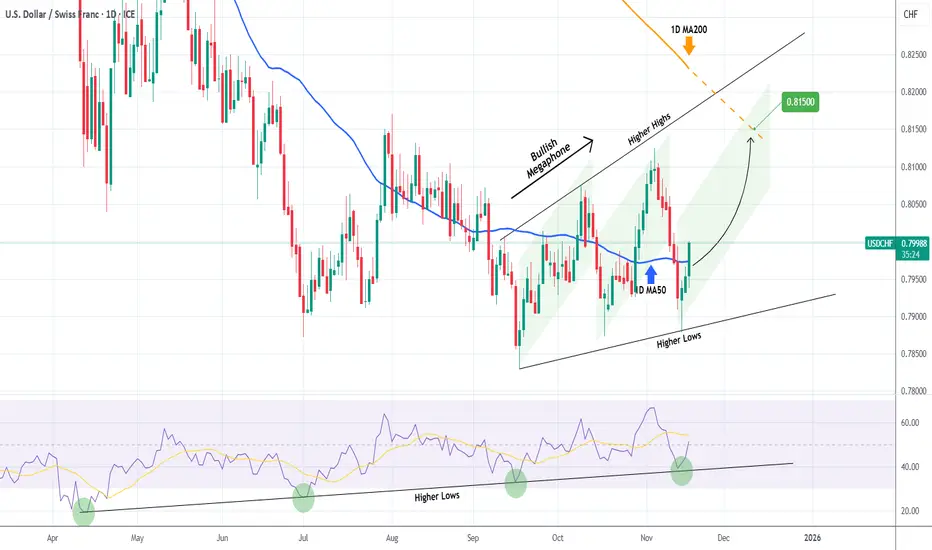
USDCHF Megaphone started its new Bullish Leg.The USDCHF pair has been trading within a 2-month Bullish Megaphone that was initiated after the huge 1D RSI Bullish Divergence of Higher Lows caused a market bottom in September and the price flipped the Lower Lows to Higher Lows and started rising.
Having broken above its 1D MA50 (blue trend-line) today, the new Bullish Leg has been confirmed and we expect it to make contact with the 1D MA200 (orange trend-line) around 0.81500.
---
** Please LIKE 👍, FOLLOW ✅, SHARE 🙌 and COMMENT ✍ if you enjoy this idea! Also share your ideas and charts in the comments section below! This is best way to keep it relevant, support us, keep the content here free and allow the idea to reach as many people as possible. **
---
💸💸💸💸💸💸
👇 👇 👇 👇 👇 👇
USD/CHF — Riding the Channel Back to CPrice tapped the lower boundary of the long-term ascending channel and reacted exactly where the structure needed it to. The corrective leg into B also mitigated a breaker block, which gives this rebound a stronger backbone.
If this bullish sequence plays out, the next draw sits at the projected C up near the channel’s upper rail. As long as the lower structure holds, the risk–reward on this idea stays clean and controlled.
Following the wave logic, I’m targeting that C extension while keeping risk tucked below the breaker and the channel low. Let’s see if the market respects this geometry.
This is not financial advice.

USD/CHF – Building the LaunchpadAfter a clean impulse higher, USD/CHF is dipping right into the zone where demand was born — the BC + WCL overlap , sitting on top of the daily imbalance .
This area (around 0.7975 ) feels like the kind of zone where price takes a breath before the next leg.
As long as 0.7923 holds, I’m hunting for longs toward 0.8270–0.8300 .
That’s the HTF target and the last unmitigated supply area above.
If the zone cracks, I’ll let it go — no need to fight the flow.
Solid structure, clean logic, fair R:R. Let’s see if the launchpad fires.
Disclaimer: This post is for educational purposes only and does not constitute financial advice.

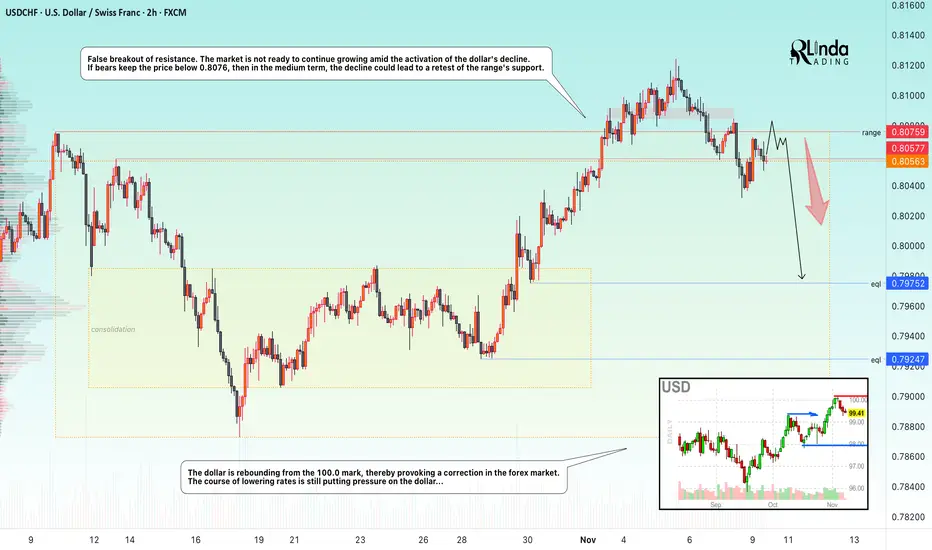
USDCHF → Manipulation? False breakout of resistance FX:USDCHF attempted to take advantage of the trend reversal opportunity after breaking out of a descending wedge, but the weak dollar hindered the rally...
The currency pair is facing resistance at 0.8076. There is no continuation of the momentum towards a breakout, and bearish pressure, which is intensifying as the dollar index declines, is negatively affecting the currency pair. The price has returned to the trading range, with an emphasis on 0.8057 - 0.8076. If the bears keep the price below this zone, this move could trigger further sell-offs.
Resistance levels: 0.8057, 0.8076
Support levels: 0.7957, 0.7925
The false breakout confirms that sellers currently have the upper hand and buyers lack the strength to push the price higher. Accordingly, consolidation below the key level could trigger a further decline towards the zone of interest at 0.7975.
Best regards, R. Linda!
USD-CHF Bullish Rebound! Buy!
Hello,Traders!
USDCHF is showing reaction off a key demand reaccumulation block after a strong displacement move, hinting at potential short-term retracement toward the inefficiency above. Time Frame 4H.
Buy!
Comment and subscribe to help us grow!
Check out other forecasts below too!
Disclosure: I am part of Trade Nation's Influencer program and receive a monthly fee for using their TradingView charts in my analysis.

USD-CHF Free Signal! Sell!
Hello,Traders!
USDCHF is retracing from a horizontal supply area after internal liquidity sweep. Smart money traders may look for a bearish continuation toward 0.8017 as liquidity below equal lows gets targeted.
---------------------
Stop Loss: 0.8077
Take Profit: 0.8017
Entry: 0.8048
Time Frame: 5H
---------------------
Sell!
Comment and subscribe to help us grow!
Check out other forecasts below too!
Disclosure: I am part of Trade Nation's Influencer program and receive a monthly fee for using their TradingView charts in my analysis.

USDCHF Perhaps the best buy opportunity in the market!The USDCHF pair is staging a strong bullish reversal following last week's 1W candle closing above the 1D MA100 (red trend-line). The reason is that every time in the past 3 years (since November 07 2022) the price broke and closed a week above that level, the pair rallied towards the 1W MA200 (orange trend-line).
This time is doing so also at the back of a huge 1W RSI Bullish Divergence of Higher Lows against the prices Lower Lows since April 2025.
We estimate that contact with the 1W MA200 can be achieved around $0.8800 and that is our long-term Target for USDCHF.
-------------------------------------------------------------------------------
** Please LIKE 👍, FOLLOW ✅, SHARE 🙌 and COMMENT ✍ if you enjoy this idea! Also share your ideas and charts in the comments section below! This is best way to keep it relevant, support us, keep the content here free and allow the idea to reach as many people as possible. **
-------------------------------------------------------------------------------
💸💸💸💸💸💸
👇 👇 👇 👇 👇 👇

USDCHF INVERTED H&S 📉 Technical Overview: Reversal Pattern and Key Level Break
The price action suggests the formation of a Head and Shoulders (H&S) reversal pattern. This pattern typically signals the end of a downtrend and the start of an uptrend.
Support/Neckline: The lower horizontal shaded area around the 0.7840 - 0.7900 zone represents a strong support level, which acted as the base for the Left Shoulder (L-Shoulder), Head, and Right Shoulder (R-Shoulder).
Head and Shoulders Confirmation: The pattern appears to be complete with the formation of the three distinct lows. The breakout above the descending dashed neckline confirms the bullish bias generated by the pattern.
Key Resistance Level: The upper horizontal shaded area around 0.8040 - 0.8100 represents a significant resistance zone. Price action has repeatedly stalled and consolidated around this area since July. The recent price movement has broken above this key resistance.
🚀 Projection
The current market dynamic suggests a bullish continuation, following the key level breakout and the H&S pattern completion:
Immediate Action (Possible Pullback): The chart highlights a scenario where the price may execute a "Possible Bounce back on Key Level." This means the price could retest the recently broken resistance area (0.8040 - 0.8100), which would now act as new support. This retest would be a classic bullish confirmation signal.
Longer-Term Projection (Target): Assuming the key level holds as support after a retest, the price is projected to continue its move higher. The target is based on measuring the height of the Head and Shoulders pattern and projecting it upwards from the breakout point. A conservative initial target based on the visual upward projection on the chart appears to be the 0.8250 - 0.8300 area, which aligns with previous price highs from around May/June 2025.
In summary, the technical structure is bullish, projecting further upside after a potential retest of the broken 0.8040 - 0.8100 resistance-turned-support zone.

USD-CHF Supply Level Above! Sell!
Hello,Traders!
USDCHF Price is approaching a horizontal supply area but hasn’t confirmed a retest yet. Smart money may seek liquidity sweep above before reacting lower toward the target zone. Time Frame 4H.
Sell!
Comment and subscribe to help us grow!
Check out other forecasts below too!
Disclosure: I am part of Trade Nation's Influencer program and receive a monthly fee for using their TradingView charts in my analysis.

USDCHF Huge Bullish Divergence like 2020.The USDCHF pair has recently broken above its 1D MA50 (red trend-line) for the first time since March 2025, following a long-term sharp decline. The multi-year pattern is a Channel Down and the current price action is taking place right on its bottom.
At the same time, while the price is on Lower Lows, the 1W RSI has been rising on Higher Lows, showcasing a huge Bullish Divergence. The last time we saw this happening at the bottom of this Channel Down, was between August - December 2020. That was the pattern's previous Lower Low bottom formation and after the 1D MA100 break-out took place, the pair started its new Bullish Leg that exceeded the 0.618 Fibonacci retracement level, while smashing through its 1W MA200 (orange trend-line).
As a result, we have turned bullish long-term on USDCHF, targeting the 0.618 Fib at 0.86750, expecting a contact with its 1W MA200 there.
-------------------------------------------------------------------------------
** Please LIKE 👍, FOLLOW ✅, SHARE 🙌 and COMMENT ✍ if you enjoy this idea! Also share your ideas and charts in the comments section below! This is best way to keep it relevant, support us, keep the content here free and allow the idea to reach as many people as possible. **
-------------------------------------------------------------------------------
💸💸💸💸💸💸
👇 👇 👇 👇 👇 👇

Frank: HTF has enough fuel to jump it up!Hello Traders,
As you might have seen the HTF zone was strong enough to rebounce the pair! Now we are waiting for more profits from the newly formed zones.

USDCHF Will Collapse! SELL!
My dear subscribers,
USDCHF looks like it will make a good move, and here are the details:
The market is trading on 0.7950 pivot level.
Bias - Bearish
My Stop Loss - 0.7959
Technical Indicators: Both Super Trend & Pivot HL indicate a highly probable Bearish continuation.
Target - 0.7934
About Used Indicators:
The average true range (ATR) plays an important role in 'Supertrend' as the indicator uses ATR to calculate its value. The ATR indicator signals the degree of price volatility.
Disclosure: I am part of Trade Nation's Influencer program and receive a monthly fee for using their TradingView charts in my analysis.
———————————
WISH YOU ALL LUCK

USDCHF: Momentum into NY SessionKey Observations
This pair is starting off slow, but I'm expecting momentum to pick up during the New York session.
The daily chart is indicating an overall downtrend. Price is holding below both EMAs. However, the price action is a little bit weaker and the daily HTL isn't a significant level.
On the H1 timeframe, price is showing overlapping bars. I am hoping to see a stronger break to the downside as price crosses out of the EMA brand and accelerates.

USDCHF FREE SIGNAL|SHORT|
✅USDCHF price is likely to retest the supply level on Monday before continuing its bearish leg. Liquidity above the short-term high has been taken, and the pair is expected to react from this imbalance zone toward the 0.7910 target area.
—————————
Entry: 0.7936
Stop Loss: 0.7952
Take Profit: 0.7910
Time Frame: 2H
—————————
SHORT🔥
✅Like and subscribe to never miss a new idea!✅

USD-CHF Local Short! Sell!
Hello,Traders!
USDCHF Price has already retested the horizontal supply area with a clear wick rejection, signaling strong bearish intent. Smart Money is likely distributing positions from this zone, aiming to drive price toward the liquidity resting near 0.7900. Time Frame 5H.
Sell!
Comment and subscribe to help us grow!
Check out other forecasts below too!
Disclosure: I am part of Trade Nation's Influencer program and receive a monthly fee for using their TradingView charts in my analysis.

USD-CHF Local Long! Buy!
Hello,Traders!
USDCHF is approaching a horizontal demand area, where Smart Money accumulation could trigger a bullish reversal. Expect price to tap into 0.8025$ liquidity before redistribution. Time Frame 2H.
Buy!
Comment and subscribe to help us grow!
Check out other forecasts below too!
Disclosure: I am part of Trade Nation's Influencer program and receive a monthly fee for using their TradingView charts in my analysis.
