0x 0.618 reversalA bullish rejection for 0x can be seen on the USD pair at the 0.618 Fibonacci level, this is promising On the BTC pair a double bottom can be seen within a sort of horizontal wedge structure Zby Bixley5
SUPPORT AND RESISTANCE DOESN’T EXISTWhat happens when a resistance is broken. THEY MAKE A NEW ONE. What happens when a support is broken... U guessed it 😂😂😂 THEY MAKE A NEW ONE TECHNICAL ANALYSIS DOES NOT WORK CHANGE MY MINDLongby bramuelle117
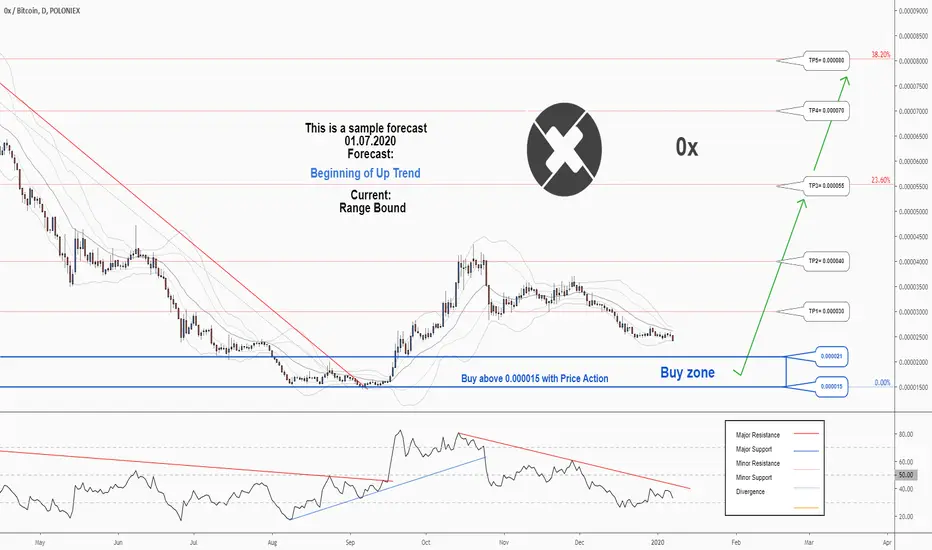
There is a possibility for the beginning of an uptrend in ZRXBTCTechnical analysis: . 0X/BITCOIN is in a range bound and the beginning of uptrend is expected. . The price is below the 21-Day WEMA which acts as a dynamic resistance. . The RSI is at 34. Trading suggestion: . There is a possibility of temporary retracement to suggested support zone (0.000021 to 0.000015). if so, traders can set orders based on Price Action and expect to reach short-term targets. Beginning of entry zone (0.000021) Ending of entry zone (0.000015) Entry signal: Signal to enter the market occurs when the price comes to " Buy zone " then forms one of the reversal patterns, whether " Bullish Engulfing ", " Hammer " or " Valley " in other words, NO entry signal when the price comes to the zone BUT after any of reversal patterns is formed in the zone. To learn more about " Entry signal " and the special version of our " Price Action " strategy FOLLOW our lessons : Take Profits: TP1= @ 0.000030 TP2= @ 0.000040 TP3= @ 0.000055 TP4= @ 0.000070 TP5= @ 0.000080 TP6= @ 0.000100 TP7= @ 0.000121 TP8= @ 0.000149 TP9= @ 0.000186 TP10= FreeZLongby ForecastCity2210
There is a possibility for the beginning of an uptrend in ZRXBTCTechnical analysis: . 0X/BITCOIN is in a range bound and the beginning of uptrend is expected. . The price is below the 21-Day WEMA which acts as a dynamic resistance. . The RSI is at 34. Trading suggestion: . There is a possibility of temporary retracement to suggested support zone (0.000021 to 0.000015). if so, traders can set orders based on Price Action and expect to reach short-term targets. Beginning of entry zone (0.000021) Ending of entry zone (0.000015) Entry signal: Signal to enter the market occurs when the price comes to " Buy zone " then forms one of the reversal patterns, whether " Bullish Engulfing ", " Hammer " or " Valley " in other words, NO entry signal when the price comes to the zone BUT after any of reversal patterns is formed in the zone. To learn more about " Entry signal " and the special version of our " Price Action " strategy FOLLOW our lessons : Take Profits: TP1= @ 0.000030 TP2= @ 0.000040 TP3= @ 0.000055 TP4= @ 0.000070 TP5= @ 0.000080 TP6= @ 0.000100 TP7= @ 0.000121 TP8= @ 0.000149 TP9= @ 0.000186 TP10= FreeZLongby ForecastCity2217
0x Inverted Descending Scallop11/56 success rate in a bull market.. Looks like an inverted J. Stochastic RSI can be seen to be overextended suggested a price reversal, MACD is also rising which looks promising. 4Hr chart.Zby Bixley8
Simple linear regression trading exampleIn the post I have outlined a simple method for trading using linear regression, note it is difficult to establish strong R values on many coins due to many's stagnant nature recently, this method is a very reliable way to make some mula. Give me feedback in the comments please, let me know if it was useful !ZEducationby Bixley8
0x LRegressionHaven't seen much movement from 0x as of late, linear regression showing a good setup.ZLongby Bixley8
ZRX LONG$ZRX Looking interesting again after breaking above the H&S it was forming, looking for +14%, stop beneath TL.ZLongby imBagsyUpdated 116
0x (ZRX) - 1:21++ Missed Trade :'( @coinselorThere are a lot of coins to keep track of and somehow I missed this one completely. I'm not going to enter right now because I really like that target and it wouldn't be worth it in terms of risk-reward vs holding time. Hope you were paying more attention than me. BINANCE:ZRXBTC Market Cap: $160,108,496 USD 18,689 BTCZby rolesnioc222
ZRX Thoughts$ZRX Making it's way to green support below (HVN) on the VPVR. Worst case we take out the liquidity at yellow X below.ZShortby imBagsy1
ZRXBTCTriangle formed More inclined to break up Risk profit 1 to 3 Enter: 3850 - 3880 Stop: 3675 Target: 4500ZLongby AvalontradingUpdated 10
ZRX OX Turning BullishWeekly indicators showing that ZRX could be at bottom, it can turn bullish at any time. Monthly Trend on Binance showing that it can go down a bit more but it worth a try. Buy now 6300-6400 but don't go full, keep juice for a rebuy in case of. Rebuy 5300 if it drops. Sell around 7900-8300 ( don't greedy ) Don't forget to keep an eye on BTC. Happy Tr4Ding ! ZLongby thecryerUpdated 1
Daily Bullish Signal $ZRX #ZRX (18 Feb 2019)RED ARROW indicates the EXPECTED Time and Targets Level Stoploss point up to maximize profit and reduce risk I'm working all the time, even in Bearish MarketZLongby CryptoStation4
Waiting on 0xAfter last week's rally... we are now waiting for confirmation break-out, but it seems like people are putting they money on the short side...Zby BillionG2
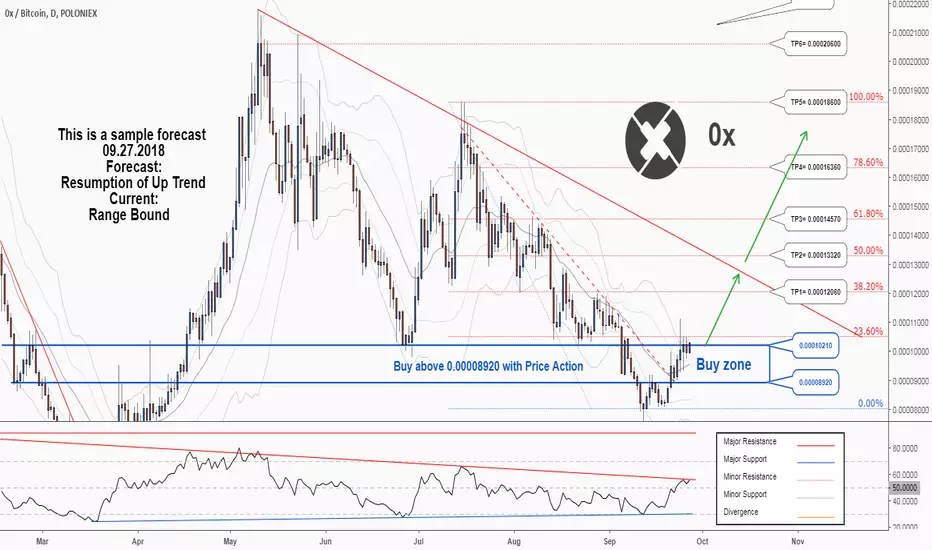
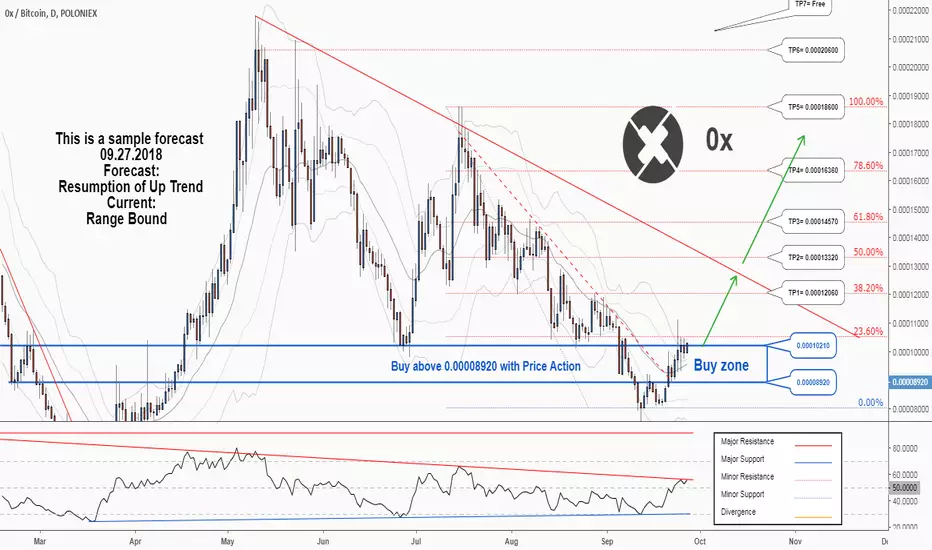
There is a possibility for the beginning of an uptrend in ZRXBTCTechnical analysis: . 0X/BITCOIN is in a range bound and the resumption of uptrend is expected. . The price is above the 21-Day WEMA which acts as a dynamic support. . The RSI is at 56. . While the RSI and the price downtrend in the Daily chart are not broken, bearish wave in price would continue . Trading suggestion: . There is a possibility of temporary retracement to suggested support zone (0.00010210 to 0.00008920). if so, traders can set orders based on Price Action and expect to reach short-term targets. Beginning of entry zone (0.00010210) Ending of entry zone (0.00008920) Entry signal: Signal to enter the market occurs when the price comes to "Buy zone" then forms one of the reversal patterns, whether "Bullish Engulfing" , "Hammer" or "Valley" in other words, NO entry signal when the price comes to the zone BUT after any of the reversal patterns is formed in the zone. To learn more about "Entry signal" and the special version of our "Price Action" strategy FOLLOW our lessons: Take Profits: TP1= @ 0.00012060 TP2= @ 0.00013320 TP3= @ 0.00014570 TP4= @ 0.00016360 TP5= @ 0.00018600 TP6= @ 0.00020600 TP7= FreeZLongby ForecastCityUpdated 113
There is a possibility for the beginning of an uptrend in ZRXBTCTechnical analysis: . 0X/BITCOIN is in a range bound and the resumption of uptrend is expected. . The price is above the 21-Day WEMA which acts as a dynamic support. . The RSI is at 56. . While the RSI and the price downtrend in the Daily chart are not broken, bearish wave in price would continue . Trading suggestion: . There is a possibility of temporary retracement to suggested support zone (0.00010210 to 0.00008920). if so, traders can set orders based on Price Action and expect to reach short-term targets. Beginning of entry zone (0.00010210) Ending of entry zone (0.00008920) Entry signal: Signal to enter the market occurs when the price comes to "Buy zone" then forms one of the reversal patterns, whether "Bullish Engulfing" , "Hammer" or "Valley" in other words, NO entry signal when the price comes to the zone BUT after any of the reversal patterns is formed in the zone. To learn more about "Entry signal" and the special version of our "Price Action" strategy FOLLOW our lessons: Take Profits: TP1= @ 0.00012060 TP2= @ 0.00013320 TP3= @ 0.00014570 TP4= @ 0.00016360 TP5= @ 0.00018600 TP6= @ 0.00020600 TP7= FreeZLongby ForecastCityUpdated 2217
$ZRX Whale Dump Idea!My first thought that recent up is a dead cat bounce. With 1 billion right now ZRX sitting #26 at coinmarketcap. Quite volatile which is good for traders than holders, ey! Here are my 2 cents. 1. By the price action we see that two support boxes that i draw is quite good for retracement place. Following my Elliot Wave that would be perfect for an accumulation right there. To have a reversal, it must be break my yellow trend line with quite good momentum, if BTC price is sideway or even down ward, don't ever expect that before the time coming. 2. RSI level continuing made HL and always get rejected which makes this idea is even stronger. Above all ZRX is good project and you should not doubt it for now, but for the price, let the market decide.ZShortby blockchaindediUpdated 225
Technical Analytic for #ZRX #0x (29/08) - CryptoStation#ZRX (ZRX/BTC) Buy : 115-116 Flash Sell : 118-120-122-124 Short Sell : 125-130-135-140 Stop : 105 Follow me for more signals inbox me for more and more signalsZby CryptoStation1
A trading opportunity to buy in ZRXBTCTechnical analysis: . 0X/BITCOIN is in a range bound and the beginning of uptrend is expected. . The price is below the 21-Day WEMA which acts as a dynamic resistance. . The RSI is at 42. . While the RSI and the price downtrend in the Daily chart are not broken, bearish wave in price would continue . Trading suggestion: . There is a possibility of temporary retracement to suggested support zone (0.000108 to 0.000095). if so, traders can set orders based on Price Action and expect to reach short-term targets. Beginning of entry zone (0.000108) Ending of entry zone (0.000095) Entry signal: Signal to enter the market occurs when the price comes to "Buy zone" then forms one of the reversal patterns, whether "Bullish Engulfing" , "Hammer" or "Valley" in other words, NO entry signal when the price comes to the zone BUT after any of the reversal patterns is formed in the zone. To learn more about "Entry signal" and the special version of our "Price Action" strategy FOLLOW our lessons: Take Profits: TP1= @ 0.000124 TP2= @ 0.000134 TP3= @ 0.000143 TP4= @ 0.000154 TP5= @ 0.000184 TP6= @ 0.000206 TP7= FreeZLongby ForecastCity113
A trading opportunity to buy in ZRXBTCTechnical analysis: . 0X/BITCOIN is in a range bound and the beginning of uptrend is expected. . The price is below the 21-Day WEMA which acts as a dynamic resistance. . The RSI is at 42. . While the RSI and the price downtrend in the Daily chart are not broken, bearish wave in price would continue . Trading suggestion: . There is a possibility of temporary retracement to suggested support zone (0.000108 to 0.000095). if so, traders can set orders based on Price Action and expect to reach short-term targets. Beginning of entry zone (0.000108) Ending of entry zone (0.000095) Entry signal: Signal to enter the market occurs when the price comes to "Buy zone" then forms one of the reversal patterns, whether "Bullish Engulfing" , "Hammer" or "Valley" in other words, NO entry signal when the price comes to the zone BUT after any of the reversal patterns is formed in the zone. To learn more about "Entry signal" and the special version of our "Price Action" strategy FOLLOW our lessons: Take Profits: TP1= @ 0.000124 TP2= @ 0.000134 TP3= @ 0.000143 TP4= @ 0.000154 TP5= @ 0.000184 TP6= @ 0.000206 TP7= FreeZLongby ForecastCity10