BTCUSD Short: Descending Channel Targets $89,000 Demand ZoneHello traders! BTCUSD continues to trade within a clear descending channel, maintaining a strong bearish structure characterized by consecutive lower highs and lower lows. The price action repeatedly respected the channel boundaries, confirming solid seller control throughout the recent decline. Each time Bitcoin reached the upper boundary of the channel, it formed a pivot point, initiating another downward wave. Before the latest drop, BTCUSD spent some time moving sideways inside a Range Zone, showing temporary accumulation before sellers regained dominance. The bearish continuation led to another pivot formation near the channel’s resistance, triggering a fresh leg to the downside.
Currently, price has now approached the $89,000 Demand Zone, which aligns with the lower boundary of the descending channel. This level has acted as a significant reaction point, generating short-term bounces in previous price swings. The current positioning suggests that buyers may once again attempt to defend this zone. While below the $96,000 Supply Zone and the channel resistance, the broader trend remains bearish. BTCUSD is likely to experience a short-term corrective rebound from the demand area, aiming toward the $92,000–$93,500 region — a previous reaction cluster and local resistance.
My scenario is targeting the $89,000 level. However, if Bitcoin breaks below the $89,000 Demand Zone, it may trigger a deeper bearish continuation toward the lower liquidity areas around $88,000 or even lower. A confirmed breakout above $96,000 would be required to invalidate the bearish structure and signal a potential shift in momentum. For now, BTCUSD remains bearish, with a potential short-term correction from demand before further direction becomes clearer. Manage your risk!
1-BTCUSD

TRICK OR TREAT - BTC PRINTS $30,000 RECORD DRAW JUST IN 50 DAYSRecords are made to be broken.
At $86,000, Bitcoin is now down around 32% from its all-time high of $126,000 in early October.
In US Dollars terms it is the record, $30,000 draw just in 50 days.
// No pain (the biggest one is already behind, 100% true) =>> No gain
--
Best wishes,
@PandorraResearch Team

BTCUSD: Bearish Momentum Aiming for New LowsHello everyone, here is my breakdown of the current Bitcoin setup.
Market Analysis
BTCUSD continues to follow a strong bearish market structure, consistently moving inside a well-defined Downward Channel. The chart clearly shows that after a prolonged consolidation phase inside the large Range, Bitcoin attempted both a fake breakout to the downside and a bullish breakout above the upper boundary — but neither attempt resulted in a sustained trend shift. This indicates that buyers lacked the strength to reverse the broader trend. Once price broke down from the range, BTCUSD established a clean sequence of lower highs and lower lows, forming two consecutive downward channels. Each retest of the channel’s upper boundary resulted in a strong bearish rejection, confirming heavy selling pressure at every corrective move upward.
Currently, the recent breakout below the minor support line inside the second downward channel once again demonstrates that sellers remain fully in control. Price is currently trading just above the major Support Zone around $90,400–$91,000, which has acted as a short-term demand area. However, the repeated bearish impulses and weak buyer reactions suggest decreasing bullish interest at these levels. BTCUSD is now hovering around support but forming a continuation pattern that leans toward further decline. Failure to break above the $96,000 Resistance Zone, aligned with previous structure and the former trendline, reinforces the bearish outlook.
My Scenario & Strategy
I expect that Bitcoin will likely attempt a minor corrective push to retest the broken support or the lower boundary of the channel — but any such move is expected to be short-lived unless strong buying pressure appears. After this corrective phase, BTCUSD may continue its decline toward the lower part of the channel and deeper support areas.
A confirmed breakdown below the current Support Zone ($90,400–$91,000) would strengthen the bearish scenario and open the path toward the next downside targets. Only a strong breakout above $96,000 — with clear bullish confirmation — would weaken the bearish bias and signal that buyers are stepping back into the market. For now, short positions remain more favorable, especially after corrective pullbacks into resistance zones within the downward channel structure.
That's the setup I'm tracking. Thank you for your attention, and always manage your risk.

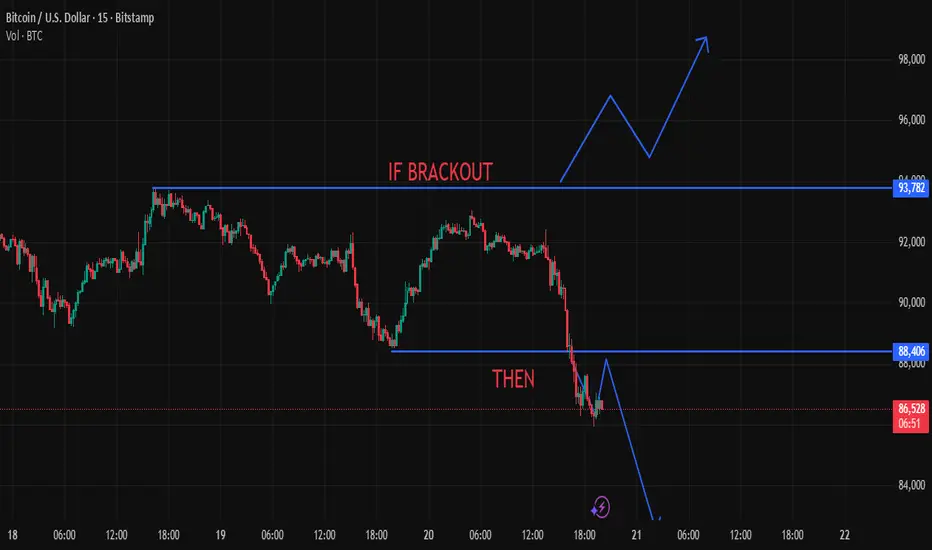
BTC Key Range Levels With Potential Price PathsDescription (TradingView-Friendly)
Bitcoin is currently trading between two important zones.
Price is reacting near the lower support area around 88,406, while the upper boundary near 93,782 remains the major resistance.
If the price moves above the upper zone with strong momentum, it could indicate a continuation toward higher levels.
If the market fails to reclaim support and moves downward, it may extend the decline toward the lower region highlighted on the chart.
This idea is for technical observation only and reflects possible scenarios based on structure and levels visible on the chart.
BTC: Black Friday Crash & The Road to 74k. H&S in the making?We are seeing a true Black Friday on Bitcoin today 😵😱🤬—price is diving below 82k, and the 126k top feels like jusst history.
Looking at the 1D structure, the market is clearly aiming for a "hard reset," magnetically pulled toward the 1.0 Fibonacci level around 74,600 USDT. We’ve already smashed through key supports, including the 0.786 Fib, which usually opens up a highway for a full retracement.
In my view, this drop is setting the stage to build the Right Shoulder of a massive Head and Shoulders pattern. If t he 74k zone holds—and it’s a major technical support—I expect a demand reaction there (marked with the green arrow). The target for this relief rally would be a return to the 100k area (0.5 Fib), completing the shoulder structure before any potential further downside.
The situation is confirmed by Trading Cipher X. Money Flow is flashing thick red, signaling that big capital is still exiting the market, while the wide momentum waves at the bottom indicate heavy selling pressure. There are no reversal signals yet; the daily candles (basically bearish Marubozu) and rising bars on the cumulative volume (WWV) confirm that the bears are in total control right now.
Game Plan: I’m not catching falling knives here. I’m patiently waiting for the price to hit the "kill zone" at 74,600 USD. Only there, upon confirmation (I’m looking for a bullish divergence on TCX), will I look for a Long entry to play the bounce. On the flip side, mid-term Shorts will only become attractive if we revisit the 98k-100k zone. Keep your eyes on 74k—it’s make or break for the bulls in the coming weeks.

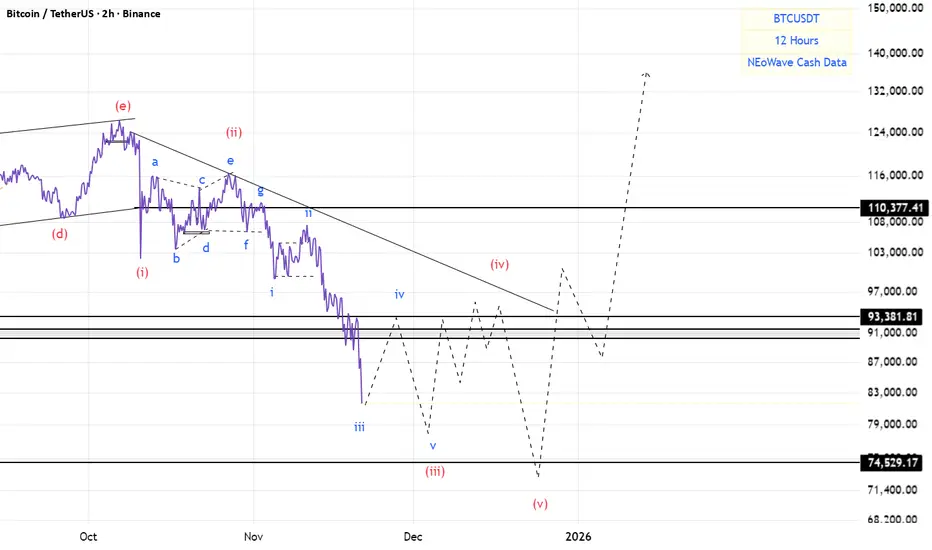
BTC(based on NEo wave)This branch has impulsive structure.
so why now there is an impulse wave here?
because this 5 waves are wave (c) of a flat.
when this 5 wave finished strong bullish wave will start.
November 20 Bitcoin Bybit chart analysisHello
It's a Bitcoin Guide.
If you "follow"
You can receive real-time movement paths and comment notifications on major sections.
If my analysis was helpful,
Please click the booster button at the bottom.
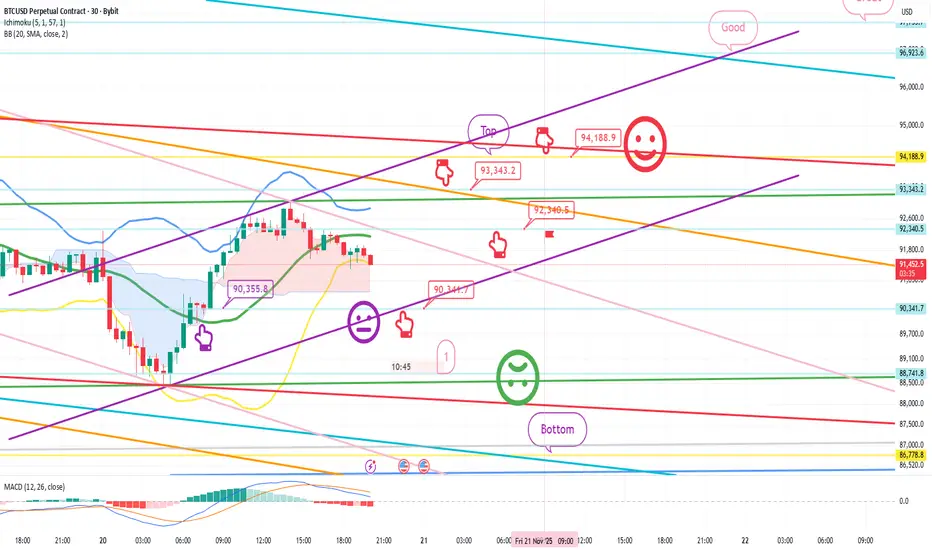
Here's a Bitcoin 30-minute chart.
Shortly, at 10:30 AM and 12 PM, the Nasdaq indicators will be released.
At the bottom left, the purple finger indicates the final long position entry point on the 19th, at $90,355.8. I've linked the strategy to that level.
The bottom area at the bottom is what I consider to be the major support line for this week.
(The center line of the Bollinger Bands monthly chart has moved from the previous $87,665.3.)
Everyone knows this and is waiting for it.
In my experience, if you wait at the bottom,
it generally doesn't come down easily. + Nasdaq volatility
Of course, we'll have to watch today's movement,
but please watch until the very end.
Because today could be a day with a significant move,
I kept my strategy as safe and simple as possible.
*Red Finger Movement Path:
One-Way Long Position Strategy
1. $90,341.7 long position entry point / Stop loss price if the purple support line is completely broken
2. $93,343.2 long position primary target -> Top, Good target price in that order
If the strategy is successful, you can utilize the 92.3K long position re-entry point indicated.
Since the 4-hour Bollinger Bands are repeatedly hitting the center line,
barring a sharp decline in the Nasdaq,
it is poised for a strong upward trend.
Note that the first point at the bottom is a double bottom.
If it falls to this level,
it is more likely to reach the bottom than to rebound.
Today, the Nasdaq and Bitcoin must move as far upward as possible to avoid falling to 86.7K this week. In the event of a weak sideways movement or correction,
I recommend keeping the bottom open until 9:00 AM next Monday.
Please use my analysis to this point for reference only.
I hope you operate safely, with a clear focus on principled trading and stop-loss orders.
Thank you.
BITCOIN (BTCUSD): When to Buy?!
Bearish rally continues on Bitcoin.
The market already lost more than 34% from a current ATH.
Analyzing a historic price action, I see an important structure cluster to focus on.
65000 - 76000 is a significant support area.
That will be a good zone for buying Bitcoin, expecting a resumption
of a long-term bullish trend after its test.
❤️Please, support my work with like, thank you!❤️

USD/CHF – Short Position📉 USD/CHF – Short Position
Entry: 0.80500
Stop Loss: 0.80800
Take Profit: 0.79000
Explanation:
Price tapped into a strong supply zone after a bullish correction and produced a clear BOS to the downside, confirming bearish order flow. The entry aligns with mitigation of the last bearish OB, with liquidity swept above the previous highs. Targeting the unmitigated demand zone below for a clean RR.

BTC/USDT – WEEKLY ANALYSIS (W1)🔵 BTC/USDT – WEEKLY ANALYSIS (W1)
Structure: Elliott Wave 5 (current wave = (4) correction)
This updated version of your chart adds Fibonacci extension targets for Wave (5), giving a much clearer projection.
1️⃣ Wave (4) Is Near Completion
Price has:
✔ Dropped sharply into the BIG Liquidity Zone (80k – 83k)
✔ Swept long-term trendline liquidity
✔ Tagged the 0.9 retrace marker (typical deep wave-4 behavior)
✔ Formed a weekly BOS during the drop
✔ Entered a historically strong demand zone
This fits perfectly with a complex corrective Wave (4).
2️⃣ Expectation: Reversal Soon
Wave (4) typically ends:
At big liquidity
At the trendline
Before violating Wave (1) territory
After a weekly BOS + wick
Your chart shows all these ingredients → a bottom is likely forming inside 80k–83k.
A bullish engulfing weekly candle here = wave (5) confirmation.
3️⃣ Wave (5) Target Zones (Fibonacci Extensions)
Your chart shows 4 major upside levels:
🎯 Target 1 — 100,757
First reaction level.
This is the 1.0 extension zone — often the first major resistance.
🎯 Target 2 — 109,998
Strong historical resistance + 1.272 extension.
Wave 5 usually passes this easily if momentum is strong.
🎯 Target 3 — 124,069
Major mid-range target.
This is where Wave 5 often pauses or makes a micro-correction.
🎯 Target 4 — 140,241 (−0.272 Fib)
This matches perfectly with standard Wave-5 overextensions.
Final upside zone before a large cycle top.
This is also the level shown at the top of your chart — very good placement.
4️⃣ Summary: BTC Weekly Outlook
✔ Wave (4) in progress but almost complete
✔ Liquidity grab is textbook
✔ Next move = impulsive Wave (5)
✔ Upside targets: 100.7k → 110k → 124k → 140k
✔ Macro trend remains strongly bullish
BTC is following nearly perfect Elliott Wave symmetry from your W1 structure.

Bitcoin is in a clean daily downtrend right nowBitcoin is in a clean daily downtrend right now – every bounce is just providing fuel for the next leg until the structure says otherwise.
Good evening traders, Brian here with a higher-timeframe look at BTCUSD.
Fundamental analysis
Bitcoin has been under sustained pressure even as some funds continue to accumulate spot positions. A few key points:
Macro uncertainty and tighter dollar liquidity are weighing on high-beta assets. While gold has held up relatively well, the performance gap between BTC and XAU has been widening in recent weeks, highlighting a clear risk-off tone towards crypto.
On-chain and fund flows suggest that a number of crypto investors are actually de-risking and pulling capital out, which reduces market depth and makes downside moves more violent when liquidity is thin.
Narrative is still mixed: long-term holders and some institutions are happy to buy lower, but in the short term the order flow is dominated by forced selling, deleveraging and risk reduction.
Bottom line: the macro backdrop does not yet justify an aggressive “buy the dip” approach on BTC. Trend-following shorts remain safer than trying to call the bottom.
Technical analysis
Daily structure is clearly bearish:
We have a confirmed market structure shift on the left of the chart, with the prior higher-low support broken and a series of decisive lower lows since then.
The main bullish trendline from earlier in the year has given way, and price is now travelling within a steep descending leg.
BTC recently tagged the 1.618 Fibonacci extension of the last major swing, aligning with a prior liquidity pocket. That produced a sharp intraday bounce, but so far it looks like a reaction inside a downtrend, not a full reversal.
Around 75.4k we have an important daily support zone. If this level is broken and accepted below, it opens the door to a deeper flush towards the next large support band lower on the chart.
Overhead, there is a clean imbalance/FVG and prior distribution area around 108k, with an intermediate resistance block around 96–97k and a nearer supply zone around 88k. These are prime locations to look for fresh shorts if price retraces.
For now my bias is simple: look to sell rallies into premium levels; any longs are tactical, short-term trades off key support only.
Key levels
Resistance / short zones:
88,000 – first reaction zone, “pay attention to the reaction”
96,500–97,200 – main short entry area for medium-term positions
108,000 – higher FVG / major daily supply
Support / long-only intraday zones:
75,400 – key support + 1.618 Fib/liquidity zone
74,000–72,000 – deeper support if 75.4k fails
Trade scenarios (for reference, not financial advice)
1. Short the first meaningful pullback – 88k area
Entry: 88,000
Stop: 90,000 (above local structure)
Targets: 82,000 → 78,000 → 75,500
Idea: treat 88k as the first supply zone in a downtrend. If price bounces from current levels and stalls here, I’m looking for rejection (wick rejections, failed break, or a clear shift in intraday structure) to join the trend. Once price moves in favour, I would look to pull the stop to breakeven and let the position run.
2. Core swing short – 96.5k–97.2k zone
Entry: 96,500–97,200
Stop: 99,000
Targets: 88,000 → 82,000 → 75,500
This is my preferred “medium-term” sell area. It aligns with a more significant daily supply block and offers better risk–reward if the larger bearish leg continues. Any squeeze into this region after a series of lower lows is, in my view, a controlled opportunity to reload shorts.
3. Tactical long only at deep support
Entry: 75,400–74,800
Stop: 73,800
Targets: 82,000 → 88,000
Here I would only consider a short-term long if we see a clean liquidity sweep into the 1.618 extension and strong rejection (long lower wicks, aggressive buy-back). The idea is simply to trade the bounce back into resistance, not to fight the higher-timeframe downtrend.
If BTC loses 75.4k and starts closing below it on the daily, I would become much more cautious on any long exposure and focus almost entirely on short setups towards the lower “important support” zone on the chart.
Trade with the trend, respect your risk, and don’t get trapped trying to be a hero at the bottom of a falling market.
If this BTC breakdown adds value to your plan, make sure you follow Brian for more daily BTC and gold analysis, and share your own view in the comments so we can compare scenarios.

BTC’s Toxic Relationship with Support LevelsMarket Prophecy is back
Price made a rejection on the weekly timeframe and successfully broke through daily support at 98,920. Now, it looks like BTC might pull a classic move—retracing to the 50–61.8% Fibonacci zone, just like its previous wave—before continuing its dramatic dive toward the next support at 81,490. Traders call it ‘price action.’ I call it emotional damage
good luck all
**My trading strategy is not intended to be a signal. It's a process of learning about market structure and sharpening my trading my skills also for my trade journal**
Thanks a lot for your support

BTCUSD - Bear Run Began Looking at this indicator on chart price shows the red area which is normally hit during bull runs
however this time it was not hit, and price is just trending over the curve in the middle of this indicator.
I believe the bear run for bitcoin has begun and what we will see is sideways movement and downward movement.
Look to enter in the lower green zone when it hits there on this timeframe, Daily.
The price action in white is just an example of what movement downward could look like.

Winter Has Arrived — Bitcoin’s Chill DiveBitcoin’s chart looks frosty — I expect a decline toward 83,000.
The red zone on the chart marks the invalidation area, where my plan will be canceled if price reaches it.
I believe Bitcoin is entering a corrective phase, and the market might need a “cool down” before any new rally can start
WHY THE TOP MAY NOT BE IN FOR $BTCBITCOIN SUPERCYCLE/MACRO STRUCTURE: CYCLES, ELLIOTT WAVES AND THE 269K SUPERCYCLE TARGET
Bitcoin is still operating inside the 4 year cycle that began at the FTX $15,500 low on 9 November 2022 (2) The directional pivot that begins (Subwave)Primary Wave 3 is $74,445. Until that level breaks the market has not entered the full macro expansion phase typical of Bitcoin’s strongest trends.
The cycle structure on the chart is clear:
• The cycle bottom printed between 9 November 2022
• The bullish expansion began one year before the 20 April 2024 halving
• The 2024 halving sits exactly at the cycle midpoint
• The cycle peak must form before November 2026
• The final bear phase completes in 2027
This will head into 5th Halving approx March -April 2028
The chart shows the halving cycles, coloured by vertical lines, repeating the same rhythm every four years with astonishing precision.
TOP - GREEN
BOTTOM - RED
HALVING - YELLOW
Each QT period marked a macro slowdown and a structural reset after the functional top. The 2022 QT aligned with the exact cycle bottom at 15500 and launched the current multi-year bull structure. QE has not really started this cycle - so hence this theory of the top not being in
Elliott Wave structure
The November 2021 high at 69000 is labelled as Wave 1 of 1 (PURPLE) inside the larger Supercycle. That means it was never a final top, just the first completed impulse of the entire multi-decade Supercycle.
The correction into 15500 in 2022 is marked as Supercycle Wave 2. This is a confirmed wave 2, as this broke the 2017 high.
• Wave 1 impulse complete
• Wave 2 pullback complete
• We are now building Primary Wave 3 of Supercycle Wave 3, the strongest part of the entire structure, and if my structure is correct, the current wave is a 2 of PRIMARY 3 (white), which is a subwave of the supercycle wave in purple.
The extensions on Fibs show:
• 1.618 at 129k (we have not hit)
• 2.272 at 175k
• 2.618 at 199,666k
• 3.618 at 269k
The purple Wave 5 of Wave 3 aligns with the 3.618 extension at 269k, which perfectly matches the outer macro trajectory drawn. Which may happen after the “technical timing low”
The 269k region completes Wave 5 of the larger Supercycle Wave 3.
This is not a top. This is structural wave completion.
THE MAJOR CORRECTION Wave 4 correction in 2027
The chart clearly maps the ABCDE correction - the low here cannot pass 111k
This aligns with:
• The 2027 bear phase
• The next QT window
• The historical Wave 4 timing and depth
The 2028 halving then ignites Wave 5, which begins the next expansion beyond 2029, following the same structural template from previous cycles.
MACRO SUMMARY FROM THE CHART
• 15500 was Supercycle Wave 2
• Bitcoin is inside Supercycle Wave 3
• Primary Sub Wave 3 begins at 74445
• Wave 5 of Supercycle Wave 3 targets around 269k
• Wave 4 correction aligns with 2027
• The next halving in 2028 triggers Supercycle Wave 5
• Every major QT phase aligns with cycle lows or transitions
• Each 4 year cycle peak prints before its deadline, so this one must peak before November 2026
Nothing in this structure suggests a top is in. Everything in the chart shows continuity, expansion, and alignment across cycles, QT phases, and Elliott Wave projections as long as $74445 holds
LFG!!!!!

GOLD consolidation. GOLD has been moving sideways. Could have a BreakOut by next week and continue to rise.

Stop!Loss|Market View: BITCOIN🙌 Stop!Loss team welcomes you❗️
In this post, we're going to talk about the near-term outlook for the BITCOIN ☝️
Potential trade setup:
🔔Entry level: 89416.67
💰TP: 80581.26
⛔️SL: 93834.38
"Market View" - a brief analysis of trading instruments, covering the most important aspects of the FOREX market.
👇 In the comments 👇 you can type the trading instrument you'd like to analyze, and we'll talk about it in our next posts.
💬 Description: Short- and medium-term prospects for the coin remain in favor of the seller, but no significant long-term risks for Bitcoin are currently visible. The 50,000-70,000 range could potentially be considered for investing in Bitcoin. Today, a potential short-term sell is being considered near the 88,000 level, where there is a limit seller accumulation (CME futures). The 78,000-80,000 area is being looked for as a target.
Thanks for your support 🚀
Profits for all ✅

Bitcoin – Support Turned Resistance BreakdownBitcoin has broken below a key support zone, which has now flipped into resistance on both the upper and lower highlighted regions. These zones have already been respected multiple times, confirming a shift in market structure from bullish support to bearish resistance.
Price is currently pulling back toward the nearest resistance zone. As long as BTC remains below this level, the bias stays bearish.
🔍 Market Structure
Previous support levels have turned into resistance, signaling sellers are in control.
Breakdown followed by consolidation below resistance suggests continuation to the downside.
The projected TARGET zone aligns with the next major demand area where buyers may attempt to re-enter.
📉 Bearish Scenario (Primary Bias)
Price retests the lower resistance zone.
Rejection keeps momentum bearish.
BTC moves toward the TARGET area marked on the chart for potential reaction.
📈 Bullish Invalidation
A strong close back above the resistance zone would invalidate the current bearish structure.
This could open a path toward reclaiming higher levels.
⚠️ Notes
Market remains vulnerable while below resistance, so watch for rejection signals or continuation patterns.

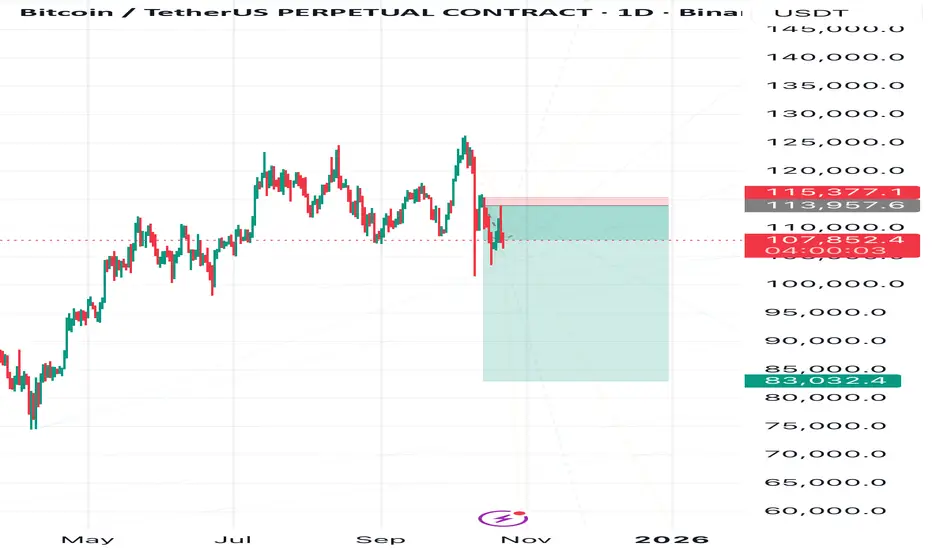
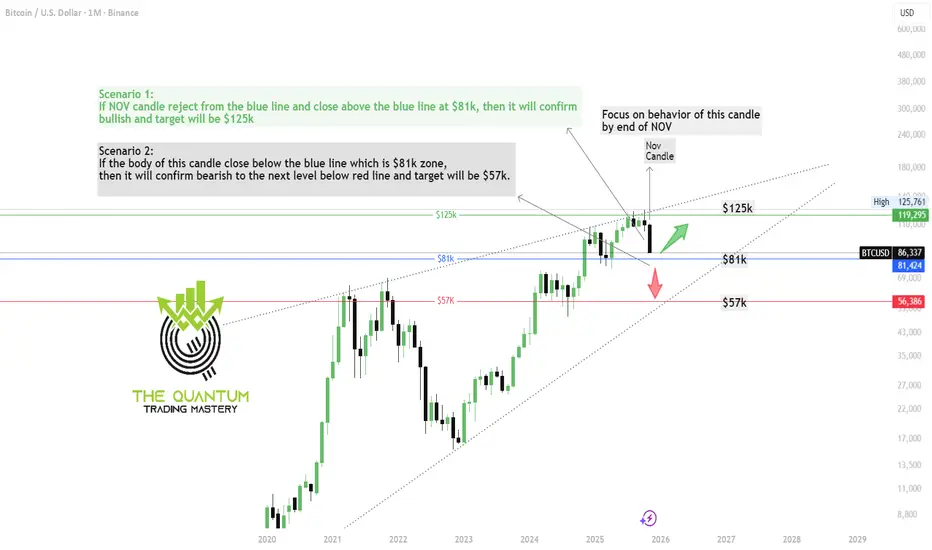
BTC Monthly Chart Technical AnaylsisDear Traders,
As expected from our previous weekly chart analysis, BTC has reached the $80K zone and has now successfully tapped $86K.
At this stage, the monthly candle is extremely important. I’ve shared the November candle—watch the closing carefully, because a major opportunity could be forming.
Trade smart, stay cautious, and if you find this update valuable, please show your support by boosting the post and dropping a comment.
The Quantum Trading Mastery
Bitcoin Approaching the $80,000 Level?Bitcoin has dropped below $90,000 for the first time in nearly seven months, as uncertainty surrounding the Federal Reserve's interest rate path, coupled with delayed economic data, has reduced demand for riskier assets like Bitcoin. This has led to continued strong selling pressure on Bitcoin.
On the chart, Bitcoin is moving in a clear downtrend, with consecutive lower highs and lows. Bitcoin has broken through previous support levels and is now testing lower price levels. In particular, the downward trendlines and the strong resistance at 90,000 USD are key factors in determining the trend.
The current price is near an important support level at 84,200 USD. If Bitcoin fails to hold this level, the likelihood of further declines towards 80,000 USD is high, with the next support level in this range.
Trade Strategy Recommendations:
Sell: When Bitcoin faces resistance at 90,000 USD or 96,500 USD, with targets at 84,200 USD and 80,000 USD.
Buy Against the Trend: Consider buying if the price drops significantly and shows signs of recovery from 80,000 USD, with short-term trades and low-risk exposure.

$BTC spot planBuying Bitcoin in purple box. Think 86k area will act as a good support. This is not a leverage trade. I am buying this spot so I can adjust my stoploss later if I want to.

BTCUSD ShortAs you see in the chart, I see many reasons that we can see BTC to the level of 85,000$ by end of the year. So the reasons are:
Head&Shoulder pattern
Started the downtrend channel
The bold blue trendline is what the price is expected to touch.

Rare Global Long Liquidity Imbalance (Order Book Signal)Over the last few days, the Long Zigg indicator has printed a rare extreme reading of 100 at the 10% order book depth — and this level appeared twice in just three days . Other monitored depths are also trading near their recent highs.
The last time we saw similar readings was around March 7, 2025 . After a brief correction, the market moved into a strong growth phase:
• BTC ≈ +70%
• ETH ≈ +225%
• SOL ≈ +166%
Many altcoins extended even further over the following months.
Long Zigg tracks the liquidity imbalance toward longs across the entire market using aggregated order books rather than price alone. It highlights moments when buy-side interest clearly dominates available sell liquidity.
Right now, this signal again shows a notable skew in liquidity to the buy side. I’m watching to see whether the market will react in a similar way to the previous extreme, or if this time will be different.
This is not financial advice and not a trade recommendation — just an observation based on my order book analytics.
