Bitcoin Can reach 93000 Bitcoin could reach the price level of $93,000 in the coming weeks.
There is a possibility that after breaking the midline of its long-term weekly channel, it may move up to the indicated FVG level to fill the remaining unfilled orders.
After that, it could start a new bullish rally aiming for the upper boundary of the channel.
This is purely an analysis and should not be considered as financial advice.
Buying or selling is at the trader’s own risk.
1-BTCUSD

$BTC up from hereOn 27 Oct, when BTC was $115k, I said it is going lower to possibly $100k or even overshoot to $90k before a buy ().
We are now at $89.9k. Looking for an up for here to $97k. If it breaks above the trendline, we are looking at a move to $107k before a possible next move lower.

Stop!Loss|Market View: GOLD🙌 Stop!Loss team welcomes you❗️
In this post, we're going to talk about the near-term outlook for GOLD ☝️
Potential trade setup:
🔔Entry level: 3992.755
💰TP: 3853.896
⛔️SL: 4067.971
"Market View" - a brief analysis of trading instruments, covering the most important aspects of the FOREX market.
👇 In the comments 👇 you can type the trading instrument you'd like to analyze, and we'll talk about it in our next posts.
💬 Description: Gold is moving in line with the previous sell scenario, and this medium-term trade remains relevant. In the shorter term, additional selling below the point of control (POC) level, around 3992.755, could also be considered. An alternative short-term scenario is selling near 4100, where the last accumulation is located. The downside target is currently considered to be in the 3800-3900 area, but a decline to 3600-3700 remains possible.
Thanks for your support 🚀
Profits for all ✅

BTC DOWN TO 80K? Based on what we are seeing here if BTC breaks through 100K then the next level down is 80K marker and if that does not hold then 70-72K marker makes sense
However If we can make new highs and break 107K then it is possible to continue upwards
If you want a deeper dive on BTC or any other crypto or stock or commodity you have been watching comment below the stock or asset and I will send you personally an analysis of that asset.
Happy Trading
Trade Smarter Live Better
Mindbloome Exchange

Stop!Loss|Market View: EURUSD🙌 Stop!Loss team welcomes you❗️
In this post, we're going to talk about the near-term outlook for the EURUSD currency pair☝️
Potential trade setup:
🔔Entry level: 1.15351
💰TP: 1.14184
⛔️SL: 1.15903
"Market View" - a brief analysis of trading instruments, covering the most important aspects of the FOREX market.
👇 In the comments 👇 you can type the trading instrument you'd like to analyze, and we'll talk about it in our next posts.
💬 Description: The main scenario for selling via a breakout of the 1.15500 - 1.16000 support area remains. The USD is gaining momentum and is likely to continue strengthening in the medium term. Against this backdrop, a shorter-term sell-off is being looked for. The lows from early this week serving as a potential sell entry point. Downside targets are considered as low as 1.14000.
Thanks for your support 🚀
Profits for all ✅

BTC Weekly View !BTC / USD
Bitcoin (BTC) followed my previous analysis on October 30th, dropping from $110,000 to its current price of $96,000. check here
What's Next?
Take a Look at the weekly chart:
Bitcoin is currently at a "do or die" support level (trend line + 50-week moving average).
This moving average has been a turning point in previous cycles.
If the price breaks below this level, it will confirm a mid-term bear trend with minimal target around 74k so keep an eye on this chart.

Is This Where Bitcoin Makes Its Major Decision?
🔥 The Hidden April Gap Nobody Is Talking About — Is This Where Bitcoin Makes Its Major Decision?
Most traders completely missed this one.
Buried inside April’s fast displacement sits a hidden Fair Value Gap that aligns exactly with the real Monthly–Weekly Higher Low — and if price revisits it, this level could decide the next macro direction.
Let me walk you through it.
⸻
📍 The Level (Rounded for Clarity)
This forgotten 15m imbalance sits between:
• $86,200 (top)
• $85,350 (bottom)
Not just any gap — this one overlaps perfectly with the true HL in the Monthly–Weekly structure, the same HL that has been carrying the entire macro bullish leg.
This is where real decisions are made.
⸻
📉 Why This Zone Matters
If price revisits this area, there are only two outcomes — and both are significant:
1️⃣ Early Reversal Attempt (If Buyers Defend the HL)
A clean bullish reaction here could signal:
• Absorption of sell-side pressure
• Builder structure for a new daily leg
• First real attempt to end the higher-timeframe down sequence
2️⃣ Bearish Absorption (If Sellers Crush the HL)
If price cuts through the gap with displacement,
the Monthly–Weekly HL collapses.
That opens the door to deeper levels with minimal support.
This is not a small level — this is a macro hinge point.
⸻
👁️ My Plan
I’m watching $86.2K – $85.35K very closely.
When price returns to this zone, I want to see whether we get:
• Reversal intent,
or
• Full bearish continuation.
No predictions.
No hopium.
Price action will tell the truth.
⸻
🧭 Final Thought
This April gap isn’t random.
It’s the hidden liquidity pocket sitting directly on the real Monthly–Weekly Higher Low.
If Bitcoin revisits this level, the market will reveal whether buyers still have strength — or whether the bearish macro continues without mercy.
If this analysis brought you clarity or aligns with your view,
please Like ❤️ | Comment 💬 | Follow 🔔 | Share ↗️ —
your support motivates me to keep releasing clean, objective insights for the community.
NFA.
COINBASE:BTCUSD COINBASE:MCZ2025

BTCUSD Technical Analysis – Is a Correction on the Way?BINANCE:BTCUSD is currently trading inside a well-defined falling wedge, and the price is pressing against the lower boundary of the pattern. This level could serve as dynamic support, and if a strong rejection occurs, we may see a corrective move toward the 102,000 resistance area.
If sellers successfully defend that zone, the bearish structure remains intact, increasing the likelihood of BTCUSD moving back down to lower price levels. However, if price breaks above this resistance, a deeper correction toward the upper boundary of the wedge could unfold.
At this stage, closely monitoring candlestick signals and volume activity around this key area is essential for spotting high-quality selling opportunities. Ensure every trade setup is backed by solid confirmation, and always maintain strict risk management.
If you have any thoughts or additional perspectives on this setup, I’d be happy to hear them. Feel free to share your opinion in the comments!

$BTC Correction DOES NOT = Bear MarketPeople are rushing to call it a 🐻 market for CRYPTOCAP:BTC while the correction is 27.8%
Fun Facts:
There were 2x 32%+ corrections between 2024-25
On average, there are at least 3x 30%+ every bull cycle
🐻are in control since summer no doubt
But it's not a 🐻market yet...

Bitcoin Below $100K: Eyeing the 60-Day Cycle LowBitcoin is heading below $100K and is on track to hit its 60-day cycle low - a predictable bottom that repeats like clockwork. What makes this one extra interesting? It’s aligning with the weekly cycle low, setting the stage for a sharp reversal.
All major indicators are flashing “bottom incoming” between now and November 24th. History shows that buying near these cycle lows can pay off big. If Bitcoin holds, the next target is a clean retest of $117K, which is roughly an 18% upside from current levels.
Mark my words: November could be the pivot month. Once the bottom is in, we can expect a massive bullish run through December and January, with Bitcoin targeting $135K–$150K.
And don’t sleep on altcoins - they’ll likely start outperforming BTC early next year as the rotation kicks in.
✅ Bottom line: If you’re not watching this cycle, you’re missing a prime entry point. Bitcoin is setting up for a breakout.

Bitcoin trading strategyNew Dimension of Core Logic: Breaking Out of Liquidity Traps, Focusing on Structural Variables
1. Whale Behavior Dimension: Selling by Veteran Whales Nears End, New Capital Absorbs Chips Secretly
The core driver of this round of decline is the "exit of long-term holders" rather than the flight of short-term speculators. Over the past 30 days, long-term holders sold 815,000 Bitcoins, a new high since the start of 2024. Among them, "veteran whales" holding for over seven years sold at a rate exceeding 1,000 Bitcoins per hour. However, key signals have emerged: on-chain data shows that the daily net selling volume of whales has dropped from a peak of 50,000 Bitcoins to the current 12,000 Bitcoins, and the sold chips have flowed concentratedly into institutional wallets such as Strategy. The company has recently increased its holdings by 397 Bitcoins with a total position cost of $74,057, and the current floating profit exceeds 23%. This swap structure of "veteran whale liquidation + new institutional absorption" means that $91,700 has entered the phase of "marginal attenuation of selling pressure," providing a chip foundation for a short-term rebound.
--------------------------------------------------------------------------------
2. Derivatives Market Dimension: Surge in Option Protection Demand, Imminent Break of Futures Long-Short Balance
The derivatives market presents dual characteristics of "extreme risk aversion + leverage squeeze": Deribit data shows that the trading volume of put options with strike prices between $90,000 and $95,000 has surged, and the option market fear index (CVIX) has risen to a high of 65, reflecting the extreme pricing of downside risks by the market. But the futures market has shown signs of reversal: 180,000 traders were liquidated in the past 24 hours, including $510 million in long liquidations and $170 million in short liquidations, indicating that the long leverage squeeze is drawing to a close. Meanwhile, although the funding rate remains at -0.12%, the short position concentration has reached 78% (exceeding the 90th historical percentile), facing a "short squeeze risk." Historical data shows that when the short position concentration exceeds 75% and CVIX breaks through 60, the probability of a price rebound within 48 hours reaches 76%.
Bitcoin trading strategy
buy:91000-92000
tp:94000-95000
sl:90000

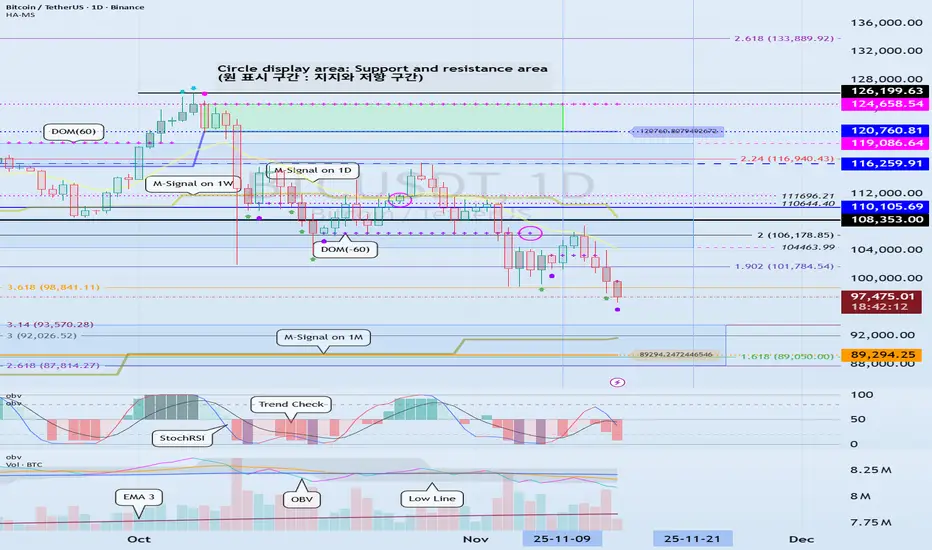
Check for support near the M-Signal indicator on the 1M chart
Hello, fellow traders!
Follow me to get the latest information quickly.
Have a great day.
-------------------------------------
(USDT 1D Chart)
(USDC 1D Chart)
USDT is the major currency that influences the coin market.
The USDT and USDC charts are moving in opposite directions.
This decline appears to be driven by funds flowing out of USDC.
Once the USDC gap decline stops, funds flowing in through USDT are expected to drive the coin market higher.
-
(USDT.D 1M Chart)
For the coin market to show an upward trend, USDT dominance must remain below 4.91 or show a downward trend.
We need to see if the price can face resistance around the Fibonacci level of 0.618 and turn downward.
If not, we should consider a response plan, as a rally toward 7.13 is expected.
-
(BTC.D 1M chart)
For an altcoin bull market to begin, it must either remain below 55.01 or show a downward trend.
Therefore, for the bull market we're waiting for to occur, both USDT dominance and BTC dominance must decline.
If USDT dominance declines while BTC dominance rises, a bull market will emerge, with only BTC rising.
--------------------------------------------------
(BTCUSDT 1D Chart)
The key is whether the price can touch the M-Signal indicator on the 1M chart and turn bullish.
At this point, it's crucial to maintain the price above 89294.25.
If not, a step-down trend is likely.
To turn bullish, the price must remain above the M-Signal indicator on the 1W chart.
At this point, it's crucial to maintain the price above the newly created HA-High indicator point of 110105.69 on the 1M chart.
If not, the price may pretend to rise but then fall again, so you need to consider countermeasures.
This is a basic trading strategy within the box range: buy between DOM(-60) and HA-Low and sell between HA-High and DOM(60).
If the price rises in the HA-High ~ DOM(60) range or falls in the DOM(-60) ~ HA-Low range, you should switch to trend trading.
To do this, we should consider the movements of the StochRSI, TC (Trend Check), and OBV indicators.
To sustain the uptrend after breaking above a key point or range, the StochRSI, TC, and OBV indicators must show upward trends.
At this point,
1. The StochRSI indicator should not have entered an overbought zone.
2. The TC indicator should remain above zero.
3. The OBV indicator should remain above the High Line.
Therefore, check the movements of the StochRSI, TC, and OBV indicators at the support and resistance levels depicted on the 1M, 1W, and 1D charts and consider whether you can trade accordingly.
Based on the current price range, the key points or ranges are:
- 87814.27-93570.28
- 110105.69
- 120760.81-124658.54
I believe the three ranges above are important points or ranges.
Therefore, when the price is near these ranges, you should check the movements of the StochRSI, TC, and OBV indicators to determine a response plan.
-
Thank you for reading to the end.
I wish you successful trading.
--------------------------------------------------
- This is an explanation of the big picture.
(3-year bull market, 1-year bear market pattern)
I will explain in more detail when the bear market begins.
------------------------------------------------------
BTC Slips Below 50 EMA: Caution RequiredThings could get uglier as CRYPTOCAP:BTC has now broken below the 50 EMA, a key long-term dynamic support level.
This breakdown signals growing weakness and may open the door for deeper downside if buyers don’t step in soon.
DYOR, NFA

BITCOIN Free Signal! Buy!
Hello,Traders!
BITCOIN taps into a major higher-timeframe demand area, reclaiming structure and sweeping downside liquidity. A bullish reaction here may drive price toward the next internal range high.
--------------------
Stop Loss: 88,783$
Take Profit: 94,407$
Entry Level: 91,500$
Time Frame: 1D
--------------------
Buy!
Comment and subscribe to help us grow!
Check out other forecasts below too!
Disclosure: I am part of Trade Nation's Influencer program and receive a monthly fee for using their TradingView charts in my analysis.

Bitcoin run is over BTC chart shortly . The season probably has been over
This pattern is not accepted yet , but looks promising
Just personal opinion
Not financial advice

Bitcoin - This chart is crumbling!⛔️Bitcoin ( CRYPTO:BTCUSD ) creates a massive top:
🔎Analysis summary:
All the previous cycles on Bitcoin have been lasting about 1,000 days. And exactly three years ago, Bitcoin retested the previous all time high, starting the next bullrun. If we soon see bearish confirmation on Bitcoin, this crypto will lead to another insane bloodbath.
📝Levels to watch:
$100,000 and $50,000
SwingTraderPhil
SwingTrading.Simplified. | Investing.Simplified. | #LONGTERMVISION

#AVNT Update — RWA Sector Watch Chart shows
Nice falling wedge forming here.
AVNT is sitting between two options:
hold the current range and attempt a breakout following Aster’s movement,
or make a short-term breakdown with a wick toward 0.32 – 0.27.
Both zones are solid buy regions in my view.
🔑 Key Levels
Support zone: 0.32 – 0.27
Recovery line: 0.90 – 1.20
Breakout path: 2.20 – 3.50 (ATH recovery range)
Max investment on AVNT → 3 % of portfolio.
Trade it as a rotation play with clear stops and staged exits.
🧾 About Avantis
Avantis is the largest RWA perpetuals DEX in DeFi, built and backed on Base.
It allows trading of crypto and real-world assets (FX, commodities, indices, equities).
Supported by Pantera and Coinbase, it’s currently the top DEX on Base by volume,
offering institutional-grade products and up to 500× leverage in a transparent, permissionless way.
Avantis introduced Zero-Fee Perpetuals (ZFP) — traders pay fees only when they profit.
It also brought leveraged RWAs on-chain, driving rapid growth:
over 20 billion USD in cumulative volume and 15 million run-rate revenues since February 2024.
(See CMC for more background.)
✅ Quick Recap
Pattern: Falling wedge
Buy zones: 0.32 – 0.27
Recovery line: 0.90 – 1.20
Breakout targets: 2.20 – 3.50
Allocation: 3 % max
Trend bias: Bullish recovery if wedge holds
⚓ Renzo Tip
“When a wedge tightens, patience becomes your best entry signal; force it, and you miss the release.”
🤲 Prayer
May Allah bless us with calm decisions, protect our trades from haste,
and grant us the clarity to wait for confirmation before every move.
I’ve traded this coin from the early base around 0.30 → 1.80,
so returning to these levels offers a strong risk-to-reward window.
📈

#BTC/USDT Broke the support. Levels to watch...💬 Bitcoin Update:
Unfortunately, the previous BTC setup has been invalidated — BTC broke the support.
The next major support levels are $90.3K and $86.5K.
If BTC breaks $90.3K, there’s a strong chance of a sharp bounce from the lower support zone.
The best move right now is to observe how the price reacts; no need to take unnecessary risks when things look uncertain.
You can look for short opportunities on relief bounces, but personally, I’d rather wait for a clearer setup.
As always, do your own research and make your own decisions.
If you found this helpful, please hit the like button ❤️
Thank you.
#PEACE ✌️

BTC/USD: Sell Pressure Building AgainBTC/USD: Sell Pressure Building Again
Market Summary
BTC/USD continues to operate within a declining market environment where sell-side pressure remains dominant. The recent recovery attempt has shown limited strength, forming only a temporary corrective phase within a broader downward cycle. Current conditions indicate that the market is preparing for another bearish continuation as liquidity builds on the upper side.
Market Behavior
The chart highlights a consistent pattern of declining impulses followed by shallow recoveries. Each upward phase has been met with swift rejection, reinforcing the dominance of bearish sentiment. The mid-range compression visible in the current structure reflects a controlled environment where market participants are redistributing positions rather than initiating larger upward transitions.
Momentum remains weak on the upside, and overall flow continues to align with the prevailing sell-side direction. Repeated structure shifts earlier in the sequence indicate that sellers are maintaining control of directional movement.
Current Setup
BTC/USD is now approaching a zone historically associated with short-term manipulation and liquidity grabs. Price appears to be forming a tight consolidation while climbing into this region. Such behavior often precedes a sell-side continuation, especially when rallies fail to show progressive expansion.
The chart projection suggests a likely formation of a distribution-style sequence before a renewed downward movement. This scenario aligns with the market’s broader behavior over recent sessions

Bitcoin Daily Analysis #13 – November 17, 2025Welcome to another Bitcoin analysis — and apologies for the delay.
As we can see, our bearish scenario has strengthened, and on the daily timeframe, BTC has officially turned downward 📉.
It’s still unclear whether this move is just a correction wave or a full trend reversal, but based on the candle volume, there’s potential for deeper pullbacks ahead.
If Bitcoin reclaims the 106,000 zone and holds strongly above it, the bullish outlook can return 🔄📈.
But if we get rejected from this level once more, we can safely say the trend has shifted into a clear downtrend.
There’s solid buying orders around the 90,000 zone, and we need to see how price reacts there.
A break below this level would make the bullish scenario much harder to achieve 🚨.
Additionally, after building a consolidation box in this region — or waiting for clearer structure — there may be an opportunity to take a short position 📉🟥.
Disclaimer:
This content is for informational purposes only and does not constitute financial or investment advice. © DIBAPRISM
Larry D.Kohn

STRK Finally Escapes the RangeNASDAQ:STRK has finally broken out of its long consolidation zone and pushed above the descending trendline—something the chart hasn’t managed to do for months. This breakout shows a clear shift in momentum, with buyers stepping in strongly.
As long as price holds above this zone, STRK could be gearing up for a continuation move to the upside. The structure looks healthier now, and the breakout suggests the trend may be turning in favor of the bulls.
DYOR, NFA
Please hit the like button if you like it, and share your views in the comments section.

TRB Squeezing Into a Tight RangeLSE:TRB is holding above a key support zone while trading under a long-term downtrend line.
Price is stuck in a narrow consolidation, suggesting a bigger move is building.
A breakout from this range will likely decide the next direction.
DYOR, NFA
Please hit the like button if you like it, and share your views in the comments section.

BTCUSD updateMacro Context
Dollar strength, rising U.S. yields, and elevated volatility keep global risk conditions defensive.
Crypto follows that tone: liquidity is cautious, and participation slows ahead of a heavy macro week.
Crypto News Snapshot
Bitcoin trades near a six-month low as fading rate-cut expectations pressure risk assets.
Ethereum headlines a new “supercycle” claim, though critics question whether fundamentals support it.
XRP gains attention as ETF-related institutional flow expectations rise.
MSM — Market Structure Mapping
BTC trades in the daily discount zone under prior bearish highs.
Liquidity from last week’s 92,630 remains active.
VFA — Volume Flow Analytics
The previous bullish volume node is lost.
Participation favors defensive flow rather than expansion.
OFD — Order Flow Dynamics
Orderflow is bearish at negative 2 deviation levels.
Sell-side engagement is cleaner than buy-side behavior.
PEM — Precision Execution Modeling
Engagement is difficult at these levels.
Dollar strength and rising yields tighten conditions across crypto and risk assets.
Until macro stabilizes, stick to structure + flow alignment.
No anticipation. Only confirmation.
CORE5 Rule of the Day
Slow down when the macro speeds up.
One-Line Summary
BTC trades in a defensive macro regime with selective participation and a neutral-to-cautious bias.
— CORE5DAN
Institutional Logic. Modern Technology. Real Freedom.
