TRB Squeezing Into a Tight RangeLSE:TRB is holding above a key support zone while trading under a long-term downtrend line.
Price is stuck in a narrow consolidation, suggesting a bigger move is building.
A breakout from this range will likely decide the next direction.
DYOR, NFA
Please hit the like button if you like it, and share your views in the comments section.
1-BTCUSD

BTCUSD updateMacro Context
Dollar strength, rising U.S. yields, and elevated volatility keep global risk conditions defensive.
Crypto follows that tone: liquidity is cautious, and participation slows ahead of a heavy macro week.
Crypto News Snapshot
Bitcoin trades near a six-month low as fading rate-cut expectations pressure risk assets.
Ethereum headlines a new “supercycle” claim, though critics question whether fundamentals support it.
XRP gains attention as ETF-related institutional flow expectations rise.
MSM — Market Structure Mapping
BTC trades in the daily discount zone under prior bearish highs.
Liquidity from last week’s 92,630 remains active.
VFA — Volume Flow Analytics
The previous bullish volume node is lost.
Participation favors defensive flow rather than expansion.
OFD — Order Flow Dynamics
Orderflow is bearish at negative 2 deviation levels.
Sell-side engagement is cleaner than buy-side behavior.
PEM — Precision Execution Modeling
Engagement is difficult at these levels.
Dollar strength and rising yields tighten conditions across crypto and risk assets.
Until macro stabilizes, stick to structure + flow alignment.
No anticipation. Only confirmation.
CORE5 Rule of the Day
Slow down when the macro speeds up.
One-Line Summary
BTC trades in a defensive macro regime with selective participation and a neutral-to-cautious bias.
— CORE5DAN
Institutional Logic. Modern Technology. Real Freedom.

BITCOIN:LIVE TRADEHello friends
You know that this is a risky situation, so observe risk and capital management.
The price has risen after the decline, has collected good liquidity, and now it has fallen again, has collected low liquidity, and is waiting now that this floor has been made, to move to the specified targets. Of course, the opening of the US government is also effective.
Observe capital management.
*Trade safely with us*

How much will Bitcoin fall?Bitcoin's future scenarios
Which scenario do you think is more likely?
Pay attention to levels and pricing
They can be decision points


One more Bullish Market pump before the dumpHold your horses bears. If price fails to hold above the previous peak we are likely going lower in USDT dominance which means one more bullish sweep of the crypto market before sweeping the extreme liquidity to continue the market dump afterwards.

BTCUSDT Weekly Chart Analysis !BTCUSDT Weekly Chart – Full Analysis
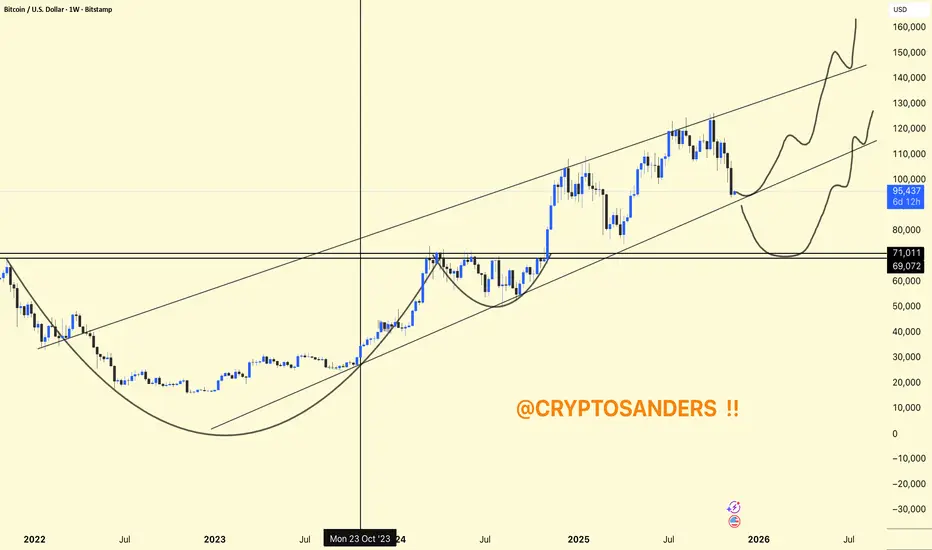
Bitcoin is trading within a long-term rising channel, maintaining higher highs and higher lows over multiple years.
Recent Structure: After a powerful uptrend, BTC is currently retesting the midline of the channel as support, which aligns closely with historical breakout levels.
Chart Patterns: Two notable cup-and-handle formations are marked, suggesting strong accumulation phases followed by aggressive rallies. Both patterns played out bullishly with price surges.
Immediate support is in the $90,000–$95,000 region (lower channel line). If lost, deeper support lies around $71,000–$69,000.
BTC holds this channel and midline; the upside path targets $140,000–$160,000 based on the channel ceiling.
A breakdown would likely cause a deeper retrace, with potential demand return at lower horizontal supports.
Short-term volatility is likely, but as long as the major uptrend and channel structure remain intact, BTC is poised for higher targets into 2026.
BTC's weekly chart is still constructive, with a bullish long-term structure, but critical support is being tested. Holding this range could set up for a continuation to new all-time highs, while a breakdown would mean a deeper consolidation first.
DYOR | NFA
$BTCUSD breaks 50 WMA and $100,000After a great run BTC has finally rolled over. We are now below the Weekly 50 MA and the $100.000 level. The question is do those technical levels now flip from being support to resistance? If so, is that a sign of another leg down?

BITCOIN The 1W MA50 Bear confirmation you didnt want, happened..Bitcoin (BTCUSD) just closed last week below its 1W MA50 (blue trend-line) for the first time since March 06 2023. Since that break-out, the 1W MA50 had been tested and held on 3 major occasions within the Bull Cycle, providing the most optimal mid-Cycle entries during those 2.5 years.
What's even more important than this time distance, is the fact that every 1W candle closing below the 1W MA50 has always marked/ confirmed the start of the new Bear Cycle historically. This is something that we've presented to you and discussed numerous times this year, as we were analyzing BTC's 4-year Cycle theory and why October was the most likely Cycle Top candidate time-wise.
This time we are looking at the previous Cycle more specifically, due to the strong similarities so far leading to the current Top. First of all the end-of-Cycle rallies on both started after a clear test and rebound on the 1W MA50. At the same time, the both displayed Higher Highs, against the 1W RSI's Lower Highs, which is a huge Bearish Divergence and the first strong indication that the Cycle Top may be forming.
The Cycle Top on both came when the 1W RSIs were 70.00. Also the 1W MA50 break-out took place around the 0.382 Fibonacci level from the last test/ rebound. As you may realize, there is a high degree of symmetry here both price-wise and in terms of RSI. If that continues, we can expect the Bear Cycle bottom to be at least on the 1.618 Fibonacci extension at $55000.
So do you think that the closing below the 1W MA50 has confirmed the new Bear Cycle? Feel free to let us know in the comments section below!
---
** Please LIKE 👍, FOLLOW ✅, SHARE 🙌 and COMMENT ✍ if you enjoy this idea! Also share your ideas and charts in the comments section below! This is best way to keep it relevant, support us, keep the content here free and allow the idea to reach as many people as possible. **
---
💸💸💸💸💸💸
👇 👇 👇 👇 👇 👇

November 11 Bitcoin Bybit chart analysisHello
It's a Bitcoin Guide.
If you "follow"
You can receive real-time movement paths and comment notifications on major sections.
If my analysis was helpful,
Please click the booster button at the bottom.
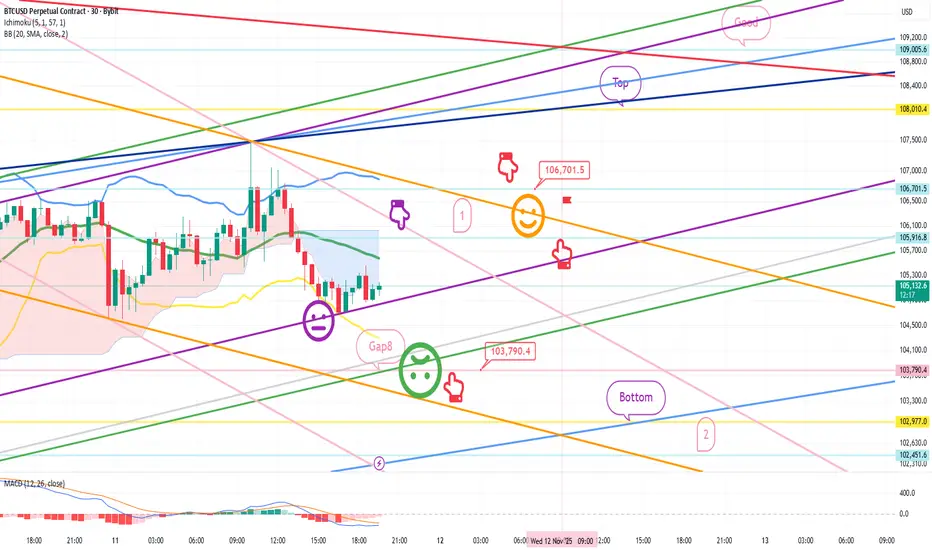
This is a Bitcoin 30-minute chart.
There are no separate Nasdaq indicators.
I developed a strategy based on the lower gap retracement of both Bitcoin and Nasdaq.
*Conditional long position strategy when the red finger moves
1. Confirm the first touch of the purple finger at the top (autonomous short)
Switch to a long position at the bottom at $103,790.4 /
Stop-loss price if the green support line is completely broken or the bottom is touched
2. First target for a long position at $106,701.5 / Target prices are Top and Good in that order.
If the strategy is successful, the first section is used to re-enter the long position.
If a correction occurs immediately without touching the first section at the top,
I'll wait for a long position at the bottom. Looking at the overall picture today, if the price drops to the bottom,
the medium-term pattern will be broken.
The purple support line must be maintained or the upper limit must be reached at 106.7K.
A rebound in the 1+4 range is required without breaking the green support line.
The Nasdaq variable is important, so please keep a close eye on the movement.
I hope you operate safely, with principled trading and stop-loss orders essential.
Thank you.
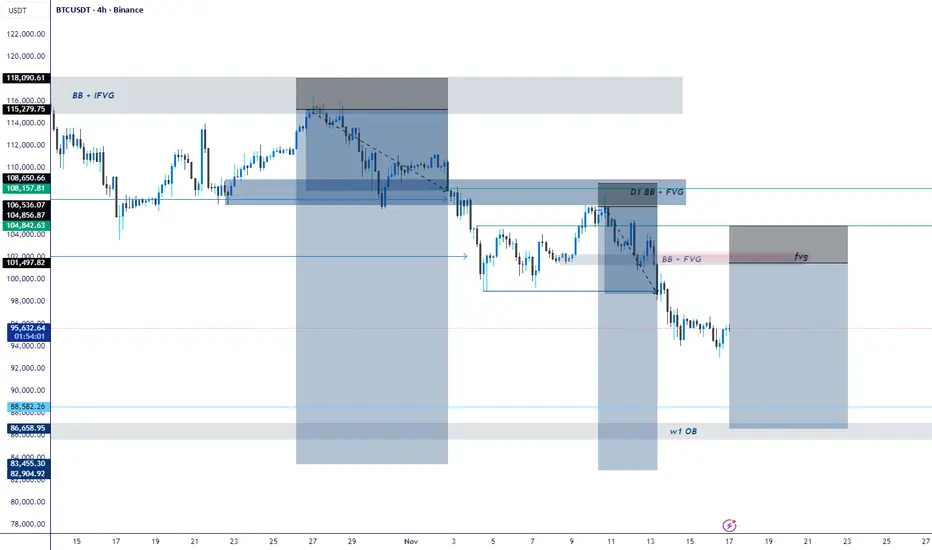
BTC Outlook: Premium Rejections, Clean Drawdown Targets, and KeyBTC continues to respect the higher-timeframe bearish order flow. Price tapped into the Daily Bearish Block + IFVG around the $104K–$108K premium zone, delivered displacement, and broke structure to the downside.
From there, the market formed a clean 3H Supply (BB + FVG) where sellers aggressively re-entered. Price rejected that imbalance and continued the markdown phase.
Structure remains bearish with lower-highs and lower-lows being printed. Current PA is consolidating below key structure, signaling that liquidity is being engineered for the next leg.
We still have an unmitigated Weekly OB at $83K–$86K, which aligns with the macro drawdown target. This zone remains the highest-probability area for a deeper corrective bounce.
K ey Levels
Premium Rejection Zone: $104K – $108K
3H Supply + FVG: $98K – $101K
Immediate Support: $92K – $95K
Major HTF Demand (Weekly OB): $83K – $86K
What I Expect Next
Retracement into the 3H FVG / inefficiency before another sell-off.
Liquidity below $92K likely to be swept.
High-probability macro reaction once price taps the weekly OB.
---------------------------------------------------------------------------------------------------------------------
CONFIRMATION ENTRY (Safer Approach)
Use this for precise execution:
Mark the 3H/1H supply zone.
Wait for price to tap the zone → no instant entries.
Drop to M15/M5 and wait for a clear CHOCH (shift) or BOS confirming sellers.
Enter on the pullback into the refined OB or FVG.
SL above the M5 POI that caused the break.
First TP at relative equal lows or clean inefficiencies.
This keeps you out of premature entries and filters manipulation.
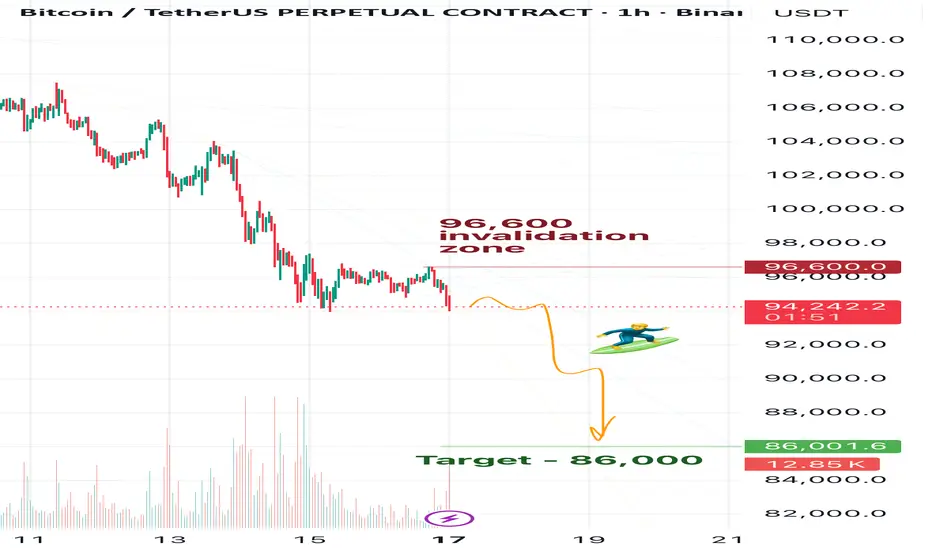
BTC Daily View 17.11Friends, as you may remember from my previous Bitcoin updates, I’m expecting BTC to reach 83k. At the moment, in my view, Bitcoin is already preparing for this move down.
However, for now my main target is 86k — I think BTC currently has enough momentum only to drop to that level. Before we see 83k, it will likely need to build more energy.
So after hitting 86k, I expect a correction — probably a prolonged one. But let’s see what the market gives us.
🎯For now, my target remains 86k.
❌Invalidation zone: 96,600
⚠️Disclaimer:
This is not financial advice. Please make your own decisions according to your own trading rules, and never trade without stop-losses.
🗯️If you find my ideas helpful, please leave a reaction and write a comment — your support really matters to me
Bitcoin: Oversold !It was a tough week on the crypto market, where the majority of coins significantly slipped in value. BTC was the leader of this drop. It occurred due to the combination of several reasons, which in combination, dragged the BTC toward the lowest, $94,7K level. Persistently high inflation in the US raised doubts that the Federal Reserve will cut interest rates in December, which reduced the demand for risk assets, like BTC. On the other hand, the broader market entered into a risk-off mode, where tech stocks and crypto-companies experienced significant declines. In addition, large liquidations of leveraged long positions in the crypto market, and whale-sales amplified the downward move in BTC price.
The price of BTC was holding solid grounds at $100K support, however, Thursday's risk-off sentiment pushed the price of BTC lower, till the level of $94,7K. During Saturday's trading session, BTC modestly moved to the level of $96K. The RSI indicator reached the level of 30, indicating a clear oversold market side. The MA50 is very close to the MA200, indicating a “dead cross” formation in technical analysis in a near term period.
Although BTCs move toward the $94K for some market participants might be perceived as painful, still, it was a necessary move for BTC. Now it marks a fresh, new start for BTC for a move toward higher grounds, and even new ATH sometime in 2026. It should be also considered that some lower grounds are possible before this final switch to the upside. Namely, some analysts are mentioning some probability that BTC might go even lower, toward the $76K, which was market low in April 2025. However, at this moment charts are pointing to some probability of $90K for the week ahead. Still, in case that dip buyers enter the scene, the next resistance at $100K, might be an easy target for BTC for the week ahead.

MARKETS week ahead: November 17 – 23Last week in the news
The longest Government shutdown in the US is over, however, investors were more concerned regarding valuations of tech companies and probability that the Fed might (not) cut rates in December. A strong correction occurred in equity markets followed with a strong sell-off on the crypto market. The S&P 500 closed the week at 6.734 after a modest rebound on Friday. BTC dipped below the $100K mark, slipping in one moment toward the $94,7K. The price of gold was also within a swing trade mode, still closing the week below the $4,1K support. The US Treasury yields also had a volatile week, with 10Y closing at 4,14%.
The longest ever U.S. government shutdown ended Wednesday evening after lasting more than six weeks. While its conclusion was expected to restore the flow of key economic data that investors had been missing, it has instead introduced fresh uncertainty. White House press secretary Karoline Leavitt indicated that some of the economic reports scheduled for release during the shutdown may never be published.
In an attempt to “Make groceries affordable again”, the US President is rolling back tariffs on more than 200 food items, including beef, coffee, bananas, and orange juice, to try to lower grocery costs for Americans. Analysts are noting that this might be the attempt to dig into modestly rising inflation in the US, although the official figures are still missing, due to the Government “shutdown”.
SoftBank Group sold its entire holding of about 32.1 million shares in Nvidia Corporation, raising roughly US$5.8 billion as part of its shift to fund large-scale AI investments, including OpenAI. The move is being used to finance its “all-in” bet on OpenAI and a US data-centre build-out (the “Stargate” project). The news triggered a drop in value of SoftBank shares by around 10% in Tokyo exchange, due to investor concern about whether the AI valuation boom may have gotten ahead of fundamentals.
News is reporting that Berkshire Hathaway revealed a surprising new $4.3B stake in Alphabet, the parent company of Google, marking a notable shift given Buffett’s historical caution toward tech stocks. This investment now ranks Alphabet as the tenth-largest holding in Berkshire’s portfolio. At the same time, the company further reduced its stake in Apple, cutting its shares from 280 million to 238.2 million. Analysts are noting that the moves signal a strategic rebalancing within Berkshire’s equity holdings.
The Czech National Bank has bought $1 million worth of digital assets, including BTC, USD-stablecoin and a tokenised deposit, as part of a pilot test portfolio. This portfolio is kept separately from its official international reserves and is not intended to be actively expanded. The goal is to gain hands-on experience in managing blockchain assets, testing key custody, multi-level approval process, crisis management, and anti-money laundering compliance. The CNB plans to review and assess the project over the next two to three years, to evaluate whether digital assets could play a future role in the financial system.
CRYPTO MARKET
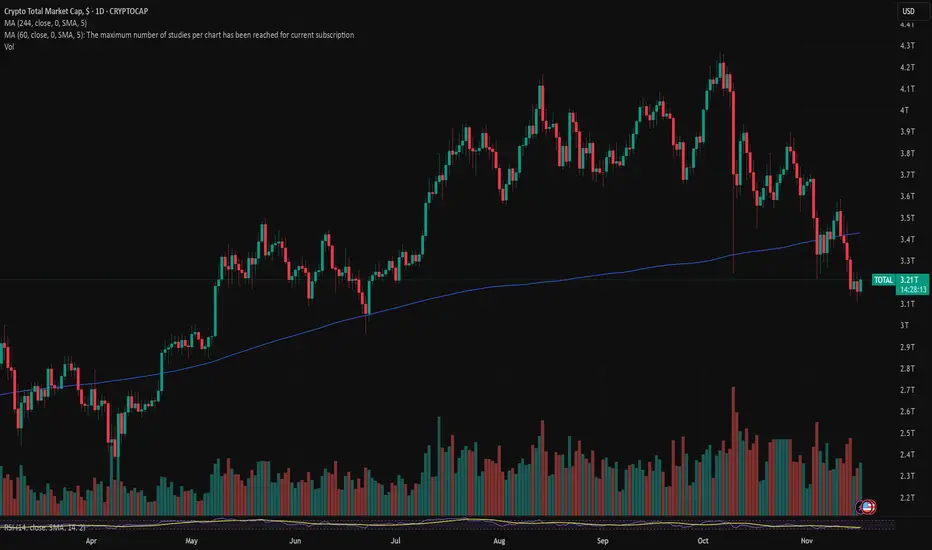
It was a challenging week for the cryptocurrency market, with the majority of coins experiencing significant declines. Overall, the convergence of macroeconomic concerns and market-specific dynamics contributed to a particularly volatile week for cryptocurrencies, highlighting the sensitivity of the market to both monetary policy and investor sentiment. BTC led the downturn, falling to a low of $94,700. This drop was driven by a combination of factors that collectively weighed on the market. On one hand, persistent inflation in the US fuelled concerns that the Fed may hold off on cutting interest rates in December, reducing appetite for risk assets, including crypto. At the same time, broader financial markets entered a risk-off mode, with tech stocks and crypto-related companies also seeing notable declines. Total crypto market capitalization decreased by 6% during the previous week, erasing $195B in value. Daily trading volumes remained flat for the week, with $329B traded on a daily basis. Total crypto market capitalization increase from the beginning of this year currently stands at -1%, with a total funds outflow of $37B.
BTC was the main coin which drag the total crypto market capitalization to the downside. Total weekly outflow was $195B, while only BTC participated with $132B, decreasing its value by 6,5% w/w. ETH was also down by 6,1%, with an outflow of $25B. Solana was traded lower by almost 11%, with funds outflow of $9,5B. This week Filecoin had a stronger pullback of 26%,, while Cardano and Avalanche dropped by almost 10%. DOGE dropped by 6,5% and LINK was last traded down by 7,7%. On the opposite side were only a few coins with weekly positive results. This week Monero managed to gain 16%, while ZCash continued to gain in value, with a weekly increase of 17.6%. Uniswap was also traded higher by 23,7%.
Increased activity related to circulating coins continued for another week in a row. Filecoin added 1,5% more coins to the market, IOTA increased its circulating coins by 0,4%, while ZCash added 0,2% new coins. Majority of other altcoins had an increase of 0,1% of coins on the market like XRP, DOGE, Stellar, DASH, Solana.
Crypto futures market
The crypto futures market experienced a steep decline over the week, mirroring the sharp sell-off seen in the spot market. Both BTC and ETH futures fell close to double-digits across all maturities, as macroeconomic uncertainty and broader risk aversion drove investors to reduce exposure. The move represented one of the largest weekly pullbacks of the quarter, underscoring the market’s sensitivity to macro signals and shifting sentiment.
BTC futures declined between -9.12% and -9.29% w/w, with the November 2025 futures closing at $94,365 and the March 2027 maturity ending at $102,730. The curve retained its upward slope, but absolute price levels are now approaching the lower bound of the medium-term range.
ETH futures posted slightly deeper losses than BTC, dropping between -9.64% and -9.79% w/w. The November 2025 futures closed at $3,140, while March 2027 settled at $3,474. Despite the week’s substantial correction, the curve maintained its structure, signalling that longer-dated expectations remain intact even as near-term conviction weakens. The decline in ETH futures was exacerbated by weaker liquidity conditions and heightened volatility across altcoins, which intensified selling pressure.
Despite the sharp drawdown, the futures curve structure remains intact, suggesting that traders still expect a cyclical recovery once macro conditions stabilize. However, sentiment is now more fragile, and volatility may remain elevated until clearer signals emerge from monetary policymakers and broader financial markets.
BTCUSD On The Rise! BUY!
My dear friends,
My technical analysis for BTCUSD is below:
The market is trading on 94419 pivot level.
Bias - Bullish
Technical Indicators: Both Super Trend & Pivot HL indicate a highly probable Bullish continuation.
Target - 98381
About Used Indicators:
A pivot point is a technical analysis indicator, or calculations, used to determine the overall trend of the market over different time frames.
Disclosure: I am part of Trade Nation's Influencer program and receive a monthly fee for using their TradingView charts in my analysis.
———————————
WISH YOU ALL LUCK

The market seems to have completed the A wave of the ABC correctI mainly focus on Elliott Wave analysis. The chart has already completed a 5-wave impulse to the upside, and we are now in the ABC corrective phase. It looks like wave A has finished, and the market seems to be entering wave B at the moment.
I'm not sure how high wave B will extend, but I expect it to retrace to 0.382, 0.5, 0.618, or possibly 0.786 before dropping in a 1:1 measured move.

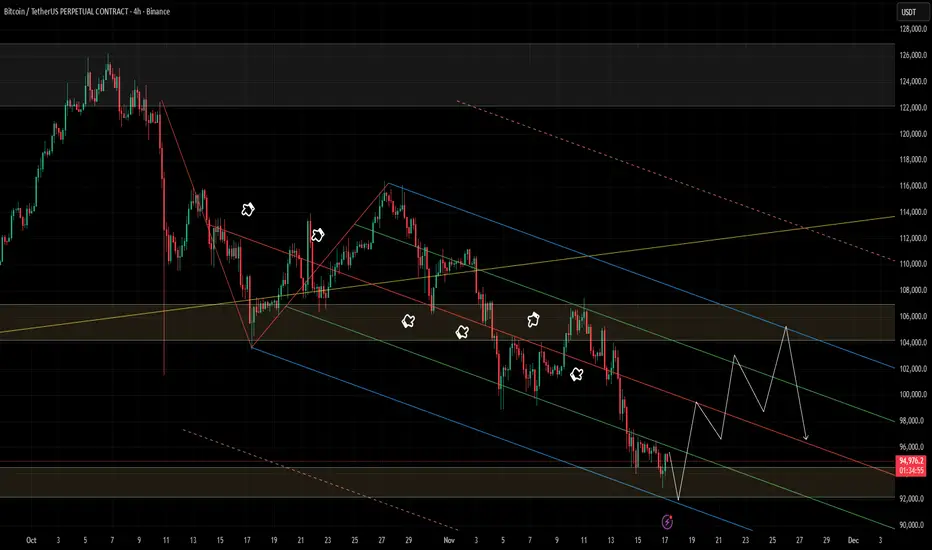
BTCUSD Rebounds From Buyer Zone — Correction Toward $101KHello traders! Let’s take a look at BTCUSD (Bitcoin). After an extended bearish phase inside a broad descending channel, price consistently respected both the resistance and support lines, forming a clear series of lower highs. Each touch of the descending resistance line resulted in a Turned Around reaction, confirming strong seller control throughout the structure. Earlier, Bitcoin broke below its local support area, initiating a deeper correction toward the major Support Level near $96,000. This zone aligns with the lower boundary of the descending channel and historically served as a strong reaction area for buyers. Recently, BTCUSD reached the bottom of the structure and is now showing early signs of a potential pullback. Price is attempting to rebound from the Buyer Zone, aiming toward the nearest resistance cluster around $100,800–$101,600, which also forms the lower boundary of the Seller Zone. This level previously acted as support and is now expected to serve as a strong retest area. As long as price remains below the descending resistance line, the overall trend stays bearish. A short-term bullish correction toward TP1: $101,600 remains possible, especially if buyers maintain control above the $96,000 support. However, if BTC fails to break above the Seller Zone, sellers may step in again, potentially pushing the price back toward the major support and even extending the downtrend. A confirmed breakout above the descending resistance would invalidate the bearish scenario and open the door for a stronger recovery. Please share this idea with your friends and click Boost 🚀

BTC At the Edge of Breakdown or Reversal?!!!Bitcoin has once again tapped the lower boundary of the descending channel, creating a clean liquidity sweep inside a major demand zone. This area has repeatedly triggered strong bullish reactions, and the current price action shows early signs of another potential rebound.
As long as BTC holds above the channel low, a corrective move toward 98K → 102K → 105K remains on the table.
However, the broader structure is still bearish until a confirmed breakout above the red trendline and the upper channel levels is achieved.
Key Levels:
• Support: Channel Low + Demand Zone
• Resistance: Red Trendline, 98K, 102K, 105K
• Bias: Short-Term Bullish Correction, Mid-Term Bearish Structure
📌 Clear invalidation occurs if price breaks down below the channel with a strong close.
BTC TO $150KWith liquidity being broken, we can finally see sellers getting more strength. I expect price to still fall further before a new leg of bulls comes into position


BTCUSD (1D) update !!BTCUSD (1D)
Bitcoin is testing the lower boundary of its long-term rising channel, currently near $95,000.
This major support line has held multiple times in the past year; holding here can set up a strong bullish reversal.
The projected path points to possible upside toward $140,000 if buyers defend this support and the uptrend resumes.
DYOR | NFA

Could the bearish momentum continue?Bitcoin (BTC/USD) is rising towards the pivot, which is a pullback resistance and could reverse to the 1st support which acts as a pullback support.
Pivot: 99,744.03
1st Support: 88,246.12
1st Resistance: 107,447.45
Disclaimer:
The opinions given above constitute general market commentary and do not constitute the opinion or advice of IC Markets or any form of personal or investment advice.
Any opinions, news, research, analyses, prices, other information, or links to third-party sites contained on this website are provided on an "as-is" basis, are intended to be informative only, and are not advice, a recommendation, research, a record of our trading prices, an offer of, or solicitation for, a transaction in any financial instrument and thus should not be treated as such. The information provided does not involve any specific investment objectives, financial situation, or needs of any specific person who may receive it. Please be aware that past performance is not a reliable indicator of future performance and/or results. Past performance or forward-looking scenarios based upon the reasonable beliefs of the third-party provider are not a guarantee of future performance. Actual results may differ materially from those anticipated in forward-looking or past performance statements. IC Markets makes no representation or warranty and assumes no liability as to the accuracy or completeness of the information provided, nor any loss arising from any investment based on a recommendation, forecast, or any information supplied by any third party.
