BTCUSD Rebounds From Buyer Zone — Correction Toward $101KHello traders! Let’s take a look at BTCUSD (Bitcoin). After an extended bearish phase inside a broad descending channel, price consistently respected both the resistance and support lines, forming a clear series of lower highs. Each touch of the descending resistance line resulted in a Turned Around reaction, confirming strong seller control throughout the structure. Earlier, Bitcoin broke below its local support area, initiating a deeper correction toward the major Support Level near $96,000. This zone aligns with the lower boundary of the descending channel and historically served as a strong reaction area for buyers. Recently, BTCUSD reached the bottom of the structure and is now showing early signs of a potential pullback. Price is attempting to rebound from the Buyer Zone, aiming toward the nearest resistance cluster around $100,800–$101,600, which also forms the lower boundary of the Seller Zone. This level previously acted as support and is now expected to serve as a strong retest area. As long as price remains below the descending resistance line, the overall trend stays bearish. A short-term bullish correction toward TP1: $101,600 remains possible, especially if buyers maintain control above the $96,000 support. However, if BTC fails to break above the Seller Zone, sellers may step in again, potentially pushing the price back toward the major support and even extending the downtrend. A confirmed breakout above the descending resistance would invalidate the bearish scenario and open the door for a stronger recovery. Please share this idea with your friends and click Boost 🚀
1-BTCUSD

BTC At the Edge of Breakdown or Reversal?!!!Bitcoin has once again tapped the lower boundary of the descending channel, creating a clean liquidity sweep inside a major demand zone. This area has repeatedly triggered strong bullish reactions, and the current price action shows early signs of another potential rebound.
As long as BTC holds above the channel low, a corrective move toward 98K → 102K → 105K remains on the table.
However, the broader structure is still bearish until a confirmed breakout above the red trendline and the upper channel levels is achieved.
Key Levels:
• Support: Channel Low + Demand Zone
• Resistance: Red Trendline, 98K, 102K, 105K
• Bias: Short-Term Bullish Correction, Mid-Term Bearish Structure
📌 Clear invalidation occurs if price breaks down below the channel with a strong close.
BTC TO $150KWith liquidity being broken, we can finally see sellers getting more strength. I expect price to still fall further before a new leg of bulls comes into position


BTCUSD (1D) update !!BTCUSD (1D)
Bitcoin is testing the lower boundary of its long-term rising channel, currently near $95,000.
This major support line has held multiple times in the past year; holding here can set up a strong bullish reversal.
The projected path points to possible upside toward $140,000 if buyers defend this support and the uptrend resumes.
DYOR | NFA

Could the bearish momentum continue?Bitcoin (BTC/USD) is rising towards the pivot, which is a pullback resistance and could reverse to the 1st support which acts as a pullback support.
Pivot: 99,744.03
1st Support: 88,246.12
1st Resistance: 107,447.45
Disclaimer:
The opinions given above constitute general market commentary and do not constitute the opinion or advice of IC Markets or any form of personal or investment advice.
Any opinions, news, research, analyses, prices, other information, or links to third-party sites contained on this website are provided on an "as-is" basis, are intended to be informative only, and are not advice, a recommendation, research, a record of our trading prices, an offer of, or solicitation for, a transaction in any financial instrument and thus should not be treated as such. The information provided does not involve any specific investment objectives, financial situation, or needs of any specific person who may receive it. Please be aware that past performance is not a reliable indicator of future performance and/or results. Past performance or forward-looking scenarios based upon the reasonable beliefs of the third-party provider are not a guarantee of future performance. Actual results may differ materially from those anticipated in forward-looking or past performance statements. IC Markets makes no representation or warranty and assumes no liability as to the accuracy or completeness of the information provided, nor any loss arising from any investment based on a recommendation, forecast, or any information supplied by any third party.

BTC Weekly chart Bear MarketI had to wait until the weekly closing candle to publish this idea.
We are currently in the A wave correction. I am expecting the price to do the B wave now (couple of weeks or the time it takes), finding resistance between 109,286 and 113,174 resistance zone. That zone will be where I place my Big Short with a TP of 40,000.
40,000 - 30,000 will be the accumulation zone and will mean the end of the bear market. When the time comes, I will tell you when the bull market begins and the next ATH in BTC.
Don't buy BTC at these prices, it is too expensive, wait for the next couple of years to buy. I will update the Daily chart idea for the big short zone to have the precise entry point.

BTCUSD – Market Structure ProjectionShort-Term Outlook
1. BTC is expected to complete a final liquidity sweep below recent lows.
2. A minor corrective rally into a premium zone offers a short opportunity.
3. Confirmation comes from rejection + RSI divergence.
2. Mid-Term Reversal Setup
4. After the sweep, BTC is projected to form a bullish break of structure (BOS).
5. A retest of demand provides the optimal long entry.
6. This phase begins the next expansion leg into 2026.
3. Long-Term Macro Trend
7. The higher-timeframe trend remains bullish despite local corrections.
8. BTC is expected to follow an impulse → correction → impulse pattern.
9. Macro upside targets remain positioned for new all-time highs.
4. Key Market Levels
Support Zones
10. $86,000 – $90,000 — primary liquidity-sweep region.
11. $92,500 – $94,000 — bullish retest confirmation zone.
Resistance Zones
12. $105,000 – $110,000 — mid-cycle rejection area.
13. $130,000 – $150,000 — macro expansion target range.
5. Trade Framework Summary
14. Short Setup: Enter after corrective rally into premium; target liquidity sweep.
15. Long Setup: Enter after BOS + demand retest; target macro continuation.
16. Structure favors a bullish expansion phase through 2026.


BTC on a Nice Zone!In daily chart Bitcoin is on a nice position and you can take a buy market position now. I showed the SL and TP on the chart also you can have your special money management like trailing stop.
GoodLuck!

BTC needs to hold this level or risk a slide toward 90K?Bitcoin is at a crucial juncture. This week’s move could possibly prove vital for the cryptos forecast leading into Christmas.
Bitcoin has extended losses for a 4th session, now trading less than $95K. 93,700 dollars is possibly the most immediate support on the chart.
For any recovery to gain traction, price might need to reclaim 101,150 dollars and establish higher lows above it.
Perhaps the most important fundamental issue pressuring BTCUSD are the remarks from Fed officials questioning whether a December rate cut is warranted. Adding to the downside, Japan Exchange Group has apparently paused the listing of three crypto treasury firms while it reviews new compliance and disclosure rules. Japan remains the largest market in Asia for listed Bitcoin treasury firms, with fourteen companies currently holding BTC.
Bitcoin: 100K Resistance Watch 88K Overlap.Bitcoin rejected the 105K area NEW resistance/old support. I wrote about this possibility a week ago and highlighted it during my stream. With the new low in progress, this area 95K and 90K are the next support areas to watch for swing trade reversals. Note the 90K to 88K area is a major support and IF cleared, will confirm a significant change to my wave count.
It is IMPORTANT to consider this game as a collection of "IFs". If you were lured by all of the hype and high risk prices above 100K (I talked about this all summer), NOW you get to sit through the associated pain. THESE are prices to be interested in, especially for accumulating for investment. An OPEN mind is required to navigate this arena of incomplete information. Bitcoin can TEST as low as 73K (the pre election all time high) or even lower. How you manage risk through sizing and moderation of leverage (if used at all), is how you will more likely arrive at an optimal outcome.
My chart shows key levels on this specific time frame, the arrow points to a reaction point (100K new resistance), and the illustration of lines highlights a potential scenario that I believe has a higher probability of developing over the coming week or weeks. As of now, the 95K support is broken but not by much, it can reverse quickly. Since there are a number of major supports in this area, the key is to confirm a reversal pattern. It may be in the form of a failed low or double bottom like formation nearer the 90K level. It is within reason to measure profit potential from the 100K area now that it is a new resistance. This is the shorter time horizon perspective ideal for swing trades only.
In terms of the broader view, 88K is major because it is where I have my Wave 1 of this broader wave defined. IF price overlaps this (meaning it goes to 85K with no swift rejection) then it confirms that the current structure is the broader corrective wave (Wave 2). This Wave 2 can potentially see prices in the 50Ks or theoretically lower. I believe extreme low prices are a low probability, but you must be prepared either way. I don't make specific forecasts because I know price is purely driven by sentiment, and sentiment can be extremely irrational.
Lesson: LEARN to assess risk and reasonable possibilities through TECHNICAL analysis along with some fundamental perspective. If you are stuck from much higher prices, you can only blame yourself for consuming too much Michael Saylor content. While the short term price structure is bearish, the bigger picture hasn't changed yet. THIS is what an investment opportunity looks like, NOT pushing all time highs day after day. As an investor you assume the most risk, so how much you risk should always be the focus, not how much you can make. And also consider the question: what has changed fundamentally? Sentiment drives price and when it gets to an extreme, opportunities arise especially when aligned with the fundamental view.
Thank you for considering my analysis and perspective.

BTC: Major RSI divergence - Next stop around $69K?Bitcoin is showing strong warning signals that the current bull run may be ending. On the weekly chart, we can clearly see a massive RSI bearish divergence, similar to what happened before previous cycle tops.
Today’s BTC options expiry added extra pressure, and with no quick resolution in sight for the Ukraine war, alongside worsening global economic conditions (trade wars, inflation, tightening liquidity), the macro environment does not favor sustained risk-on sentiment.
The chart highlights a likely correction path, with the next major support zone sitting around $64K–69K (previous resistance turned support). If this level breaks, further downside cannot be excluded.
For now, caution is advised – this may mark the end of the bull run and the start of a new accumulation phase.

BTCUSD – 1D FVG Retest Completed | BTC is showing classic bearish continuation structure after failing to reclaim the 1D Fair Value Gap (FVG) and rejecting cleanly from the imbalance zone.
Price is now sitting just above the key support around $92,825, and this level is acting as the final line before a larger macro sell-off begins.
📌 Key Points From the Chart
1️⃣ 1D FVG Rejection (Primary Bearish Signal)
Price tapped directly into the purple 1D FVG, showing a wick-to-wick mitigation.
The rejection from this area confirms:
✔️ Smart Money filling inefficiency
✔️ No bullish displacement
✔️ Supply still in full control
This is a textbook continuation pattern in a downtrend.
2️⃣ $92,825 – Last Support Before Breakdown
This level has been tested multiple times, making it both:
➡️ Major psychological level
➡️ Short-term liquidity pool
If price holds below this zone → bearish momentum accelerates.
3️⃣ Liquidity Sweeps Expected Before Breakdown
The projected path shows:
A slight push up into local liquidity
Quick rejection
Break of structure
Continuation towards macro demand
This pattern often appears before strong dumps.
4️⃣ HTF Trend Still Bearish
Both structure and momentum indicate:
🔻 Lower highs
🔻 Lower lows
🔻 No bullish displacement
🔻 No HTF demand breakup
BTC remains in a distribution / markdown phase.
5️⃣ Next Macro Target → $86,145
This is where:
✔️ HTF liquidity rests
✔️ Major demand zone sits
✔️ Previous inefficiency aligns
This level is extremely attractive for Smart Money.
📉 Summary
BTC remains bearish unless bulls break back above the 1D FVG.
Rejecting from imbalance + losing $92,825 = clear path towards $86,145.

BTC OUTLOOKThe moves up to the 107K region are still just corrections in my view.
During previous tests of the rising channel support, we had clear hidden bullish divergences on RSI, MACD, and Stochastics which resulted in strong and fast recoveries. However, in the current test, when we also take USDT.D dominance into account, the picture looks more cautious.
USDT dominance has broken above its long-term descending trendline and is now holding above it. This indicates increasing demand for stablecoins and a risk-off tone in the market something we should not ignore.
As long as BTC holds above $90,500, the market remains safe within the broader structure. But a daily close below $90,500 could open the door for a deeper correction toward the major horizontal support in the $69K–$70K zone.
This is my current BTC outlook stay cautious and manage risk accordingly. 📉📈
This is not financal advice.

USDT.D OUTLOOKYou can clearly see a descending structure here, but the sideways movement between 3.74% and 6.37% is also quite notable. The 6.24% level stands out as the first key resistance target.
If 6.24% fails to break and hold above, a pullback may occur.
So this region is crucial for determining whether USDT Dominance will continue higher or reject and reverse.
Also, the 6.24% level in USDT.D corresponds approximately to a $90,500 BTC price, making this zone even more important to watch.


BItcoin super cycle This is what I believe is a scenario we might see.. in which bitcoin goes back to 60k ish and then to 150k then back to 75k then back to 150k before it goes moon shot 1 million dollars in 2031-32 the gains will be minimal for now bull markets will be weak. But wait it out till 2031-32 and youll be likely rewarded.

Bitcoin (BTC/USDT) – Long Bias AnalysisPrice is currently trading inside a key demand zone where buyers previously showed strong interest. After the recent sell-off, BTC has stabilized around this support area and is now showing signs of accumulation, suggesting a potential reversal to the upside.
From my current entry zone, I expect Bitcoin to push higher and target the previous major high around 107,465.98, which aligns with the bullish zone highlighted on the chart. This area represents the next significant liquidity pocket where price may look to tap before any deeper correction.
My stop loss is set at 94,016.34, positioned safely below the support zone to protect the trade in case of unexpected downside continuation. As long as price holds above this level and maintains structure, the bullish outlook remains valid.
Overall, I’m looking for BTC to build momentum from this zone and drive upward toward the high, in line with the broader market structure shown on the chart.

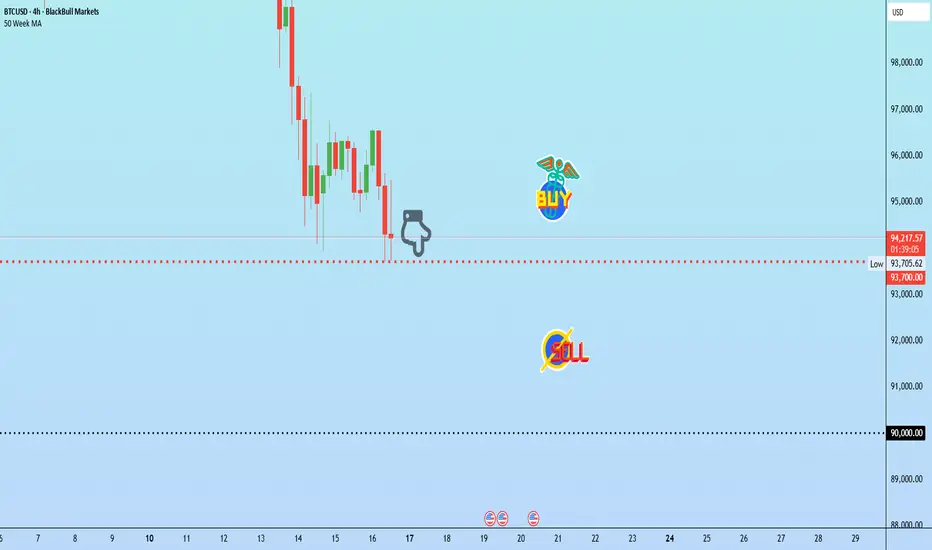
#Bitcoin Sunday Update! I'm still bearish? Bitcoin Sunday Update!
CRYPTOCAP:BTC is holding below 100K, and I'm still bearish. The 1W 50 EMA, which Bitcoin repeatedly used as major support throughout the entire cycle, has now been broken. If BTC closes below this level by the end of Sunday, it will confirm that momentum remains to the downside and open the move toward the 92K to 90K CME gap and potentially even lower targets.
Some people on X talking about the death cross misinterpret it as something bullish, and the Fear and Greed Index at extreme lows is often taken to mean the bottom is in. Don't be fooled by these influencers. That idea is completely wrong when a new bear market is starting. I still remember in 2021 when BTC dropped from 68K to 50K—the Fear and Greed Index hit 16, which is extreme fear, yet Bitcoin continued dropping much lower.
Bitcoin is almost 25K down, and still you’re seeing bullish news, which means more dump is coming. Don't be fooled until this level is confirmed. This one-week 50 EMA is the most important for this bull market. Insider activity shows selling in Bitcoin and stocks continues.
As for my position: I am still holding my short. When and if I close or open any new positions, I will update you immediately. My current average entry is around 118K.

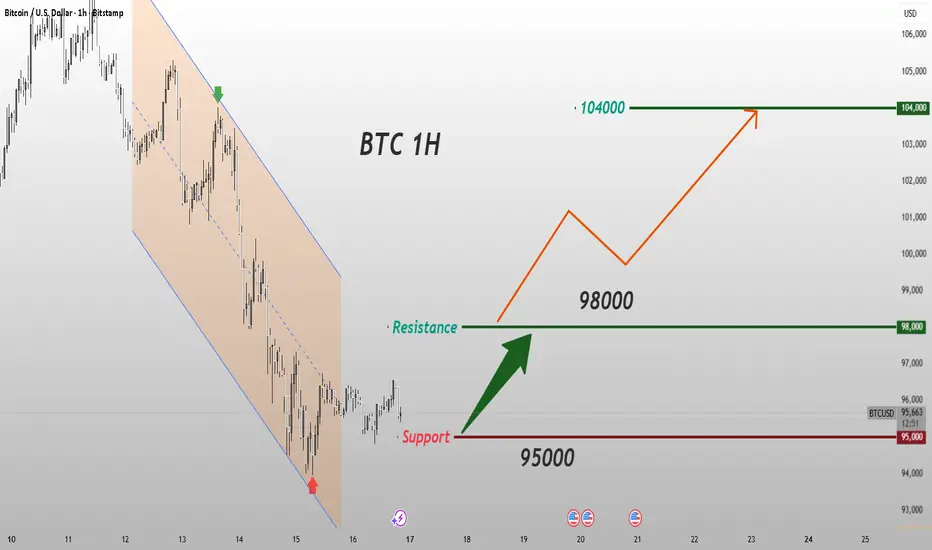
Core Logic for Short-Term Long PositionsCore Logic for Short-Term Long Positions
1.Distinct Sentiment Rebound Signals After BottomingMarket sentiment is near the historical bottom zone. Amplified negative talks on social media and retail investors’ phased withdrawal are typical signs before repeated market stabilization after stopping declines. The NUP ratio has fallen to 0.476. This range has repeatedly marked short-term bottoms historically, spurring several double-digit rebounds over the past year and offering sufficient room for sentiment recovery.
2.Resonant Technical Support with Strong TenacityAs the 0.618 Fibonacci Retracement of the recent downtrend, $94,200 proved effective as support in Q4 2024. It rebounded sharply after hitting $94,000 this time, forming a solid support. Now the price has firmly held the key short-term support at $95,543. The shrinking MACD Histogram signals fading bearish momentum and emerging bullish counterattacks, laying solid technical ground for a rebound.
3.Latent Upsides in On-Chain Data and Capital FlowOn-chain data reveals mid-and-small BTC holders (1 - 1000 BTC) have kept net accumulation since early October, while "smart money" is positioning via the pullback. Though the market is in the doldrums, the OTC market has stable receiving capacity and no large-scale panic selling, providing basic capital backup for the short-term rebound.
Bitcoin trading strategy
buy:95000-96000
tp:97000-98000
sl:93500
BTCUSD H1 | Bearish Continuation SetupMomentum: Bearish
The price has rejected the sell-entry zone, confirming it as a valid pullback resistance level.
Sell Entry: 99,535.24
Pullback resistance
Stop Loss: 101,191.20
Pullback resistance
Take Profit: 94,301.22
Pullback support
100% Fibonacci projection
High Risk Investment Warning
Stratos Markets Limited (tradu.com ), Stratos Europe Ltd (tradu.com ):
CFDs are complex instruments and come with a high risk of losing money rapidly due to leverage. 70% of retail investor accounts lose money when trading CFDs with this provider. You should consider whether you understand how CFDs work and whether you can afford to take the high risk of losing your money.
Stratos Global LLC (tradu.com ): Losses can exceed deposits.
Please be advised that the information presented on TradingView is provided to Tradu (‘Company’, ‘we’) by a third-party provider (‘TFA Global Pte Ltd’). Please be reminded that you are solely responsible for the trading decisions on your account. Any information and/or content is intended entirely for research, educational and informational purposes only and does not constitute investment or consultation advice or investment strategy. The information is not tailored to the investment needs of any specific person and therefore does not involve a consideration of any of the investment objectives, financial situation or needs of any viewer that may receive it. Past performance is not a reliable indicator of future results. Actual results may differ materially from those anticipated in forward-looking or past performance statements. We assume no liability as to the accuracy or completeness of any of the information and/or content provided herein and the Company cannot be held responsible for any omission, mistake nor for any loss or damage including without limitation to any loss of profit which may arise from reliance on any information supplied by TFA Global Pte Ltd.

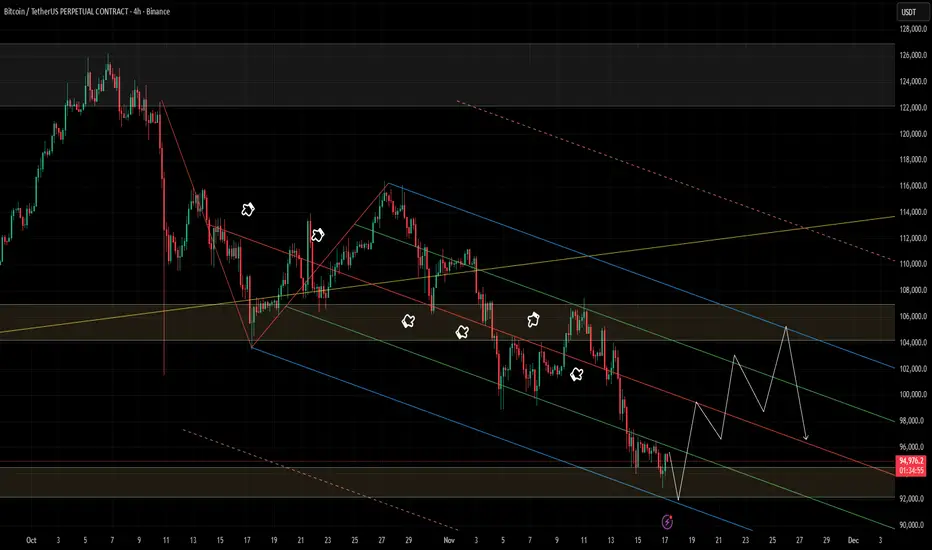
The Market Is Loading Up for a Breakout… Here’s the Exact TargetUltra-Detailed Professional Analysis
Based on the visible structure, the chart is showing signs of a local exhaustion of bearish momentum and the early formation of a bullish reversal structure. Here is the full breakdown:
---
1. Market Structure Shift (MSS)
The price has been in a continuous downtrend, making lower highs and lower lows. However, in the most recent area (where you drew the black diagonal line), the slope of the lows is starting to flatten.
This flattening implies:
Bearish pressure is weakening
Selling is no longer accelerating
Buyers are starting to absorb liquidity at the lows
This is typically the earliest sign of a possible market structure shift.
---
2. Bullish Divergence Signatures
Even though your screenshot doesn’t show indicators, the shape of the price movement suggests a classic divergence setup:
Price is making equal lows or slightly lower lows
Momentum is decreasing (suggested by slowing downward volatility)
This often precedes a short-term bullish push into nearby resistance zones.
---
3. Liquidity Mapping
The clustered price action under the descending structure suggests the market is:
Gathering sell-side liquidity beneath the recent lows
Preparing to use that liquidity for a stop-run and reversal
The red arrow you drew aligns with a typical liquidity-based move:
break out of the diagonal, collect stops, then push upward into a liquidity pocket.
---
4. Imbalance (Fair Value Gap) Above Price
The chart shows a noticeable price void / imbalance above the current level.
Markets often retrace to fill these inefficiencies.
The blue line at the tip of your arrow sits right inside this imbalance zone, making it a high-probability magnet for price.
---
5. Supply & Demand Mapping
You have several purple zones drawn above — these appear to be:
Old supply clusters, created during previous sell-offs
Untested levels, meaning price hasn’t fully revisited them yet
Markets often return to untested supply/demand zones due to:
Algorithmic targeting
Liquidity replenishment
Market maker rebalancing
Your blue level aligns with this higher-timeframe supply magnet.
---
6. Break of the Micro-Downtrend Line
The black diagonal line you drew marks the local bearish control zone.
A breakout above this line often triggers:
Short covering
Breakout buying
Acceleration into the next liquidity pool (your blue line)
The chart suggests the market is coiling beneath this line, indicating a possible compression → expansion move.
---
7. Volatility Compression Pattern
The price action in the last segment is contracting.
Compression almost always leads to explosive directional expansion.
Given:
A flat support base
Weakening bearish momentum
Clear imbalance above
…the higher probability expansion direction is upward.
---
Final Professional Summary
The reason the price is expected to move toward the blue line above the arrow is due to a confluence of bullish catalysts:
✔ Weakening bearish momentum
✔ Market structure flattening
✔ Liquidity buildup below & liquidity vacuum above
✔ Imbalance (FVG) acting as a price magnet
✔ Untested supply zones overhead
✔ Volatility compression preceding expansion
Together these create a high-probability short-term bullish corrective move toward the level marked in blue.
---
If you liked this analysis, leave a like and drop a comment to share your thoughts!
