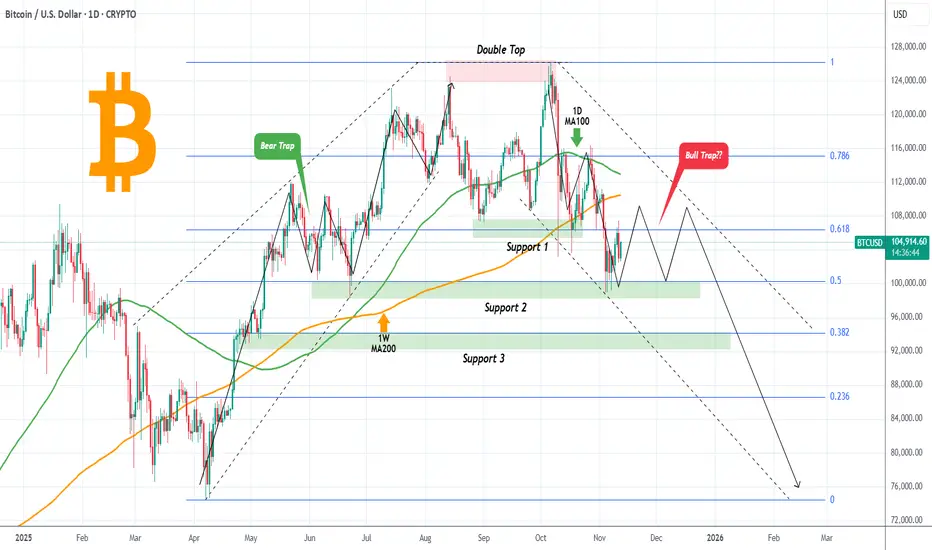
BITCOIN Is it following a symmetric downtrend?Bitcoin (BTCUSD) recently broke below the $100000 level for the first time since June and is currently on a short rebound. It has turned however all major MAs both the 1D MA100 (green trend-line) and 1D MA200 (orange trend-line) into Resistances, so the downtrend remains.
By doing so, we can see a highly symmetric pattern emerging, the inverse of the April - August uptrend. Following the (nearly) October 06 Double Top, the symmetrical downtrend has been testing and respecting all subsequent Support levels (so far Support 1 and 2), filling at the same time all Fibonacci gaps. See how accurately those Fibs formed key demand levels during the uptrend.
As a result, if this symmetry continues to hold, we can expect BTC to trade sideways for another month between Support 2 (Fib 0.5) and $110000 (roughly) before making the next leg down. Such price behavior typically confuses market participants and traps traders who stick to the former trend and haven't adapted yet.
Will it happen this time also and this potential ranged trading trap more buyers? Feel free to let us know in the comments section below!
---
** Please LIKE 👍, FOLLOW ✅, SHARE 🙌 and COMMENT ✍ if you enjoy this idea! Also share your ideas and charts in the comments section below! This is best way to keep it relevant, support us, keep the content here free and allow the idea to reach as many people as possible. **
---
💸💸💸💸💸💸
👇 👇 👇 👇 👇 👇
1-BTCUSD
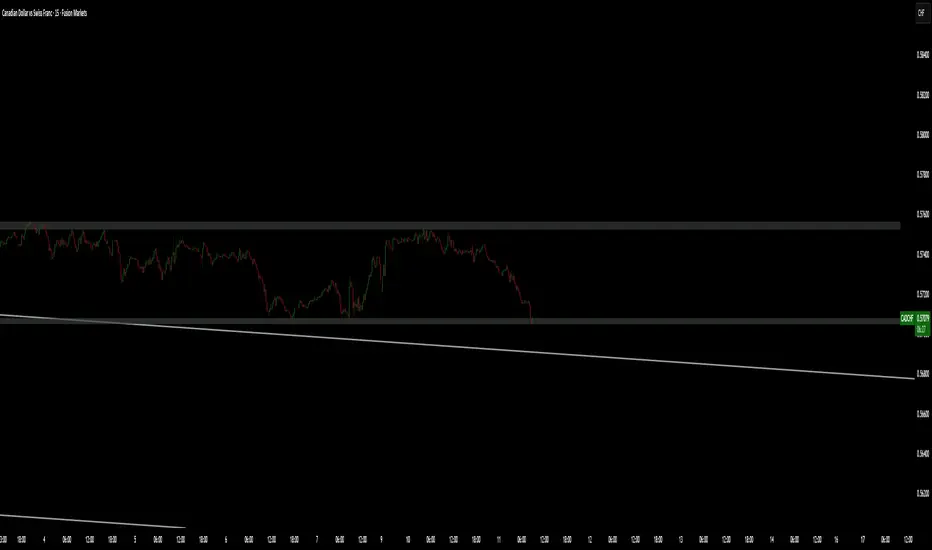
GBPCHFGBPCHF at a major SUPPORT zone. Getting some confirmation for reversal. Also looking for a Break of pattern.

Bullish bounce off?Bitcoin has bounced off the pivot, which aligns with the 61.8% Fibonacci retracement level, and could rise toward the 1st resistance, a pullback resistance level.
Pivot: 102,390.83
1st Support: 100,660.86
1st Resistance: 104,944.61
Disclaimer:
The opinions given above constitute general market commentary and do not constitute the opinion or advice of IC Markets or any form of personal or investment advice.
Any opinions, news, research, analyses, prices, other information, or links to third-party sites contained on this website are provided on an "as-is" basis, are intended to be informative only, and are not advice, a recommendation, research, a record of our trading prices, an offer of, or solicitation for, a transaction in any financial instrument and thus should not be treated as such. The information provided does not involve any specific investment objectives, financial situation, or needs of any specific person who may receive it. Please be aware that past performance is not a reliable indicator of future performance and/or results. Past performance or forward-looking scenarios based upon the reasonable beliefs of the third-party provider are not a guarantee of future performance. Actual results may differ materially from those anticipated in forward-looking or past performance statements. IC Markets makes no representation or warranty and assumes no liability as to the accuracy or completeness of the information provided, nor any loss arising from any investment based on a recommendation, forecast, or any information supplied by any third party.

Bitcoin 100k scenarioA scenario where it gets to 100k by end of year. Just saving this up there))
needs to be led by the important moving averages (50ma, 200ma...). lets go!

Bitcoin Rebounds — channel breakout signals!Have a good day, Traders! It's Leo. Let's look at the current BTCUSDT chart
Valid Support Zone: 98,000 – 102,000 — Price has formed a clear double-bottom structure here.
Breakout confirmation: Price has broken above the descending channel and both EMA20/50.
Next resistance / target: 115,000 — previous supply area aligning with major liquidity.
→ Short-term structure favors a bullish continuation as long as support holds.
Despite short-term volatility, Bitcoin remains supported by improving risk sentiment as U.S. yields retreat and Fed officials hint at a potential policy pause.
Scenario: A successful retest of the breakout zone could trigger momentum toward the 115K resistance. Holding above 102K keeps the bullish structure intact.
Bulls seem to be regaining control — will this momentum extend toward 115K? What’s your outlook for BTC this week?

Bitcoin Reverses off Previous Support Turned ResistanceBitcoin’s recent decline has brought price action back toward the crucial $100,000 psychological and horizontal support zone, an area that has held firm multiple times since May. The daily chart shows that price briefly dipped below this level but quickly recovered, forming a potential short-term base.
The 50-day SMA (blue) has turned lower and now sits above current price, suggesting weakening medium-term momentum, while the 200-day SMA (red) continues to act as dynamic support near $103,900. A sustained close below the latter could shift the broader structure toward a more prolonged consolidation phase.
From a momentum standpoint, the MACD remains below the signal line and in negative territory, reflecting persistent bearish pressure, although histogram bars are showing early signs of contraction. The RSI is currently near 38, hovering just above oversold conditions, indicating that sellers may be losing strength in the short term.
Overall, Bitcoin remains in a neutral-to-bearish phase, trading between $100,000 support and $107,300 resistance. A decisive breakout beyond either boundary could define the next directional move.
-MW

BTC/USD 1D Chart🧭 Overall Market Picture
Bitcoin is in a medium-term downtrend, as confirmed by:
a descending channel (marked with white lines),
lower highs and lower lows,
price below the key EMA and SMA.
The price is currently testing the upper boundary of this channel, so it will be crucial whether it manages to break out of it to the upside or rebounds further down.
🔹 Key Price Levels
Support:
$100,650 — short-term support, previously seen price reactions.
$98,550 — next demand level from late October.
$96,950 — lower boundary of the descending channel, potential target for continued declines.
Resistance:
$106,300–$106,500 — current resistance (upper boundary of the channel + SMA100).
$109,700–$110,000 — strong resistance converging with the EMA200 and SMA200.
$112,000+ — channel breakout and trend change.
🔸 Technical Indicators
1. MACD
The histogram is starting to turn positive (descending red).
The MACD line is attempting to cross the signal from below — a potential bullish signal, but not yet confirmed.
➡️ Indicates a possible short-term upward correction within a downtrend.
2. RSI (14)
Value: ~40.5 — low, but has rebounded from oversold levels.
No bullish divergence, but the RSI is rising from below, suggesting a potential technical bounce.
➡️ Still more upside than downside before entering the overbought zone.
🔹 Moving Averages
EMA50 (~109,970 USD) and EMA200 (~110,380 USD) are above the price, confirming the downtrend.
The EMA50 < EMA200 cross holds – a classic death cross.
SMA100 (~106,300 USD) has just been tested – a key level that could determine the direction of the coming days.
🔸 Short-Term Scenarios
🟩 Bullish (30–40% chance)
Breakthrough of the upper channel line (~106.5k USD) + daily close above 107k USD.
Confirmation of the MACD and RSI signal > 50.
Targets: 109,700 → 111,500 → 113,800 USD.
➡️ A medium-term trend reversal is then possible.
🟥 Bearish (60–70% chance)
Bounce from the upper channel line and fall below 102k–101k.
Continuation of the downtrend.
Targets: 100,600 → 98,500 → 96,900 USD.
➡️ In this scenario, the market will maintain a lower high/lower low structure.
⚙️ Summary
Trend: Down, but with a short-term rebound attempt.
Key moment: reaction to the 106k–107k USD level.
If the channel with volume breaks, a bullish reversal.
If a rebound, a new low around 97k–99k USD is very possible.

$BTC bounce before further selloffAs you can see from the chart, BTC formed a falling wedge and looks set to breakout to the upside from it.
I've marked off areas of resistance, but I think if we do get a breakout, the areas you'll want to take profit are $117k and $121-122k as the most likely areas for price to reject.
I think at those levels, you'll want to derisk or set stop losses, because I think it's likely that we can fall a lot further.
The trigger to go short would be losing the diagonal trend line that goes all the way back to October 2023 when the start of the bullish move happened. A move below that trend line should indicate the bullish move is finished and I think that we could potentially move down to the $60k-72k support levels.
I've marked off a lower resistance at $30k, just incase we see an extreme move in the worst case scenario.
Let's see how it pans out over the coming months.

BTC SETUP IDEAIm waiting for price to reach the OB + FVG zone Below, if price react there, maybe another Leg up

Bitcoin Bearish Reversal Toward 104,000 TargetThis chart shows a potential bearish setup for Bitcoin (BTC/USD). After reaching resistance near 106,950, the price is expected to pull back towards the 105,200 support zone and possibly drop further to the 104,000 target level, highlighted by the large downward arrow.

BITCOIN Weekly line charttells a story of 4 discernible patterns and 4 log targets.
1) The inverse head & shoulders to end the bear market
2) A broadening rising flag .... which at the time, many thought it was head and shoulder's top on the candle chart.
3) A small sideways flag
4) and the current frustrating broadening descending bull flag. Which has cause much grief to participants but will likely gives an explosive quick large moves.
As you can see putting the chart can help in identifying trends.. key highs and lows and also gives patterns that may not be visible on a candle chart.
Another tool in your toolbox.

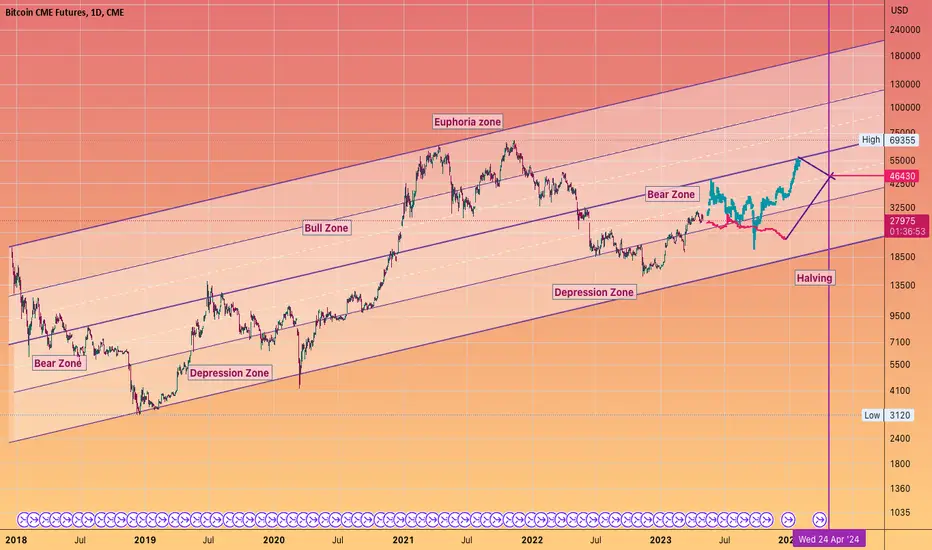
#BITCOIN pathways for the halveningroute 1
or route 2
or a new pathway (Most likely)
next April we will be at $50k
BITCOIN WYCKOFF accumulationscenariocast!
IF that is what is occuring ... the #BTC price over the next few months could follow something similar to what I have drawn in a #Wyckoff re-accumulation range and breakout.
With the recent price action being a false breakdown before recapturing the range and proceeding to reach previous levels of resistance.
Let's see if this occurs, sentiment reached rock bottom last week.
SO I would not be surprised!

BITCOIN in a LIVERMORE FunnelThe accumulation and distribution volume matches the positive and negative money flows of the first 5 waves in a Jesse Livermore stock cylinder.
Will wave 6 see a rush of positive money flow into #Bitcoin into the end of the year?
Let's see
If it does
then that will further cement this pattern of accumulation , sideways movement then breakout with continuation of buying power into the Bull market top.
Let's observe this in real time shall we?
Should be a fun few months ahead of us after a long period of churn.
S/O to @arvine11 for bringing up the Livermore stock trend analysis.

Bitcoin #BTC The key level to launch the Bull market...is $34500
The 50% drawdown level from the previous cycle laugh
let see if it can repeat the 3rd time
We assume this is going to happen leading up and post #halvening
But open to a quickening of this timeline because #ETF news driving the hype even quicker

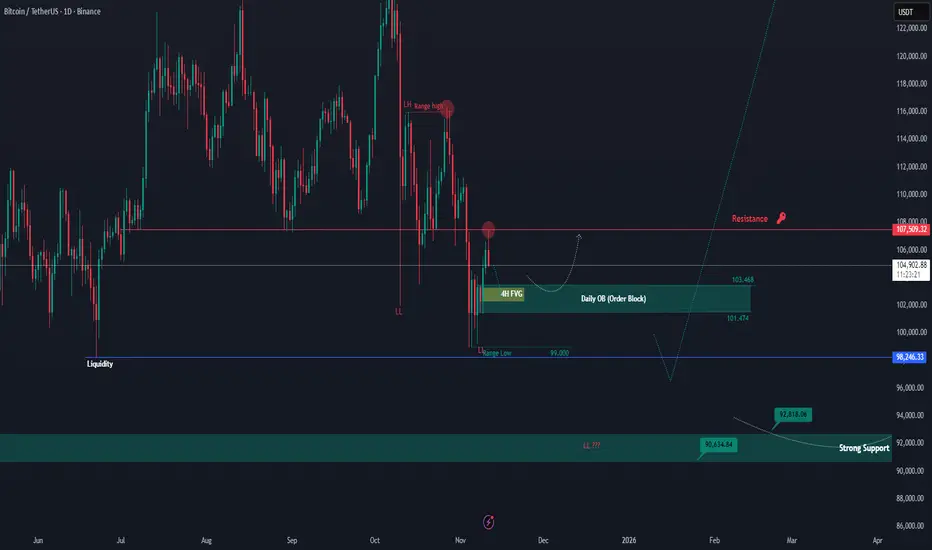
BTCUSDT – Retesting Key Levels After Resistance RejectionAs expected, BTC successfully closed above the $100K mark on the daily timeframe and moved up to retest the major resistance zone around $107,500. However, the price faced a clear rejection from this level, confirming that it remains a strong resistance area which Bitcoin must break to resume its upward momentum toward $110K–$112K.
Currently, BTC is showing signs of a potential pullback toward the Daily Order Block (OB) area near $103K–$101K. This zone will be crucial to watch — if the price reacts positively and rebounds, it could signal another push to retest the $107K resistance. On the other hand, a breakdown below this OB may open the door for a deeper retracement toward the $100K zone or even lower, possibly targeting the liquidity around $98K.
For now, BTC remains in a short-term corrective phase within a larger bullish structure. The reaction from the Daily OB zone will likely determine the next major move.
Bitcoin in the Channel of Truth — Levels Mapped, Eyes on 106.261Yesterday's exit was clean — rejection + Bitcoin dominance on support. Let’s break it down 🔍
📊 Bitcoin Dominance
Currently bouncing off key support at ~59.76 . Unless this level is lost, altcoins likely stay weak.
Dominance rising = no altseason. When it dumped last time, Ethereum exploded. Today? We're neutral to bullish on BTC.
🪜 Bitcoin Chart Setup
Big picture:
In a descending macro channel
Inside it, a smaller ascending channel = current trade zone
📌 Key Levels for Day Trading:
Support: 105,000
Mid-level: 106,261
Resistance: 107,000
Macro Bull Trigger: 109,898
Macro Bear Trigger: 104,405
If we lose 104,405 — short time.
If we reclaim 106,261 — stay long.
🧠 Momentum + divergences + my FxProfessor MA combo are pointing higher. So yeah — I expect 106.2K to get tapped today.
📍 Alerts are ON. Precision mode.
💬 Today’s a double day — 11.11. Is 111,111 next? You tell me.
Just play your levels. I do.
Mindset Check 🧘
If you’re guessing, you’re gambling.
I don’t guess. I read structure, I react, I act.
Want to survive this market? Play like it’s chess, not roulette. Not sure where it's going? Hedge!
Disclaimer
Hey — I’m a day trader. I play the levels. I don’t know what you’re doing i just share what I do!
One Love,
The FXPROFESSOR 💙

BTCUSD Rally capped at 107,150 resistanceThe BTCUSD remains in a neutral trend, with recent price action showing signs of an oversold rally within the broader range trading.
Support Zone: 100,780 – a key level from previous consolidation. Price is currently testing or approaching this level.
A bullish rebound from 100,780 would confirm ongoing upside momentum, with potential targets at:
107,152 – initial resistance
108,847 – psychological and structural level
110,900 – extended resistance on the longer-term chart
Bearish Scenario:
A confirmed break and daily close below 100,780 would weaken the bullish outlook and suggest deeper downside risk toward:
99,140 – minor support
97,800 – stronger support and potential demand zone
Outlook:
Bullish bias remains intact while the BTCUSD holds above 107,152 A sustained break below this level could shift momentum to the downside in the short term.
This communication is for informational purposes only and should not be viewed as any form of recommendation as to a particular course of action or as investment advice. It is not intended as an offer or solicitation for the purchase or sale of any financial instrument or as an official confirmation of any transaction. Opinions, estimates and assumptions expressed herein are made as of the date of this communication and are subject to change without notice. This communication has been prepared based upon information, including market prices, data and other information, believed to be reliable; however, Trade Nation does not warrant its completeness or accuracy. All market prices and market data contained in or attached to this communication are indicative and subject to change without notice.

Bitcoin and a Critical Resistance for a Price Breakout | Day 3👋🏻 Hey everyone! Hope you’re doing great! Welcome to the SatoshiFrame channel.
✨ Today we’re diving into the 4-Hour Bitcoin analysis — stay tuned and follow along!
🪙 Bitcoin, in its 4-hour timeframe (as mentioned in previous analyses), is currently sitting below a major resistance level. A breakout above this area could trigger a strong bullish leg, potentially driving price toward forming a new ATH. The key resistance zone is around $106,590, and breaking it could lead to some beautiful market moves.
📊 The buying volume at this resistance is not yet sufficient. If we look closely, since the last touch of the maker-buyer zone at the lower part of the chart, volume has been declining. To break through this resistance, whale candles are needed to absorb all sell orders in the zone — this could lead to a short squeeze.
🧮 The RSI oscillator on the 4-hour timeframe has fluctuated several times below the 70 level, showing two rejections near that area. The 70 RSI level aligns with the $106,590 price resistance, and crossing above it could trigger a strong upward move.
✍️ You can read the possible scenarios for Bitcoin in the rest of the analysis, but since Bitcoin has shown reduced buying volume, it’s best to lower your risk exposure. If the breakout happens, you can reallocate remaining risk toward the next resistance levels.
✅ Long Position Scenario:
A confirmed breakout above $106,590, along with increased buying volume and the RSI surpassing 70, could form a solid long setup on the 4-hour timeframe. Make sure to gather proper confirmations before entering to ensure the best possible trade setup.
❤️ Disclaimer: This analysis is purely based on my personal opinion, and I only take trades when the stated triggers are activated.
BTC and Macro Environment · Optimism Creeps Back InThe macro environment is warming up again. Traders are slowly adding risk as Bitcoin BITSTAMP:BTCUSD holds above $100K and Ethereum COINBASE:ETHUSD shows rising retail activity. Altcoins are regaining liquidity, and sentiment feels like cautious optimism.
What’s driving this shift? Money.
Talk of new stimulus checks and potential rate cuts are fueling bullish expectations. The idea is simple: more liquidity means stronger risk appetite. But this comes with a catch. Fiscal math doesn’t add up cleanly. With tariffs bringing in $224.7B and proposed stimulus near $400B, inflation fears could return fast if spending isn’t balanced.
The U.S. government’s reopening adds another layer. Once the Treasury starts releasing the $1 trillion parked in its account, liquidity will flow again into agencies and contractors. This real injection supports a bullish tone across markets, including crypto.
On the chart above, Bitcoin’s 50-week simple moving average (50W SMA) is the key signal. BTC closing above it suggests the long-term uptrend remains intact. Historically, this level marks early bullish phases, not tops. If it holds, traders may stay long but cautious, watching for shifts in Fed tone or inflation data.
Overall, the crypto market is showing signs of recovery. Liquidity is improving, technicals look stable, and optimism is back, but not overheated. It’s not 2021 euphoria, just steady confidence built on real macro shifts.
Stay focused, manage risk, and don’t rush. The setup looks bullish for now, but caution still pays.
TheCryptoFire

BTC 1H – Falling Wedge, Key Levels AheadFalling wedge pattern playing out, with bullish momentum potentially retesting resistance around 107-109k levels.
Technical Overview
After a prolonged downtrend, BTC is showing signs of reversal inside a classic falling wedge pattern. Price action indicates a possible attempt to break above immediate resistance.
A golden cross appeared recently (50/200 MA bullish cross on the hourly), which often acts as a short-term momentum trigger.
Reclaiming and holding the 105k level signals a possible weekly swing low, especially after the sweep below the significant 100k range.
Horizontal resistance lies around 107k–109k, aligning with the upper wedge boundary and serving as a critical decision zone.
Positives
Golden Cross: The 50 and 200 moving averages just crossed bullish on 1H, often providing initial optimism for follow-through momentum.
105 Level: Holding/reclaiming 105k can confirm that the latest sweep below 100k was the liquidity grab to establish a new swing low.
Bullish Confirmation: Sustained strength above the 110k resistance flips structure to bullish and could open up further upside.
Negatives
Weak Breakout: The current move higher from the lows appears tentative rather than strong, risking a failed breakout.
Pattern Risk: Despite the breakout attempt, BTC remains technically inside the falling wedge—with potential for further compression or downside.
CME Gap: There’s an open CME gap still lurking at 92k, which remains a risk magnet if price loses structure.
Double Resistance: The 109k level is strong resistance, previously tested and rejected, which could stall bulls and trigger another rejection.
Trade Scenarios & Framework
Bullish Above 111k: Clean break and hold above 111k invalidates the wedge and signals strong continuation potential.
Bearish Below 103.5k: Failure to sustain above 103.5k increases the risk of a lower retest toward 100k and possibly the CME gap at 92k.
Neutral 104k–111k: Price action within this range is likely to chop and backtest key support/resistance, favoring mean reversion or short-term tactical plays.
If we see rejections above 105k, expect a move to retest the recent swing lows; a strong reclaim above 110k would confirm renewed bullish momentum.
At present, BTC is transitioning from bearish into neutral territory—waiting for structure and follow-through to confirm direction.
Profit targets and stop loss areas should be adjusted according to personal risk tolerance, but using 103.5k as a bear line and 111k as a clear bullish confirmation threshold is suggested for defining bias.

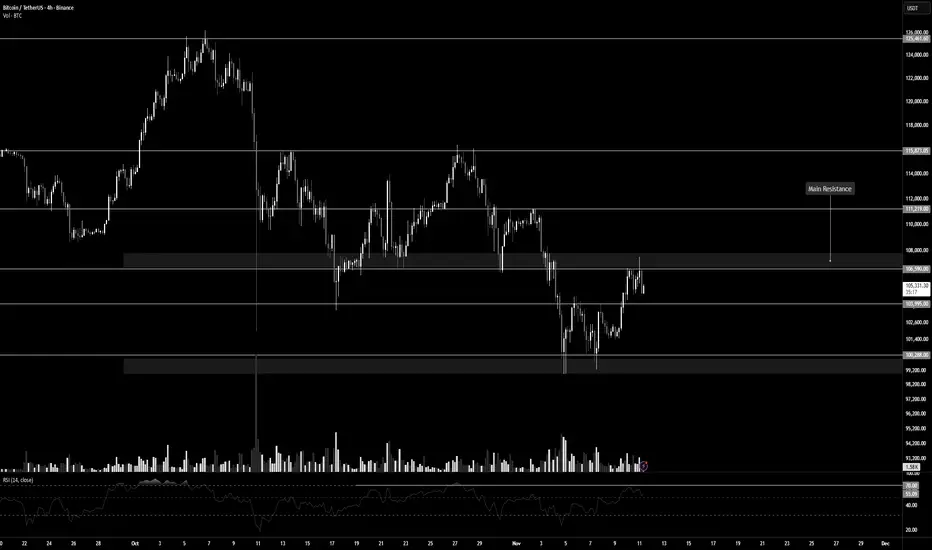
ANFIBO | BTCUSD - Still in a boring range [11.11.2025]Hey guys, Anfibo's here!
BTCUSD Analysis – Daily Trading Plan
Overall Picture:
The prior sell at $107,000 executed according to plan and produced a clean, profitable outcome — well done to those who took it and locked in gains. Currently BITSTAMP:BTCUSD is trading in a sideways, slightly upward-drifting range as liquidity is being gathered beneath the upper trend boundary. Momentum is constructive but not yet impulsive; therefore the highest-probability edge today is to wait for price to touch the established trendline and read the reaction there before committing to fresh short exposure.
Trading Plan for Today:
>>> BUY ZONE:(x1000)
ENTRY: 104 - 105
SL: 103
TP: 110
>>> SELL ZONE: (x1000)
ENTRY: 109 - 110
SL: 111.5
TP: 104 - 95
Risk Management:
- Risk a controlled percentage of equity per trade (e.g., 1–2% max capital risk per position) and size positions so SL distance equals the planned risk.
- Scale sizing: take a smaller initial position at Entry (1) and add selectively at Entry (2) only after clear bearish rejection or failed retest.
- Use tight, logical SLs (as listed) and consider moving SL to breakeven once TP1 is achieved to protect gains.
- Monitor intraday volatility and major news — reduce size or sit out if market structure becomes erratic or if a scheduled macro event is imminent.
Conclusion:
The market rewarded our prior sell at $107k — a good example of discipline and structure-based trading. Today’s plan remains conservative: let BTC approach the trendline / upper channel, observe price reaction, and initiate short exposure only on a clear rejection or failed retest. Maintain strict risk controls, scale thoughtfully, and avoid averaging into a losing trade. This patient, reaction-based approach keeps the odds in our favor while respecting the prevailing range dynamics.
HAVE A NICE DAY, GUYS!
