Be careful with bitcoin !!!As you can see, the price has dropped significantly after breaking the head and shoulders pattern, and now,with some price stabilization—it could potentially return to its previous highs
1-BTCUSD

Wider Range or Early Trend Reversal in Multi-Timeframe?👋🏻 Hey everyone! Hope you’re doing great! Welcome to SatoshiFrame channel.
✨ Today we’re diving into the 15-Mimutes Bitcoin analysis. Stay tuned and follow along!
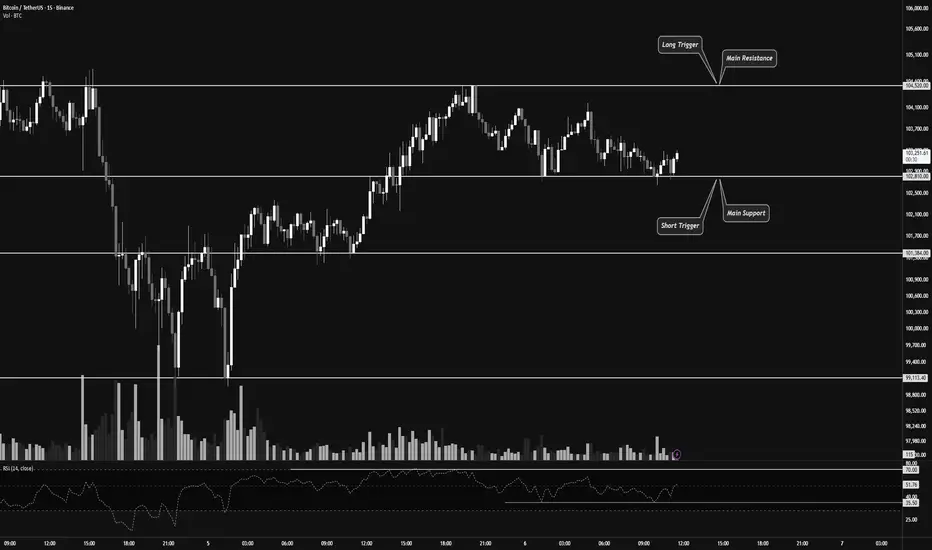
👀 On the 15-minute timeframe of Bitcoin, we can see that after recent declines, BTC has entered a 15-minute trading range. The top and bottom of this range act as our long and short triggers. Keep in mind that Bitcoin’s next move could potentially develop into a long-term directional move.
🧮 Looking at the RSI oscillator, the 70 level serves as confirmation for a long trigger, while the 35.5 level confirms a short trigger. Note that RSI confirmation based on its momentum swings can provide higher-quality trade setups.
🕯 Selling volume has increased slightly as Bitcoin approaches its resistance zone at $104,520, and we’ve seen a similar reaction when price hits resistance from below. This indicates buyer hesitation and stronger seller activity.
Meanwhile, buying volume has risen as price nears the support zone around $102,810. If this buying pressure continues, it could confirm an extended range formation in this area.
✍️ As in previous setups, Bitcoin’s potential scenarios remain straightforward. With proper RSI confirmation, we can look for entry opportunities.
🟢 Long Scenario : A breakout above the $104,520 resistance zone, accompanied by increasing buying volume and RSI exceeding the 70 level on the 15-minute multi-timeframe, could signal a long trade.
🟥 Short Scenario : A breakdown below the $102,810 support zone, with rising selling volume and RSI dropping below the 35.5 level, could trigger a short trade.
❤️ Disclaimer : This analysis is purely based on my personal opinion and I only trade if the stated triggers are activated .

BTC-----Sell around 104500, target 103000 areaBTC Contract Technical Analysis, November 6th:
On the daily chart, yesterday's close was a small positive candle, with a pattern of consecutive negative candles followed by a single positive candle. The price is below the moving average, and the accompanying indicators are in a death cross, indicating a clear downward trend. As previously mentioned, the weekly chart also shows a clear downtrend. Therefore, the strategy is to sell at higher prices and focus on the impact of news and data, avoiding counter-trend trades. On the hourly chart, yesterday's Asian session saw a price rebound from support, which continued into the day, but the momentum was weak and the price failed to break the high. Currently, the Asian session has seen a slight pullback without further continuation, and while the momentum is weak, it doesn't affect the overall trend. The European session is expected to see a further decline and breakout.
Today's BTC Short-Term Contract Trading Strategy:
Sell at the 104500 area, stop loss at the 105000 area, target at the 103000 area.

Bitcoin Weekly Technical Analysis Report $BTCBitcoin Weekly Technical Analysis Report BINANCE:BTCUSDT
Background Overview
Bitcoin (BTC) has become the most influential digital asset globally due to its decentralization, fixed supply, and transparent transactions. At the intersection of traditional finance and the crypto market, Technical Analysis (TA) is a crucial tool for investors to assess price trends and develop trading strategies. Based on the three key assumptions—“history repeats itself,” “price moves in trends,” and “market action discounts all information”—technical analysis uses chart patterns, trend lines, support and resistance levels, volume, and various indicators to make probabilistic forecasts about future price movements.
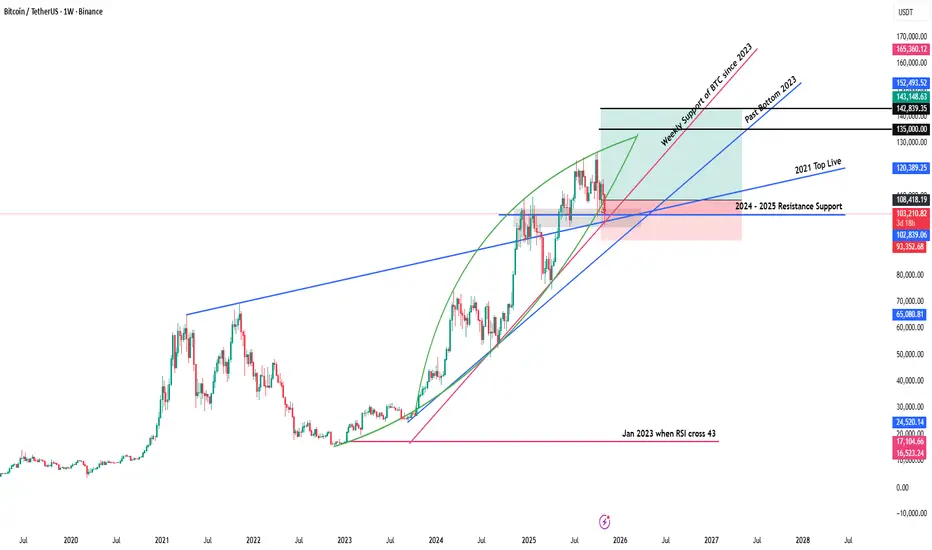
The weekly chart, as a core time frame for medium- to long-term trend analysis, filters out noise from daily and lower time frames, providing a clearer view of the main trend direction, key turning points, and the balance between bulls and bears. The BTC/USDT weekly chart analyzed here (from TradingView) covers price movements from 2023 to the present. It includes annotations such as “Weekly Support of BTC since 2023,” “Past Bottom 2023,” and “2024–2025 Resistance Support,” along with green and pink shaded areas that visually represent different stages of market psychological levels.
Currently, Bitcoin is priced at 103,384.25 USDT, with a weekly decline of -6.47% and a weekly volume of 118,000 USDT. From the chart structure, the price is near the 2024–2025 resistance-turned-support zone while being supported by the ascending trend line that has formed since 2023. The battle between bulls and bears is intense in this range, and price movements over the coming weeks will have a decisive impact on the medium- to long-term trend.
This report will combine key support and resistance levels, trend lines, volume, and technical indicators from the chart, compare historical patterns with the current market environment, conduct an in-depth analysis from multiple perspectives, and propose corresponding strategic recommendations and risk warnings.
Research Support and Evidence Analysis
This analysis is strictly based on the technical elements and relevant market data presented in the chart, with the following key supporting points:
• Current price and change: 103,384.25 USDT, weekly decline of -6.47%, indicating short-term bearish dominance, but the price has not yet broken key support.
• Weekly volume: 118,000 USDT, which has expanded compared to the recent average, suggesting increased market participation and greater divergence between bulls and bears.
• Key support levels:
– “Weekly Support of BTC since 2023” trend line: An ascending trend line connecting the weekly lows since 2023, currently around 100,000 USDT, providing important support.
– “Past Bottom 2023” zone: The 2023 Bitcoin low accumulation area, around 95,000–98,000 USDT, serving as the last line of defense for bulls.
• Key resistance levels:
– “2024–2025 Resistance Support” level: Previous high points where price repeatedly failed to break through, around 110,000–115,000 USDT, now acting as resistance.
– Pink resistance zone: Corresponds to historical accumulation areas and Fibonacci extension levels, around 118,000–122,000 USDT, serving as both a target for bulls and a point for bears to counterattack.
• Trend line analysis:
– Main ascending trend line: Extending upward from the 2023 low with a moderate slope, reflecting the medium- to long-term bullish trend.
– Secondary descending trend line: Connecting the late 2024 and early 2025 highs, forming a short-term descending channel; the price is currently approaching the upper boundary of this channel.
• Volume confirmation:
– When the 2023 support zone formed, volume gradually decreased, indicating easing selling pressure.
– When breaking through resistance in 2024, volume expanded significantly, confirming the validity of the breakout.
– During the current pullback, volume has expanded again, requiring vigilance against panic selling.
Data Comparison and Detailed Summary
To more intuitively present the relationship between key price levels and historical movements, the main support and resistance levels, trend lines, and volume characteristics are summarized as follows:
drive.google.com
From the table, it is clear that the support system formed in 2023 remains effective, while the resistance zone from late 2024 to early 2025 is pressuring the current price. Volume shows distinct patterns at different stages: decreasing at support zones, expanding on breakouts, and expanding again during pullbacks, reflecting cyclical changes in market sentiment.
Source Origin and Citation Interpretation
• Data authority: TradingView integrates real-time quotes from major global exchanges, ensuring the accuracy of price and volume data.
• Annotation professionalism: The trend lines, support and resistance zones on the chart are drawn by experienced analysts based on classic technical analysis methods such as historical highs and lows, accumulation areas, and Fibonacci retracements.
• Time frame representativeness: The weekly chart filters short-term fluctuations and is more suitable for medium- to long-term trend analysis, matching the decision cycles of institutional investors and long-term holders.
For labels such as “Weekly Support of BTC since 2023,” “Past Bottom 2023,” and “2024–2025 Resistance Support,” their origin is the chart drawer’s summary of historical key price levels. Although somewhat subjective, they align with the general definitions in technical analysis for “significant highs and lows” and “accumulation areas.” Therefore, interpretation should combine multiple verifications (such as volume and indicator confirmation) to reduce the risk of bias from single labels.
In-depth Insights and Independent Thinking
Combining the above data and chart features, deeper market insights can be gained from the following perspectives:
The medium- to long-term trend remains healthy
– The main ascending trend line has been extending upward from the 2023 low, and each pullback has not broken below it, indicating that the bullish structure is intact.
– The current price is approaching this trend line. If it can stabilize and rebound here, it will validate the effectiveness of the trend support and lay the foundation for the next upward wave.
The importance of the resistance-turned-support zone
– The 110,000–115,000 USDT zone repeatedly acted as resistance from late 2024 to early 2025. After being recently broken, it has turned into support.
– If the price can stabilize above this zone, it will further consolidate the bulls’ advantage and challenge the pink resistance zone (118,000–122,000 USDT).
Volume signals reveal market sentiment
– Volume decreased at the 2023 bottom, indicating exhausted selling pressure and paving the way for the subsequent rebound.
– Volume expanded during the resistance breakout, confirming increased market participation, while the current pullback’s expanded volume requires vigilance against panic selling.
– Future signs of stabilization with decreasing volume will present a better opportunity for bulls to enter.
Risks and opportunities coexist
– Short-term bears dominate, and the price is approaching the main ascending trend line. A breakdown below could trigger larger-scale stop-losses, targeting the 95,000–98,000 USDT zone.
– If the trend line support holds, combined with oversold signals from technical indicators, a wave of buying opportunities will emerge, with an initial target of 110,000–115,000 USDT.
Macro environment and market structure
– Global liquidity, regulatory policies, and institutional capital flows are exogenous variables affecting Bitcoin’s medium- to long-term trends.
– Although technical analysis can provide probabilistic judgments on price paths, it still needs to be combined with fundamental analysis and market sentiment to improve decision-making success rates.
Extended Discussion / Related Topics
In the current technical context, the following topics can be further explored:
• Multi-dimensional verification of technical indicators
– Relative Strength Index (RSI): Whether the weekly RSI is in overbought or oversold territory, and any divergence with price.
– Moving Averages (MA): The arrangement and divergence of the 50-week, 100-week, and 200-week MAs, and their confirmation of trend direction.
– MACD histogram and signal line: Weekly golden crosses and death crosses, as well as momentum changes in the histogram, indicating trend continuation or reversal.
• Fibonacci retracement and extension
– The role of Fibonacci retracement levels (38.2%, 50%, 61.8%) from the 2023–2024 main upward wave in the current pullback.
– If the price breaks above the pink resistance zone, the next targets can be referenced by Fibonacci extension levels (161.8%, 261.8%).
• Market sentiment and capital flows
– Can data such as futures open interest, funding rates, and exchange net inflows/outflows resonate with chart patterns?
– The impact of continuous buying by institutions like Grayscale and MicroStrategy, compared with the long-short ratio of retail leveraged funds, on medium- to long-term support and resistance.
• Risk management strategies
– Near key support and resistance levels, how to set stop-loss and take-profit to optimize risk-reward ratios.
– When volatility surges, should position size be adjusted, or derivatives like options be used for hedging?
• Future trend outlook
– If the price stabilizes above 110,000–115,000 USDT, the bullish target could extend to 130,000–150,000 USDT.
– If it breaks below the main ascending trend line and loses the 95,000 USDT support, a larger-scale correction may begin, with a downside target around 80,000 USDT.
Through in-depth exploration of the above topics, a more comprehensive investment decision framework can be constructed. On the basis of technical analysis, combining market structure and macro factors will improve the ability to predict price movements.
BTCUSD H1 | Bearish Drop OffBitcoin (BTC/USD) has rejected the sell entry at 104,504.68, which is a pullback resistance that lines up with the 59% Fibonacci retracement and could drop from this level to the downside.
Stop loss is at 105,308.55, which is a pullback resistance that lines up with the 61.8% Fibonacci retracemnt.
Take profit is at 98,945.84, which is a pullback support.
Stratos Markets Limited (tradu.com ):
CFDs are complex instruments and come with a high risk of losing money rapidly due to leverage. 68% of retail investor accounts lose money when trading CFDs with this provider. You should consider whether you understand how CFDs work and whether you can afford to take the high risk of losing your money.
Stratos Europe Ltd (tradu.com ):
CFDs are complex instruments and come with a high risk of losing money rapidly due to leverage. 70% of retail investor accounts lose money when trading CFDs with this provider. You should consider whether you understand how CFDs work and whether you can afford to take the high risk of losing your money.

Bitcoin : Stay heavy on positionsBitcoin : Stay heavy on positions (3x)
A signal for catching a bounce has emerged.
Within 1–2 weeks after the bounce signal, leverage is reduced from 3x to 2x.
** This analysis is based solely on the quantification of crowd psychology.
It does not incorporate price action, trading volume, or macroeconomic indicators.

BTCUSD – When the Whales Dump, Bitcoin Free-Falls Without BrakesHey traders,
The crypto market is once again in turmoil! Bitcoin has just dropped below $100,000 , its lowest level in months, after whales unloaded over $45 billion in positions — a powerful blow that shook the entire market.
At the same time, expectations for a Fed rate cut in December are fading , spreading a broad “risk-off” sentiment. Investors are pulling money out of risk assets, flowing instead into the USD and bonds, adding more downward pressure on crypto.
On the 4-hour chart, the bearish structure remains dominant. Price continues to move inside a descending channel , with the $104,600 area now acting as a critical short-term resistance. Every rebound has been swiftly rejected — a clear sign that the market isn’t ready for any meaningful recovery yet.
If price fails to retest and hold above $104,600, the next likely scenario is a drop toward $96,700, where the next major support zone lies.
Right now, the market looks like it’s exhaling after a leverage hangover . With both fundamental and technical pressure converging, the bearish trend remains the dominant direction for Bitcoin in the short term.

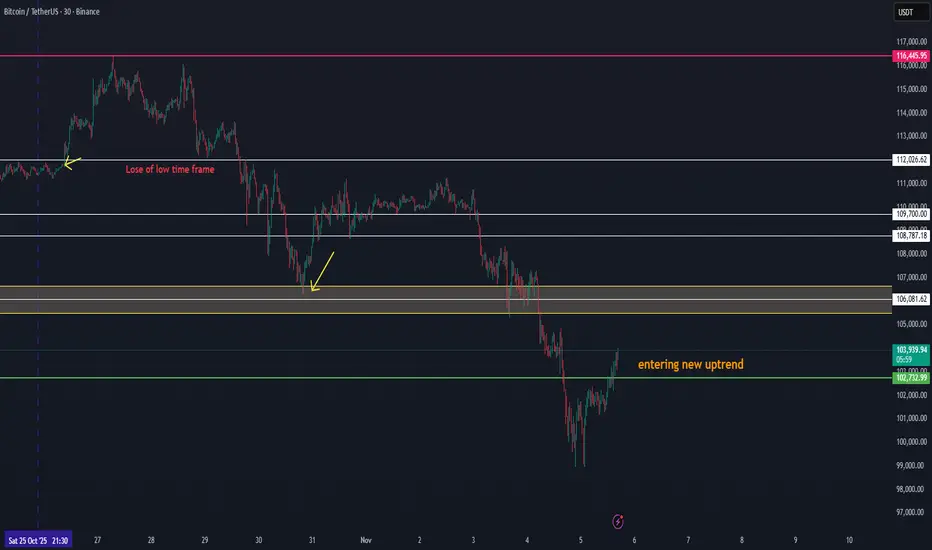
BTC Showing Early Signs of a New Uptrend Volume FormationBTC Showing Early Signs of a New Uptrend Volume Formation
Bitcoin is beginning to show new uptrend volume structure after a long corrective phase. This current movement around the 103K zone could be the first confirmation of renewed bullish momentum forming after the 110K area breakdown.
Here’s the technical context:
🔹 Structure: BTC has established a short-term higher low and is now attempting to build a new rising channel.
🔹 Volume Confirmation: The growing buy volume around 103K suggests early accumulation — this could mark the start of a new volume phase.
🔹 Targets: A sustained move above 103.8K–104.2K may confirm continuation toward 105K+, which would act as the first key resistance and validation of renewed market strength.
💡 Outlook:
If BTC maintains its current momentum and volume continues to rise, this could be the first stage of a new uptrend, with 105K+ as the initial upside target and potential re-entry toward the broader 110K recovery structure later.
Potential Short Setting Up on the 15 minute timeframeAs price makes new highs on the 15 minute time frame, I think there are potential shorting opportunities.
GOLD climbing.GOLD is starting to make it's way up in the NY session after news. Looking for new Higher Highs and Higher lows.

BITCOIN SIGNAL: NEXT WAVE IS INCOMING!!! (soon)Yello Paradisers, enjoy the video!
And Paradisers! Keep in mind to trade only with a proper professional trading strategy. Wait for confirmations. Play with tactics. This is the only way you can be long-term profitable.
Remember, don’t trade without confirmations. Wait for them before creating a trade. Be disciplined, patient, and emotionally controlled. Only trade the highest probability setups with the greatest risk to reward ratio. This will ensure that you become a long-term profitable professional trader.
Don't be a gambler. Don't try to get rich quick. Make sure that your trading is professionally based on proper strategies and trade tactics.

Bitcoin – Technical Outlook
🔹 Key Zone: 101,500 – 104,500
At the moment, price is trading within this key zone where strong buying and selling activity is taking place — a critical area that will likely determine the next major move.
🟢 Bullish Scenario (Uptrend)
If price breaks above and holds above 104,500, this would confirm a continuation of bullish momentum.
In that case, price is expected to move higher toward 120,040, with further potential extension toward 125,567.
📈 This zone is an important confirmation area that could signal the beginning of a new bullish leg.
🔴 Bearish Scenario (Downtrend)
However, if price drops below and stabilizes under 101,500, this would indicate a potential bearish reversal.
In that case, the price may move downward toward the support zone at 97,700 – 93,400.
Breaking below this area would confirm further bearish extension toward 88,080.
📊 Summary:
Currently, Bitcoin is trading inside the key zone (101,500–104,500).
A breakout above or below this range will likely define the next strong market direction — whether a bullish continuation or a deeper bearish correction.

BTC 1D Bitcoin is showing signs of a reversal on the 1-day timeframe, as confirmed by the subtrend support and subsequent momentum.

Bitcoin Daily Analysis #11 – November 05, 2025 Scared? 😅
Good — pay close attention to how you feel these days and journal everything. The most valuable financial lessons come exactly from moments like these. 📖
As you can see, Bitcoin is under heavy selling pressure, and its sharp drop around the $100,000 zone has so far been supported by buyers.
If that support breaks again, you could consider opening a short position, but ⚠️ don’t hold it too long — the overall trend remains bullish, and a strong rebound could follow.
Around $104,000, we might see a risky long trigger, but only with tight risk management and a controlled position size.
If Bitcoin tests $104,000 and gets rejected, a deeper correction or even a sharp drop could follow.
We’re in a phase where the market could swing both ways — once it breaks out of this uncertainty, expect a powerful move. ⚡
Macro data and recent economic news still favor Bitcoin, and interestingly, during this decline, the big players have mostly stayed on the sidelines, with lower-than-average trading volume. 📈
No matter which way Bitcoin moves, your risk management will determine your success. 🎯
So avoid emotional decisions and let the chart structure guide you. 📊
Disclaimer:
This content is for informational purposes only and does not constitute financial or investment advice. © DIBAPRISM
Larry D.Kohn

Educational BTC Analysis: Decoding BTC's Wave (C) DownHello Friends, Welcome to RK_Chaarts.
Today we are going to understand Elliott Wave Teaching Points from the BTCUSD Daily Chart,
This chart sequence perfectly illustrates the difference between motive (impulse) and corrective waves, as well as the important structures and rules of a larger correction.
1. The Structure of a Corrective Pattern (A-B-C)The Big Picture: The overall movement, labeled Intermediate Wave (A), (B), and (C) (Blue), is a three-wave corrective pattern. This type of pattern moves against the trend of one larger degree (which have been an uptrend). The three-wave (A-B-C) structure is the classic way markets move in a counter-trend. Wave (A): The initial counter-trend move.Wave (B): A bounce or retracement that moves back in the direction of the previous trend, but fails to reach the start of Wave (A).Wave (C): The final, and often most powerful, leg of the correction, which is designed to complete the retracement. This wave is always structured as a five-wave impulse.
2. The Rule of Subdivisions: Corrective Waves are Internally Motive, Wave (C) is an Impulse: The report states that Intermediate Wave (C) is expected to unfold as a five-wave impulse sequence of a Minor Degree (Red) (Minor Wave 1, 2, 3, 4, 5).
Learning Point: This highlights a fundamental Elliott Wave rule: the C-wave of an A-B-C correction is a motive wave (it has a five-wave internal structure) because its purpose is to create strong directional progress and complete the larger correction. This is commonly known as a Zigzag correction (which has a 5-3-5 internal count for A-B-C).
3. Identifying the Strongest Move (Wave 3)
The Current Phase: The market is currently in Minor Wave 3 (Red) downwards.
Learning Point: In Elliott Wave theory, Wave 3 is typically the longest and never the shortest of the three motive waves (Waves 1, 3, and 5). This means the analysis anticipates the current move to be the most directional, high-momentum, and volatile part of the entire Intermediate Wave (C) correction. This is the "sweet spot" for trend traders.
4. The Principle of Alternation (Predicting Wave 4)
Upcoming Wave: The analysis projects a shallow Minor Wave 4 (Red) rebound.
Learning Point: While the chart doesn't show Wave 4 yet, this prediction is often guided by the Principle of Alternation. If the preceding corrective wave (Minor Wave 2) was a sharp, deep correction, the next corrective wave of the same degree (Minor Wave 4) is expected to be a sideways, shallow, or complex correction (like a flat or triangle). The prediction of a "shallow" wave 4 suggests Minor Wave 2 was likely a deeper, sharper retracement.
5. The Critical Invalidation Rule
The Invalidation Level: The report sets the critical invalidation price at 74,223, which represents the low or starting point of wave ((1)).
Learning Point: Wave ((2)) can never retrace more than 100% of Wave ((1)). By identifying a specific price level, we can assume that our study says price should not broke below that particular level, it provides traders with clear risk management parameters.
I. Current Wave Count Status
The analysis indicates that the previous upward corrective structure, designated as Intermediate Degree Wave (A) and Wave (B) (Blue), is complete. The market is now engaged in a significant downward movement within the larger Intermediate Degree Wave (C) (Blue).
This Intermediate Wave (C) is expected to unfold as a five-wave impulse sequence of a Minor Degree (Red) to the downside, fulfilling the final leg of the overall corrective cycle.
II. Detailed Downward Projection
The Minor Degree five-wave structure within Intermediate Wave (C) is currently positioned as follows:
Minor Wave 1 and Minor Wave 2 (Red): These waves are identified as complete.
Current Phase: The market is now unfolding Minor Wave 3 (Red) downwards, indicating the strongest portion of the bearish move is in progress.
Anticipated Completion: Following the completion of Minor Wave 3, the analysis projects a shallow Minor Wave 4 (Red) rebound, followed by the final impulse move, Minor Wave 5 (Red), to complete the entire Intermediate Wave (C) correction.
The ultimate completion of Intermediate Wave (C) will signal the end of the larger-degree correction (labeled as a corrective wave (2)).
III. Critical Invalidation Level
The integrity of this bearish wave count is contingent upon the price action respecting a critical support level.
Invalidation Price: 74,223
Significance: This price point represents the extreme low or starting point of wave ((1)), so Wave ((2)) correction Should not breach this level as per wave principles, if it makes lower low below 74,223 on the lower side, the current Elliott Wave analysis would be invalidated, requiring a revision of the entire wave structure and market outlook.
I am not Sebi registered analyst.
My studies are for educational purpose only.
Please Consult your financial advisor before trading or investing.
I am not responsible for any kinds of your profits and your losses.
Most investors treat trading as a hobby because they have a full-time job doing something else.
However, If you treat trading like a business, it will pay you like a business.
If you treat like a hobby, hobbies don't pay, they cost you...!
Hope this post is helpful to community
Thanks
RK💕
Disclaimer and Risk Warning.
The analysis and discussion provided on in.tradingview.com is intended for educational purposes only and should not be relied upon for trading decisions. RK_Chaarts is not an investment adviser and the information provided here should not be taken as professional investment advice. Before buying or selling any investments, securities, or precious metals, it is recommended that you conduct your own due diligence. RK_Chaarts does not share in your profits and will not take responsibility for any losses you may incur. So Please Consult your financial advisor before trading or investing.

Bitcoin Losses Hit 9-Month High Of $24 Billion Amid 8% Price DroBitcoin is trading at $101,729 at the time of writing, sitting just above the critical $100,000 support. Earlier, BTC slipped below this level, forming an intra-day low of $98,966 before rebounding slightly.
The recent 8% drop has validated a head-and-shoulders pattern, which projects a potential 13.6% decline targeting $89,948. However, if investors begin buying at lower levels, Bitcoin could bounce from $100,000 and retest $105,000 or higher.
Conversely, continued selling pressure and weak market conditions could send BTC below $100,000 again. A breach under $98,000 may lead to further losses toward $95,000 or lower, undermining any short-term recovery hopes.

Bitcoin ShortBitcoin is looking to retest the 98200 support and if broken, would be headed to 76550-75000 area on this current weekly structure. Be careful guys.

November 4 Bitcoin Bybit chart analysisHello
It's a Bitcoin Guide.
If you "follow"
You can receive real-time movement paths and comment notifications on major sections.
If my analysis was helpful,
Please click the booster button at the bottom.
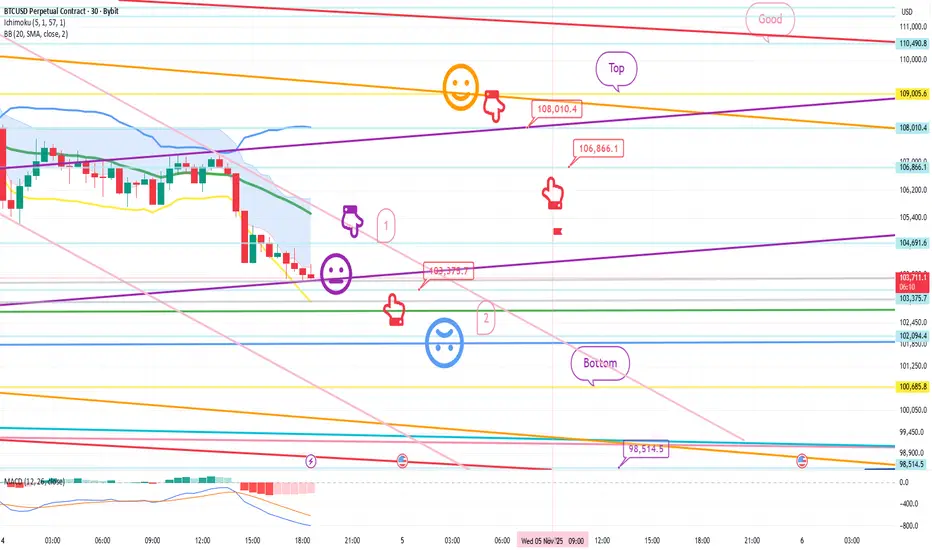
This is the Bitcoin 30-minute chart.
The Nasdaq indicators will be released shortly at noon.
Due to the end of Daylight Savings Time, we need to move back an hour from the previous chart.
Based on the pattern, the weekly chart reached the Bollinger Band support line,
which is a major support line.
However,
there's also pressure from the MACD dead cross on the monthly chart,
and the possibility of a Nasdaq coupling appears high during a decline.
So,
I developed today's strategy centered on the Nasdaq's lower gap retracement.
*When the red finger moves,
this is a conditional long position strategy.
1. Confirm that the purple finger touches the first section (autonomous short).
$103,375.7 long position entry point / stop loss if the light blue support line is broken.
2. $108,010.4 long position primary target -> Target prices are set at Top, then Good in that order. If the strategy is successful, 106.8K will be the point where you can re-enter a long position.
If the price falls immediately without touching the first point at the top, then the second point is the final long position.
The second point is a double bottom based on the low of this uptrend.
Based on the lower tail, the price is open from the bottom to 98.5K.
It would be wise to prepare for a failure of the Nasdaq decline and rebound.
Please use my analysis to this point for reference only.
I hope you operate safely, with a strict trading strategy and stop-loss orders.
Thank you.
Bitcoin update + new setupsETH was leading the move to sweep the lows, and it did.
Now that both BTC and ETH have cleared liquidity below the previous lows, we have new setups, depending on the confirmations at key S/R levels.
⚠️ These setups are based on a bounce scenario toward the SSL. Setups become invalid if the market drops further toward the lower Pivot areas. When that happens, a new update will follow.
BTC: (When support confirmed above SSL)
- Entry around SSL ~103540
- tp1 ~104900
- tp2 ~106200
- close ~108200
- stop depends on previous low when support confirmed above SSL
BTC: (When SSL is rejected and confirmed)
- DCA around SSL ~103500-102500
- tp1 ~100600
- tp2 ~98900
- close ~104800
Note: Don't forget to take partial profits on the way to secure your trade.

Need to see if it can rise above 104463.99
Hello, fellow traders!
Please "Follow" to always get the latest information quickly.
Have a great day.
-------------------------------------
(BTCUSDT 1D chart)
The price declined from the DOM(-60) indicator level of 106431.68, but the DOM(-60) indicator is still forming at 106431.68.
Therefore, the 106431.68 level can be considered a low point.
Therefore, we need to observe how the price moves during this volatile period, around November 4th-9th (maximum November 3rd-10th).
Since it fell below the critical 104463.99-108353.0 level, if it fails to rise above this level, we should check for support near the next critical level of 89294.25.
At this point, the M-Siganl indicator on the 1M chart is passing through a critical zone, so it's expected to re-establish the trend once it meets the M-Siganl indicator on the 1M chart.
If the OBV indicator falls below the Low Line and fails to rise again, it's likely to touch EMA 3.
For the price to break above a critical point or zone and continue the uptrend,
1. The StochRSI indicator must be rising. Ideally, it should not be in an overbought zone.
2. The TC (Trend Check) indicator must be rising. Ideally, it should remain above the zero level.
3. The OBV indicator must be rising. Ideally, it should remain above the High Line.
If the above conditions are met, the upward trend is likely to continue after breaking above a critical point or zone.
Currently, the price is moving against the above conditions, so there's a possibility of further decline. However, given the volatility, it's better to wait and see rather than assume a decline.
-------------------------------------
I'm curious about what will happen next, but there's no way to know for sure.
However, as I've repeatedly mentioned, if you're trading according to a basic trading strategy that suits your investment style, I believe you'll be able to trade according to your strategy, whether the current decline continues or rebounds and rises.
As I mentioned in a previous idea,
- If a daily decline exceeds -10%, a rebound is highly likely,
- If a daily increase exceeds +10%, a reversal is highly likely.
Therefore, if you're familiar with scalping or day trading, you can profit from trading.
However, you must sell at that profit to lock in your profits.
The basic trading strategy I mentioned is to buy in the DOM(-60) ~ HA-Low range and sell in the HA-High ~ DOM(60) range.
Furthermore, we can respond based on the support and resistance levels identified on the 1M, 1W, and 1D charts, which are important areas.
Therefore, the current available support levels are the 104463.99-108.353.0 and 87814.27-93570.28 levels.
The remaining support and resistance levels can be used as trading opportunities.
In other words, these are points for securing profits.
-
Due to this decline, the HA-High indicator on the 1M chart is showing signs of forming at the 110105.69 level.
Therefore, if there is a rebound, the 110105.69 level could potentially serve as resistance.
However, as the price rises, the HA-High indicator on the 1M chart could return to its previous HA-High level.
Therefore, we need to determine if support is found in the 104463.99-108353.0 range and consider a response plan accordingly.
-
If the price falls below the M-Signal indicator on the 1M chart and remains there, there's a possibility of a downtrend, so we should also consider a response plan.
The coin market operates in decimals, allowing for more flexible trading than the stock market.
This means that by trading at a buy price, you can profit even if you're losing money and increase your coin (token) holdings.
For example, if you bought $100 at $101,000, you could sell $100 (including transaction fees) when the price rises, increasing your profit.
By increasing your profit, you can quickly turn a loss into a profit.
If you bought $100 at 101,000 and only had 0.1 coins (tokens), you could sell those 0.1 coins and generate a cash profit if the price rises and you're making a profit.
However, this method is only applicable if you won't be trading that coin (token) again.
In other words, if you sell 100% of your holdings, you'll need to wait until the next price fluctuation, or you could end up making a worse trade.
Therefore, if possible, it's best to trade with the same amount you bought, increasing the number of coins (tokens) that represent your profit.
Don't think you should just leave the coin (token) you're losing and trade another coin (token) to make a profit.
This could actually lead to further losses.
-
Thank you for reading to the end.
I wish you successful trading.
--------------------------------------------------
- This explains the big picture.
(3-year bull market, 1-year bear market pattern)
I will explain in more detail when the bear market begins.
------------------------------------------------------

$BTC — Liquidity Grab Completed, Next Move LoadingBitcoin recently dipped toward the $98K zone, sweeping liquidity just below the psychological $100K support. That move likely cleared leveraged longs and triggered stop hunts — a classic liquidity grab setup.
Currently, BTC has regained above the 100K handle, suggesting strength and possible continuation toward the $106K–$108K liquidity pocket, where upside stops may rest.
My short-term bias:
Longs: Possible but risky here — prefer entries near 99K–100K with tight stops.
Shorts: Avoid shorting now; better to wait for the market to reach 106K–108K and show exhaustion or reversal signs before entering.
If BTC forms a double bottom around 98K, it could be a solid accumulation signal for another leg up.
However, a clean break below 98K would open downside liquidity toward the 90K zone — the next significant support area.
📈 Plan Summary:
Long bias until 106K–108K
Watch for liquidity sweep at highs
Potential double bottom near 98K
Breakdown confirmation → Target 90K
Patience is key — let liquidity guide your next move.
#Bitcoin #BTCAnalysis #CryptoMarket

[BTCUSD] 5M Falling Wedge & Megaphone: Do or DieNot looking great if it can't break structure, let's see how it plays out by end of year.
Lookout for next wave if break and hold above megaphone.
Sharpen your scythes and prepare for harvest... B)
