Bitcoin - This chart is crumbling!⛔️Bitcoin ( CRYPTO:BTCUSD ) creates a massive top:
🔎Analysis summary:
All the previous cycles on Bitcoin have been lasting about 1,000 days. And exactly three years ago, Bitcoin retested the previous all time high, starting the next bullrun. If we soon see bearish confirmation on Bitcoin, this crypto will lead to another insane bloodbath.
📝Levels to watch:
$100,000 and $50,000
SwingTraderPhil
SwingTrading.Simplified. | Investing.Simplified. | #LONGTERMVISION
1-BTCUSD

Bitcoin $BTC price analysis we need your vote !💥 Final “dip” of November?
💰 Will CRYPTOCAP:BTC drop to $91,600
to close that old GAP on the chart? 🤔
🟢 Bullish case: $100K holds → next rally begins.
🔴 Bearish case: gap fills near $91,600 → possible reversal after.
What do you think — final washout or just a pause before the next move?, vote at comments
______________
◆ Follow us ❤️ for daily crypto insights & updates!
🚀 Don’t miss out on important market moves
🧠 DYOR | This is not financial advice, just thinking out loud.

BTC Adam & Eve PatternLooks like on the 12 hour BTC has an Adam & Eve pattern. The height of the arch is the potential downside. So if it plays out, it looks like 74k is possible.

$BTC up from hereOn 27 Oct, when BTC was $115k, I said it is going lower to possibly $100k or even overshoot to $90k before a buy ().
We are now at $89.9k. Looking for an up for here to $97k. If it breaks above the trendline, we are looking at a move to $107k before a possible next move lower.

BTC DOWN TO 80K? Based on what we are seeing here if BTC breaks through 100K then the next level down is 80K marker and if that does not hold then 70-72K marker makes sense
However If we can make new highs and break 107K then it is possible to continue upwards
If you want a deeper dive on BTC or any other crypto or stock or commodity you have been watching comment below the stock or asset and I will send you personally an analysis of that asset.
Happy Trading
Trade Smarter Live Better
Mindbloome Exchange

Check for support near the M-Signal indicator on the 1M chart
Hello, fellow traders!
Follow me to get the latest information quickly.
Have a great day.
-------------------------------------
(USDT 1D Chart)
(USDC 1D Chart)
USDT is the major currency that influences the coin market.
The USDT and USDC charts are moving in opposite directions.
This decline appears to be driven by funds flowing out of USDC.
Once the USDC gap decline stops, funds flowing in through USDT are expected to drive the coin market higher.
-
(USDT.D 1M Chart)
For the coin market to show an upward trend, USDT dominance must remain below 4.91 or show a downward trend.
We need to see if the price can face resistance around the Fibonacci level of 0.618 and turn downward.
If not, we should consider a response plan, as a rally toward 7.13 is expected.
-
(BTC.D 1M chart)
For an altcoin bull market to begin, it must either remain below 55.01 or show a downward trend.
Therefore, for the bull market we're waiting for to occur, both USDT dominance and BTC dominance must decline.
If USDT dominance declines while BTC dominance rises, a bull market will emerge, with only BTC rising.
--------------------------------------------------
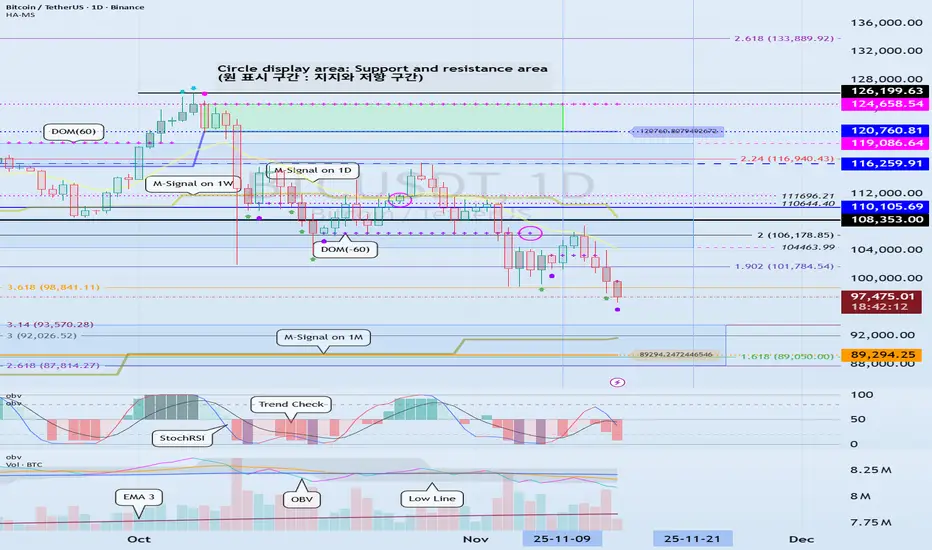
(BTCUSDT 1D Chart)
The key is whether the price can touch the M-Signal indicator on the 1M chart and turn bullish.
At this point, it's crucial to maintain the price above 89294.25.
If not, a step-down trend is likely.
To turn bullish, the price must remain above the M-Signal indicator on the 1W chart.
At this point, it's crucial to maintain the price above the newly created HA-High indicator point of 110105.69 on the 1M chart.
If not, the price may pretend to rise but then fall again, so you need to consider countermeasures.
This is a basic trading strategy within the box range: buy between DOM(-60) and HA-Low and sell between HA-High and DOM(60).
If the price rises in the HA-High ~ DOM(60) range or falls in the DOM(-60) ~ HA-Low range, you should switch to trend trading.
To do this, we should consider the movements of the StochRSI, TC (Trend Check), and OBV indicators.
To sustain the uptrend after breaking above a key point or range, the StochRSI, TC, and OBV indicators must show upward trends.
At this point,
1. The StochRSI indicator should not have entered an overbought zone.
2. The TC indicator should remain above zero.
3. The OBV indicator should remain above the High Line.
Therefore, check the movements of the StochRSI, TC, and OBV indicators at the support and resistance levels depicted on the 1M, 1W, and 1D charts and consider whether you can trade accordingly.
Based on the current price range, the key points or ranges are:
- 87814.27-93570.28
- 110105.69
- 120760.81-124658.54
I believe the three ranges above are important points or ranges.
Therefore, when the price is near these ranges, you should check the movements of the StochRSI, TC, and OBV indicators to determine a response plan.
-
Thank you for reading to the end.
I wish you successful trading.
--------------------------------------------------
- This is an explanation of the big picture.
(3-year bull market, 1-year bear market pattern)
I will explain in more detail when the bear market begins.
------------------------------------------------------
Bitcoin trading strategyNew Dimension of Core Logic: Breaking Out of Liquidity Traps, Focusing on Structural Variables
1. Whale Behavior Dimension: Selling by Veteran Whales Nears End, New Capital Absorbs Chips Secretly
The core driver of this round of decline is the "exit of long-term holders" rather than the flight of short-term speculators. Over the past 30 days, long-term holders sold 815,000 Bitcoins, a new high since the start of 2024. Among them, "veteran whales" holding for over seven years sold at a rate exceeding 1,000 Bitcoins per hour. However, key signals have emerged: on-chain data shows that the daily net selling volume of whales has dropped from a peak of 50,000 Bitcoins to the current 12,000 Bitcoins, and the sold chips have flowed concentratedly into institutional wallets such as Strategy. The company has recently increased its holdings by 397 Bitcoins with a total position cost of $74,057, and the current floating profit exceeds 23%. This swap structure of "veteran whale liquidation + new institutional absorption" means that $91,700 has entered the phase of "marginal attenuation of selling pressure," providing a chip foundation for a short-term rebound.
--------------------------------------------------------------------------------
2. Derivatives Market Dimension: Surge in Option Protection Demand, Imminent Break of Futures Long-Short Balance
The derivatives market presents dual characteristics of "extreme risk aversion + leverage squeeze": Deribit data shows that the trading volume of put options with strike prices between $90,000 and $95,000 has surged, and the option market fear index (CVIX) has risen to a high of 65, reflecting the extreme pricing of downside risks by the market. But the futures market has shown signs of reversal: 180,000 traders were liquidated in the past 24 hours, including $510 million in long liquidations and $170 million in short liquidations, indicating that the long leverage squeeze is drawing to a close. Meanwhile, although the funding rate remains at -0.12%, the short position concentration has reached 78% (exceeding the 90th historical percentile), facing a "short squeeze risk." Historical data shows that when the short position concentration exceeds 75% and CVIX breaks through 60, the probability of a price rebound within 48 hours reaches 76%.
Bitcoin trading strategy
buy:91000-92000
tp:94000-95000
sl:90000

BTC Slips Below 50 EMA: Caution RequiredThings could get uglier as CRYPTOCAP:BTC has now broken below the 50 EMA, a key long-term dynamic support level.
This breakdown signals growing weakness and may open the door for deeper downside if buyers don’t step in soon.
DYOR, NFA

BITCOIN Free Signal! Buy!
Hello,Traders!
BITCOIN taps into a major higher-timeframe demand area, reclaiming structure and sweeping downside liquidity. A bullish reaction here may drive price toward the next internal range high.
--------------------
Stop Loss: 88,783$
Take Profit: 94,407$
Entry Level: 91,500$
Time Frame: 1D
--------------------
Buy!
Comment and subscribe to help us grow!
Check out other forecasts below too!
Disclosure: I am part of Trade Nation's Influencer program and receive a monthly fee for using their TradingView charts in my analysis.

Bitcoin Can reach 93000 Bitcoin could reach the price level of $93,000 in the coming weeks.
There is a possibility that after breaking the midline of its long-term weekly channel, it may move up to the indicated FVG level to fill the remaining unfilled orders.
After that, it could start a new bullish rally aiming for the upper boundary of the channel.
This is purely an analysis and should not be considered as financial advice.
Buying or selling is at the trader’s own risk.

BTCUSD Technical Analysis – Is a Correction on the Way?BINANCE:BTCUSD is currently trading inside a well-defined falling wedge, and the price is pressing against the lower boundary of the pattern. This level could serve as dynamic support, and if a strong rejection occurs, we may see a corrective move toward the 102,000 resistance area.
If sellers successfully defend that zone, the bearish structure remains intact, increasing the likelihood of BTCUSD moving back down to lower price levels. However, if price breaks above this resistance, a deeper correction toward the upper boundary of the wedge could unfold.
At this stage, closely monitoring candlestick signals and volume activity around this key area is essential for spotting high-quality selling opportunities. Ensure every trade setup is backed by solid confirmation, and always maintain strict risk management.
If you have any thoughts or additional perspectives on this setup, I’d be happy to hear them. Feel free to share your opinion in the comments!

Bitcoin Below $100K: Eyeing the 60-Day Cycle LowBitcoin is heading below $100K and is on track to hit its 60-day cycle low - a predictable bottom that repeats like clockwork. What makes this one extra interesting? It’s aligning with the weekly cycle low, setting the stage for a sharp reversal.
All major indicators are flashing “bottom incoming” between now and November 24th. History shows that buying near these cycle lows can pay off big. If Bitcoin holds, the next target is a clean retest of $117K, which is roughly an 18% upside from current levels.
Mark my words: November could be the pivot month. Once the bottom is in, we can expect a massive bullish run through December and January, with Bitcoin targeting $135K–$150K.
And don’t sleep on altcoins - they’ll likely start outperforming BTC early next year as the rotation kicks in.
✅ Bottom line: If you’re not watching this cycle, you’re missing a prime entry point. Bitcoin is setting up for a breakout.


BTC in a bear marketBTC Price Outlook: Potential Decline Toward 85K
Bitcoin (BTC) is currently showing signs of potential weakness, with technical indicators suggesting a possible retracement toward the 85,000 level. This zone may act as a key support area if bearish momentum continues. Several factors contribute to this outlook:
- 📉 Momentum Shift: Recent price action indicates slowing bullish momentum, with lower highs forming on shorter timeframes.
- 📊 Volume Analysis: Declining volume during upward moves suggests a lack of strong buying interest, increasing the probability of a pullback.
- 🧠 Market Psychology: Traders could be locking in profits after the recent rally, leading to increased selling pressure.
If BTC approaches the 85K level, it will be crucial to monitor how price reacts—whether it finds support and consolidates, or breaks lower toward deeper retracement zones. Risk management and confirmation signals remain essential in navigating this setup.

Bitcoin Daily Analysis #13 – November 17, 2025Welcome to another Bitcoin analysis — and apologies for the delay.
As we can see, our bearish scenario has strengthened, and on the daily timeframe, BTC has officially turned downward 📉.
It’s still unclear whether this move is just a correction wave or a full trend reversal, but based on the candle volume, there’s potential for deeper pullbacks ahead.
If Bitcoin reclaims the 106,000 zone and holds strongly above it, the bullish outlook can return 🔄📈.
But if we get rejected from this level once more, we can safely say the trend has shifted into a clear downtrend.
There’s solid buying orders around the 90,000 zone, and we need to see how price reacts there.
A break below this level would make the bullish scenario much harder to achieve 🚨.
Additionally, after building a consolidation box in this region — or waiting for clearer structure — there may be an opportunity to take a short position 📉🟥.
Disclaimer:
This content is for informational purposes only and does not constitute financial or investment advice. © DIBAPRISM
Larry D.Kohn

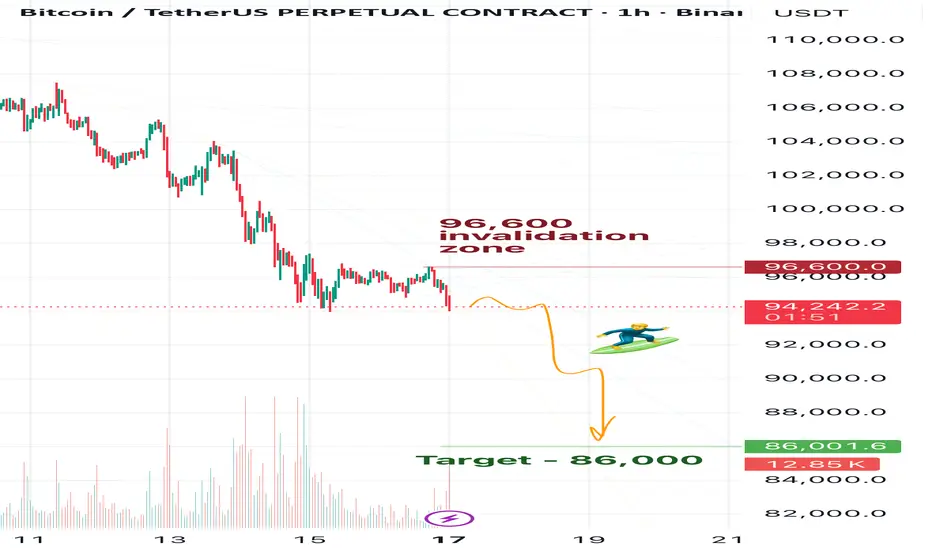
BTC Daily View 17.11Friends, as you may remember from my previous Bitcoin updates, I’m expecting BTC to reach 83k. At the moment, in my view, Bitcoin is already preparing for this move down.
However, for now my main target is 86k — I think BTC currently has enough momentum only to drop to that level. Before we see 83k, it will likely need to build more energy.
So after hitting 86k, I expect a correction — probably a prolonged one. But let’s see what the market gives us.
🎯For now, my target remains 86k.
❌Invalidation zone: 96,600
⚠️Disclaimer:
This is not financial advice. Please make your own decisions according to your own trading rules, and never trade without stop-losses.
🗯️If you find my ideas helpful, please leave a reaction and write a comment — your support really matters to me
November 11 Bitcoin Bybit chart analysisHello
It's a Bitcoin Guide.
If you "follow"
You can receive real-time movement paths and comment notifications on major sections.
If my analysis was helpful,
Please click the booster button at the bottom.
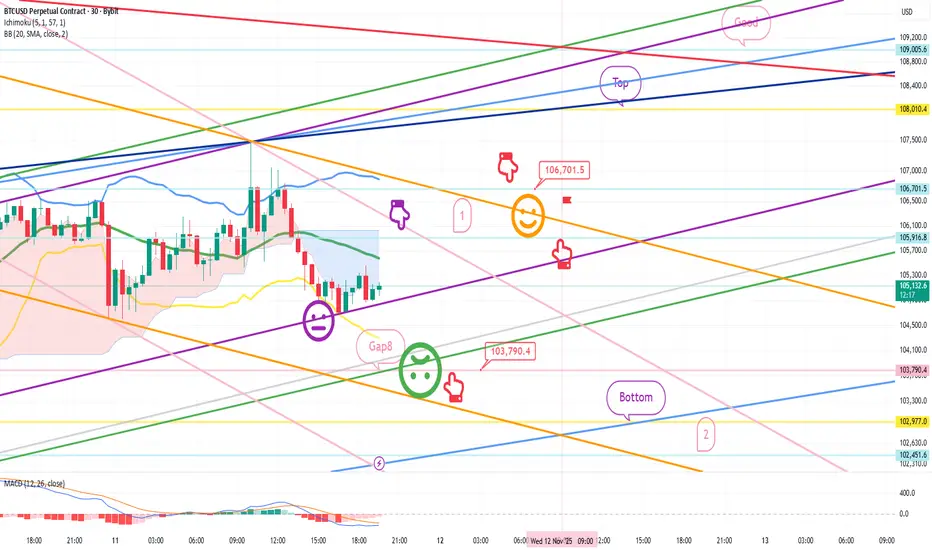
This is a Bitcoin 30-minute chart.
There are no separate Nasdaq indicators.
I developed a strategy based on the lower gap retracement of both Bitcoin and Nasdaq.
*Conditional long position strategy when the red finger moves
1. Confirm the first touch of the purple finger at the top (autonomous short)
Switch to a long position at the bottom at $103,790.4 /
Stop-loss price if the green support line is completely broken or the bottom is touched
2. First target for a long position at $106,701.5 / Target prices are Top and Good in that order.
If the strategy is successful, the first section is used to re-enter the long position.
If a correction occurs immediately without touching the first section at the top,
I'll wait for a long position at the bottom. Looking at the overall picture today, if the price drops to the bottom,
the medium-term pattern will be broken.
The purple support line must be maintained or the upper limit must be reached at 106.7K.
A rebound in the 1+4 range is required without breaking the green support line.
The Nasdaq variable is important, so please keep a close eye on the movement.
I hope you operate safely, with principled trading and stop-loss orders essential.
Thank you.
BITCOIN SIGNAL: NOBODY COUNTS ON THIS!!! (scary)Yello Paradisers! Enjoy the video!
And Paradisers! Keep in mind to trade only with a proper professional trading strategy. Wait for confirmations. Play with tactics. This is the only way you can be long-term profitable.
Remember, don’t trade without confirmations. Wait for them before creating a trade. Be disciplined, patient, and emotionally controlled. Only trade the highest probability setups with the greatest risk to reward ratio. This will ensure that you become a long-term profitable professional trader.
Don't be a gambler. Don't try to get rich quick. Make sure that your trading is professionally based on proper strategies and trade tactics.

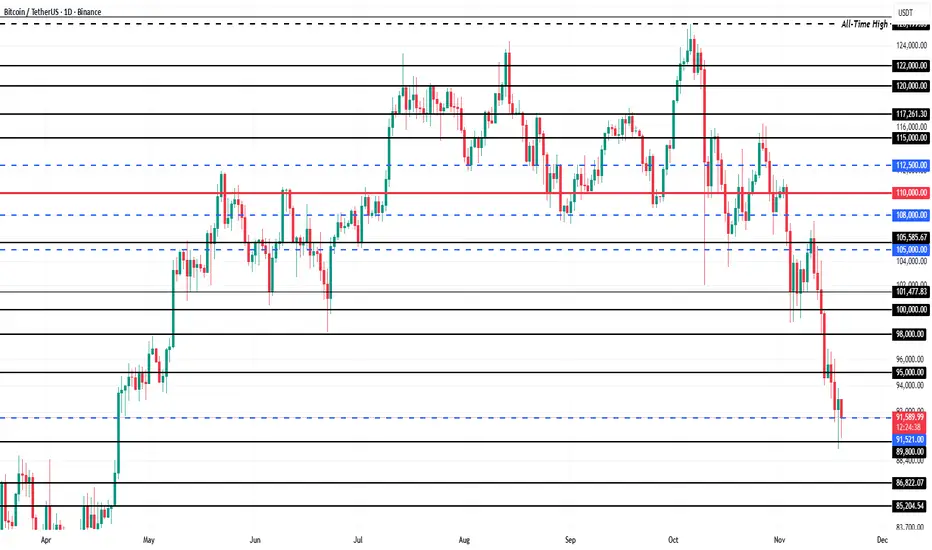
BTCUSD – Potential Buy Zone AnalysisWelcome to my analysis.
This chart provides a long-term outlook on Bitcoin’s price movement.
As observed, Bitcoin experienced a decline after reaching the all-time high resistance level at 125,556. The key support level at 97,458 has also been broken.
From a technical perspective, we now have a potential buy zone within the 50%–61.8% Fibonacci retracement, located between 89,440 and 80,472. This area represents a favorable region for potential entries, with an upside target toward the next major resistance around 131,399.
Good luck and trade safely.

Bitcoin’s Price at $90,000 Is Signaling a Bottom Formation
Bitcoin trades at $90,331 and holds above the $89,800 support level, which has become a key buffer during the decline. The recent drop to a multi-month low has increased caution, but technical and behavioral signals suggest downside pressure is easing.
Based on investor support and historical patterns, a deeper drop appears unlikely. A bounce from $89,800 could push BTC back toward $95,000 as confidence improves. Strengthening demand and exchange outflows reinforce the possibility of a recovery in the near term.
If bullish momentum fades and broader weakness intensifies, Bitcoin could slip below $89,800 and fall toward $86,822. Such a decline would invalidate the current bullish thesis and signal a deeper retracement.
BITCOIN Is all hope lost for the Bull Cycle?First of all allow me to begin by saying this: IT IS NEVER FUN to call market tops. Especially on long-term charts, especially on Bitcoin/ crypto. And the reason is that, usually it violently traps most people in. Either for a long time or until they lose all capital. And nobody should take joy in this and as chief analyst here at Tradingshot, I am no exception.
Regardless of that, our thesis here has been pretty simple and for a long time we've been calling for an October exit, as that was when the 4-year Cycle Theory suggested the Bull Cycle would top. I personally hope I am wrong but in all my decades of investing, I learned that 'hope' doesn't get you far here, quite the contrary it teaches you brutal (and often very expensive lessons). The hard facts and historical evidence, point to a new Bear Cycle. And we will keep presenting the charts, the empirical evidence no matter how many followers we lose or how many negative comments we see as they mean nothing to us. Profit making only does.
Now that I got this out of the way, let's see what other key levels Bitcoin (BTCUSD) hit. Yesterday's aggressive decline saw the market making a Low marginally below the Higher Lows trend-line (bottom) of the 3-year Channel Up. Essentially that has been the dominant pattern of the whole Bull Cycle. BTC already closed below its 1W MA50 (blue trend-line) last week, which has historically been a Bear Cycle confirmation, already lost the basic structure of its Bull Cycle rallies by breaking way below the 0.382 Fibonacci retracement level from the previous Higher Low and now faces with the complete breakdown of the pattern - crossing below its bottom.
Needless to say, if BTC closes the week below it, selling could accelerate, with the 1W MA100 (green trend-line), being the market's next long-term Support, where a counter-trend bounce could be possible.
So is this Higher Lows trend-line the last hope of the Bull Cycle? Feel free to let us know in the comments section below!
---
** Please LIKE 👍, FOLLOW ✅, SHARE 🙌 and COMMENT ✍ if you enjoy this idea! Also share your ideas and charts in the comments section below! This is best way to keep it relevant, support us, keep the content here free and allow the idea to reach as many people as possible. **
---
💸💸💸💸💸💸
👇 👇 👇 👇 👇 👇

Bitcoin Outlook -A Potential ABC Correction Toward the $50K ZoneAs 2025 nears its end, the cryptocurrency market sits at a crossroad. After two years of robust performance, there are early indications that a bear market may be approaching.
Bitcoin ABC Downturns
Historically, Bitcoin downturns tend to unfold in an ABC corrective pattern. If this cycle has indeed peaked, BTC price appears to be moving through the initial A-wave decline. After that leg completes, a rebound in the form of wave B could lift prices back toward the $100,000 area. The final C-wave would then likely drive the market lower, potentially into the $45,000–$50,000 zone.

BTC higher (?)As you can see we are at a major pivot point that can bring BTC at 10500 ish and then will be interesting to see if could break above this immaginary rainbow
