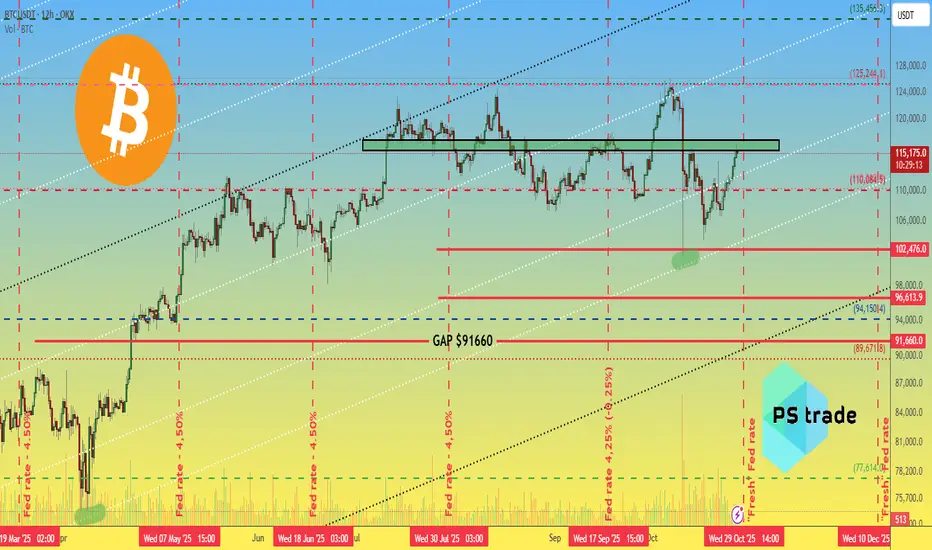
Crypto Markets Enter a Volatile Week Ahead of Key Global EventsKey events shaping volatility this week:
Oct 29: FED rate decision (expected -0.25%)
Oct 30: Trump–Xi meeting in South Korea
Market sentiment:
Fear & Greed Index jumped from 22–34 → 51
Short-term optimism is returning as macro uncertainty softens
CRYPTOCAP:BTC Technical Zone:
Current resistance: $115,500–117,000
Support: $110,000
A confirmed breakout above 117K could open the way to the next bullish leg on OKX:BTCUSDT
Question remains: is this the start of a new rally or just a pre-correction bounce?
______________
◆ Follow us ❤️ for daily crypto insights & updates!
🚀 Don’t miss out on important market moves
🧠 DYOR | This is not financial advice, just thinking out loud.
1-BTCUSD
BTC at Double Channel Support — Next Impulse Loading?📉 BTC at Double Channel Support — Next Impulse Loading? 🎯
Bitcoin is currently testing a double channel confluence support near $100,211 , a level that’s been both technically and psychologically relevant across the 15m, 1H, and 4H views.
The left pane shows the descending red channel, where price just wicked below support and reclaimed — a signal we’ve seen in prior reversals.
The right pane highlights the broader blue/green support — creating a high-probability reaction zone.
🔹 Technical Support: $100,211
🔹 Local Resistance: $105,161 → $110,596
🔹 Major Target: $122,955 - $138,888 zone
The bullish case strengthens if BTC flips $105,161 on strong volume. But failure to hold $100K opens doors to $97,389 and $96,821 next.
Zooming out: this is a classic inflection zone — the reaction here could define BTC's next multi-thousand move.
🛠️ Smart traders aren't guessing — they’re preparing for both outcomes.
Trading Wisdom 📜
Inflection points > predictions.
In markets, it’s not about being right — it’s about being ready. If this is the bottom, let the chart prove it before the ego jumps in. 🎯
Disclaimer
Disclaimer: I’m just sharing wisdom, not instructions. No licenses, no guarantees — just years of trading scars and precision chartwork. Be smart, protect your capital, and don’t copy blindly. 138k remains my target for the year guys..let's see!
One Love,
The FXPROFESSOR 💙
A lot of people ask how I trade — truth is, it’s pretty simple. I have a daily budget, and I enjoy trading. I’ve moved away from getting married to altcoins, so you’ll notice I post less of them lately. But I still trade every day. I buy dips around key support/resistance levels and exit just below if invalidated. Sometimes it takes more than one attempt, but patience is part of the game. Yes, I use high leverage — that’s my style, and it keeps me engaged. The real secret? Take some profit when it works. That’s it. 💙

Bitcoin Tests $100K Support as Bearish Momentum AcceleratesBitcoin has come under renewed selling pressure, sliding sharply toward the key $100,000 psychological and structural support area. The price has now broken below the 50-day simple moving average (SMA) and is testing the 200-day SMA, signaling a significant test of trend integrity after months of consolidation between $100,000 and $123,000.
The 50-day SMA has turned lower, reflecting weakening medium-term momentum, while the 200-day SMA remains upward-sloping, maintaining the broader bullish framework. A daily close below the $100,000 support would represent a potential shift in long-term sentiment, whereas a rebound from this zone could keep Bitcoin within its established range.
Momentum indicators underscore the recent downside pressure: the MACD remains below its signal line, extending its bearish crossover, and the RSI has slipped to around 35, approaching oversold conditions last seen during earlier correction phases.
Overall, Bitcoin is at a pivotal juncture — the $100K region serves as both a technical and psychological inflection point that may determine whether the broader uptrend can reassert itself or give way to deeper consolidation.
-MW

EURJPY Reaction Zone AheadOANDA:EURJPY is showing signs of weakness after a strong rally.
The pair is now approaching a key support zone, which also aligns with an unfilled gap.
A retest of this area could attract buyers, but if it fails to hold, we might see a deeper pullback in the short term.
DYOR, NFA

BTCUSD Bearish: Break Below 104,200 Targets 96,000Bitcoin on the 1D is trending lower after the early-October peak near 125,000. Price sits beneath the 20/60/120 MAs, and a clear Descending Triangle has formed with a flat floor at 104,200 and lower highs pressing from above. The heavy resistance band at 113,400–114,500 and the short-term cap near 115,000 continue to attract selling. Volume has favored down days, keeping momentum on the bears’ side.
Primary path: a daily close below 104,200 confirms breakdown and opens 100,000 first, then the 96,000 objective. Aggressive sellers can also look for a failed rally into 108,000–109,500 to fade the lower-high structure. If downside accelerates, a worst-case extension toward 90,000 is on the table within the pattern’s continuation.
Alternative: if 104,200 holds and price reclaims 108,500 on a strong daily close, a squeeze toward the 113,400–114,500 cluster and 115,000 resistance is plausible. That would signal a failed breakdown but not a trend change unless buyers can establish acceptance above those overhead levels.
Trigger/confirmation: daily close < 104,200 for continuation; secondary trigger is a rejection from 108,000–109,500. Targets: 100,000 and 96,000 (bearish), or 114,500–115,000 (contrarian bounce). Invalidation: for shorts, a daily close back above 108,500; for any tactical longs, a slip back under 103,500 negates. This is a study, not financial advice. Manage risk and invalidations.

Bitcoin 1 day analysisBitcoin is at important reversal zone and almost started reversal.
A successful reversal will lead to $109000 and break from here will lead to $95000.
I view favors for upside. NFA DYOR

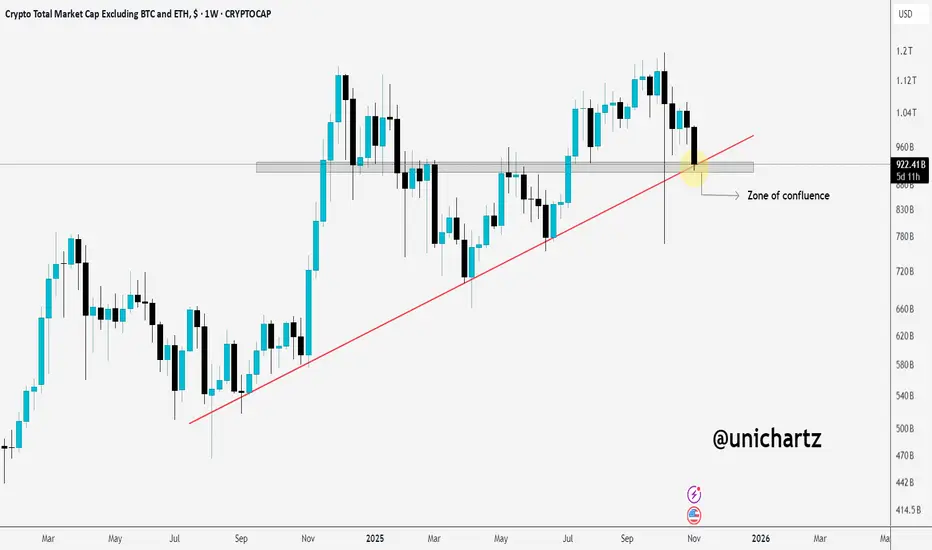
Altcoins at a Turning Point, Can Bulls Defend This Level?Altcoins are currently hovering at a critical zone of confluence, where horizontal support meets the rising trendline. A strong bounce from here could revive bullish momentum, but a breakdown below this level might open the door for deeper corrections.
This is a make-or-break area for the broader altcoin market.
Stay alert.
NFA
Bitcoin Price Crash Below $100,000? Here’s How It Could HappenAt press time, Bitcoin trades at $104,268, having slipped below the $105,000 support level. However, it is holding above the $100,000 which it has since May this year.
Nevertheless, the crypto king continues to trace the head and shoulders pattern, which historically precedes a bearish breakdown.
If the pattern confirms, it could result in a 13.6% drop from its neckline, pushing Bitcoin toward $89,948. Combined with weakening inflows and potential EMA crossover, the risk of a sub-$100,000 correction appears high in the short term.
However, a quick recovery could still prevent this outcome. If Bitcoin finds investor support and reclaims $105,000 as a stable floor, it could rebound toward $110,000. Surpassing this resistance would invalidate the bearish outlook and restore short-term market confidence.

BITCOIN (BTCUSD): Pullback From Key Support
Bitcoin is currently trading within a wide horizontal range on a daily.
We see a test of its support now.
There is a high chance that the price will bounce from that, following
a formation of a confirmed bullish imbalance candle.
Goal - 105170
❤️Please, support my work with like, thank you!❤️
I am part of Trade Nation's Influencer program and receive a monthly fee for using their TradingView charts in my analysis.

XRP will Rise!XRP at a SUPPORT zone. Got some confirmation for it bouncing back. Waiting for Trend Reversal confirmations. Before the end of the year there could be a great spike for the major cryptocurrencies.

$BTC Probably nothing.CRYPTOCAP:BTC Probably nothing.
Bitcoin RSI is still above 50, which is a definite area for a reversal.
Furthermore, the MA25, VWMA and SMA 26 are still strongly supporting the price, just as they have in previous reversals.

DeGRAM | BTCUSD is continuing to correct📊 Technical Analysis
● BTC/USD is testing the main support trendline of a long-term ascending structure. A confirmed close below this level could trigger a decline toward the $100,000–$97,000 zone.
● The price has repeatedly rejected from the descending resistance channel, showing weakening bullish momentum and confirming potential continuation of the correction phase.
💡 Fundamental Analysis
● Bitcoin faces pressure as risk sentiment cools following Fed comments about higher-for-longer rates and slowing institutional inflows.
✨ Summary
● Short bias below $107K; targets $100K–$97K. Breakdown confirmation may extend medium-term bearish movement.
-------------------
Share your opinion in the comments and support the idea with a like. Thanks for your support!

BTC/USD poised to navigate deeper water?Following a 4.6% fall in October, November is already down by 5.2%, with today’s movement dipping a toe under key support between US$104,866 and US$107,692 (1M levels). This follows a rejection of resistance at US$116,344-US$114,530 (composed of 1M and 1W levels), and suggests the major cryptocurrency is headed back under US$100,000.
Below US$104,866-US$107,692, which could serve as resistance soon, limited support is evident until between US$93,902 (3M) and US$97,578 (1M). Therefore, further bearish scenarios could soon unfold.
Written by the FP Markets Research Team

Bitcoin (BTC/USD) Market Analysis | November 2025The overall bias remains unchanged from the previous outlook. After BTC touched the 103,500 level on Oct 17, 2025, we saw a brief bullish push toward the 116,329 resistance zone.
However, price was rejected three times, and the daily candle never closed above this level — confirming it as a strong supply zone.
🔹 The rejection aligns perfectly with the 50% Fibonacci retracement, adding solid confluence to the bearish move that followed.
🔹 BTC has now returned to the key area of interest between 104,700 – 90,000, which stands as the final zone to defend for any long-term bullish continuation.
A clear break and daily close below 90,000 would likely invalidate the bullish structure and open the door for deeper downside movement.
#Bitcoin #BTCUSD #CryptoAnalysis #PriceAction #TechnicalAnalysis #Fibonacci #SupportAndResistance #TradingView #CryptoMarket #SwingTrading #MarketUpdate

BITCOIN and stocks, 2021 vs 2025...Bitcoin (BTCUSD) could be entering a new Bear Cycle and as we've mentioned a few times recently, the 1W MA50 (blue trend-line) will play a big part at deciding that. This is basically the level that BTC is testing right now.
What may seem surprising to some, is that while Bitcoin has been correcting, the stock market (S&P500 illustrated by the black trend-line) has been rising making All Time High (ATH) after All Time High. This is not uncommon towards the end of Bull Cycles and has been particularly relevant during the Top of the previous (2021) Cycle.
As you can see, Bitcoin topped 7 weeks before stocks did, as we witnessed heavy profit taking and rotation of those (extraordinary) crypto gains towards stocks. Even the 1W RSI Lower Highs structure is similar between 2021 and 2025. The 4-year Cycle Theory in full confirmation (so far).
If the pattern plays out the exact same way time-wise as in 2021 (often it doesn't), we should be expecting stocks to top around the week of November 24. As for Bitcoin's trend after, following the 2022 blueprint wouldn't be unreasonable at all, as a 1W candle closing below the 1W MA50 would open the way to a 1W MA100 (green trend-line) test, multiple months of ranged price action between the two and then violent crash towards the 1M MA100 (red trend-line).
So do you think Bitcoin has topped and if yes, are stocks about to follow soon? Feel free to let us know in the comments section below!
-------------------------------------------------------------------------------
** Please LIKE 👍, FOLLOW ✅, SHARE 🙌 and COMMENT ✍ if you enjoy this idea! Also share your ideas and charts in the comments section below! This is best way to keep it relevant, support us, keep the content here free and allow the idea to reach as many people as possible. **
-------------------------------------------------------------------------------
💸💸💸💸💸💸
👇 👇 👇 👇 👇 👇

BTCUSD Long: Buyers Defend Demand Zone, Targeting $110,400 MoveHello traders! Bitcoin (BTCUSD) is currently trading within a key structural zone, showing signs of balance between demand and supply after a volatile move. Following the previous sell-off from the $116,000 Supply Area, the price found strong buying pressure near the $106,500 Demand Zone, which coincides with the ascending Demand Line that has been acting as dynamic support for several weeks.
After multiple rejections from the Supply Line, BTC has recently formed a fresh pivot low at the Demand Line — an area that has historically triggered bullish reactions. This reaction zone is particularly significant because it aligns with a confluence of horizontal and diagonal support, increasing the probability of a bounce scenario.
In the short term, I’m watching for a potential bullish rebound from the $106,500–$107,000 zone. A confirmed bounce with strong bullish candles could trigger a move toward the next pivot resistance around $110,400, which sits near the descending Supply Line. This would be the first major target for any short-term long positions.However, if buyers fail to sustain above the Demand Line, a breakdown below $106,000 would invalidate the bullish setup and potentially open the path for a deeper correction toward the next support levels. For now, the most probable scenario suggests a technical rebound toward $110,400, as long as the Demand Line continues to hold. I’ll be watching for confirmation signals such as higher lows or bullish breakouts to enter a long position. Manage your risk!

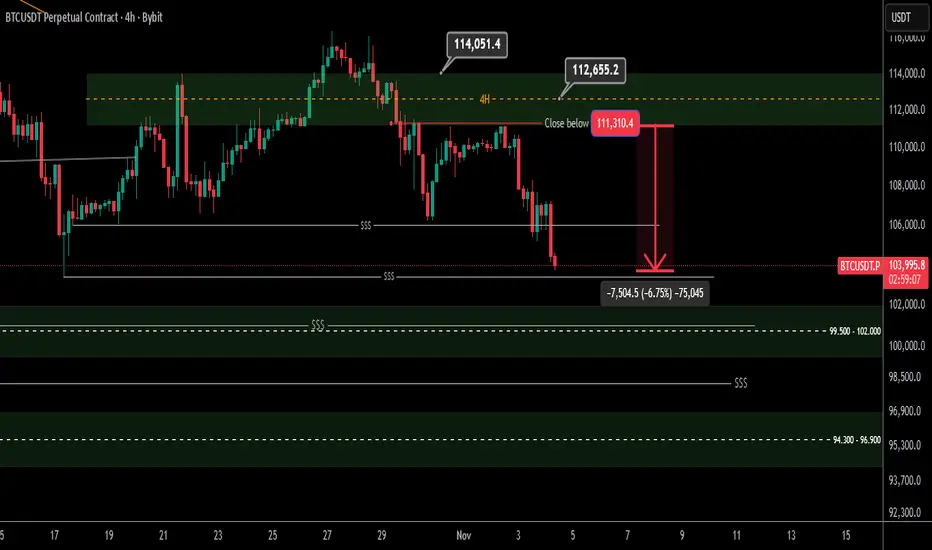
DeGRAM | BTCUSD returned to the $111k level📊 Technical Analysis
● BTC/USD has rejected the dynamic resistance line near 114,000, confirming continuation of the descending structure visible since mid-October.
● A breakdown below 111,000 could accelerate losses toward the 106,000–105,000 dynamic support zone, completing a corrective leg within the broader channel.
💡 Fundamental Analysis
● Bitcoin faces pressure from hawkish Fed expectations and reduced ETF inflows, while profit-taking among large holders weighs on sentiment.
✨ Summary
● Short bias below 114,000; target 106,000–105,000. Technical rejection and macro tightening support bearish continuation.
-------------------
Share your opinion in the comments and support the idea with a like. Thanks for your support!

Bitcoin at the Brink: Breakdown or Breakout?Bitcoin is on the edge of a cliff . If this channel breaks downward, Bitcoin could fall below $100,000. But if the price respects this PRZ (Potential Reversal Zone), we can expect a solid rally toward $111,000, then $117,000, and eventually $125,000.
What do you think—will Bitcoin fall or rise?

BTCUSD: A bullish channel might be formedHello Traders!
Considering the next few days, we might see a buy opportunity for the king of the Cryptos!
General long-term is bullish,
Mid-term is bearish,
we are around a zone,
a week bearish trend seen breakable.
We would trade the possible channel after reaching the activation line.
If SL hit before the activation line, we'll cancel the trade .

Bitcoin 4 Hour Update
Hello Traders
Bitcoin moved towards lower liquidity as expected and so far we have made a loss and profit of about $7000. This will continue to be a bearish structure to gather liquidity and important support below all these liquidity levels will be the 96k/94k range where we will look for a trigger buy
Analysis link and entry range:

BTCUSD Q1 2026 Analysis: Bullish TrendBTCUSD potentially going down to USD 97,000 before going up to USD 149,000 on May 2026
by Jaysen Xavero
-Fibomic

BTC faces a crash, can it hold the $100000 mark?#BTCUSD BITSTAMP:BTCUSD BINANCE:BTCUSDT BITSTAMP:BTCUSD BINANCE:BTCUSDT
Affected by market news, BTC's hourly chart showed a large bearish candlestick, falling to a low of around 104000. Currently, regardless of the time frame, BTC has reached the lower Bollinger Band area, and all moving averages across different timeframes are trending downwards in tandem, with the MACD indicator showing a bearish crossover and increasing volume. There are no signs of a technical reversal yet, and in the short term, BTC still has room for further downward correction.
If 104000 is breached again, BTC may further decline to 102000-101000, or even the psychological level of 100000. It's only a matter of time, and the bulls will temporarily back down.
Therefore, if BTC rebounds to 105500-106500 in the short term, shorting BTC can be considered.
