BTC Loses Structure — Risk of Falling Below $106KBitcoin has officially lost the low-time-frame structure, confirming the end of the previous uptrend zone.
Momentum has shifted to the downside, with sellers gaining control and price now approaching a critical breakdown level.
📉 Current outlook:
BTC remains under $112K, signaling continuation of short-term weakness.
The end uptrend zone around $109K failed to hold support.
Market structure shows potential continuation below $106K if no reversal occurs soon.
📊 Observation:
Buyers have not defended the local range, and repeated rejections near $116K confirm exhaustion of bullish strength.
The next liquidity pool sits below $106K, which could act as the next target zone in this downtrend sequence.
💬 Summary:
BTC has broken its short-term structure — the chart shows clear downside risk with potential move below $106K if pressure continues.
1-BTCUSD

BTC-Moment of TruthBTC-Moment of Truth ⚖️
Zoom out to the #Bitcoin Weekly —
Three distinct ranges, three tops.
Each time BTC broke above one…
it eventually came back to retest that range top as support —
right under the Bull Market Support Band (BMSB).
This latest dip?
No different. BTC has returned to retest the prior range top once again.
If the Satoshi Halving Prophecy is to be fulfilled —
and new ATHs are to emerge this year —
then this weekly + monthly close must reclaim the BMSB with strength.
👉 A close above $114K (ideally above $115.7k-last week’s high)
= Higher High + Bottoming Tail = Momentum Reversal.
Fail here, and the range expands lower.
Reclaim it… and the prophecy breathes.
Stay Sharp... We are at the Moment of Truth!

BITCOIN Has this huge Bearish Divergence started the Bear Cycle?Bitcoin (BTCUSD) continues to be under heavy pressure in the past 4 weeks since the October 06 All Time High (ATH) and finds itself battling to hold the 1W MA50 (blue trend-line) as Support. That trend-line has been basically the Support of this Bull Cycle since March 2023, and acted as the most optimal long-term buy level.
** Has the Bull Cycle ended? **
However this Bull Cycle may have very well come to an end already as the 1W RSI has been long exhibiting the same kind of bearish pattern (Lower Highs trend-line), while also having completed the 4-year Cycle, that all previous Bull Cycles formed on their respective tops. This is a huge Bearish Divergence formation as it goes against the price's Higher Highs, indicating trend exhaustion.
As you can see that 1 RSI Lower Highs trend-line formed the November 2021, December 2017 and December 2013 Cycle Tops. Even worse, the current Lower Highs trend-line has been going on since the March 11 2024 High. If BTC closes a 1W candle below its 1W MA50, it has greater probabilities to confirm the start of the new Bear Cycle as all previous ones did on such break-out.
** If yes, how much can it drop? **
Now, it might not be too relevant at this time yet, but as far as how low the Bear Cycle can go to before it bottoms, there are three potential levels of interest where long-term investors can Dollar Cost Average (DCA).
The January 2015 Bear Cycle bottom was formed on the 1W MA200 (orange trend-line). Then the December 2018 Bear Cycle bottom was formed on the 1W MA200 and the 0.382 Fibonacci retracement level from the previous bottom. The last Bear Cycle has its bottom below the 1W MA200 and on the next Fib in line, the 0.5 level. The decline on each Bear Cycle that followed decelerated and was less than the previous (-86.70% to -84.19% to -77.22%).
If the new Bear Cycle has already started then the first level for a potential bottom is again the 0.382 Fib around $58000 where contact may potentially be made with the 1W MA200 as well. If it follows the previous Bear Cycle and bottoms on the 0.5 Fib, it will also be below the 1W MA200 around $45000. If on the other hand it goes a Fib level further, as the last two Cycles did, we are looking at the 0.618 Fib as a potential strong bottom candidate around $35000. That will also be a -70.76% decline from the Top, which will be -7% less than the previous Bear Cycle, which is also the difference that the 2022 Bear Cycle had from the 2018 one.
So what do you think? Has the Bull Cycle ended already and if yes, how low can the new Bear Cycle go? Feel free to let us know in the comments section below!
-------------------------------------------------------------------------------
** Please LIKE 👍, FOLLOW ✅, SHARE 🙌 and COMMENT ✍ if you enjoy this idea! Also share your ideas and charts in the comments section below! This is best way to keep it relevant, support us, keep the content here free and allow the idea to reach as many people as possible. **
-------------------------------------------------------------------------------
💸💸💸💸💸💸
👇 👇 👇 👇 👇 👇

October 29 Bitcoin Bybit chart analysis (FOMC)Hello
It's a Bitcoin Guide.
If you "follow"
You can receive real-time movement paths and comment notifications on major sections.
If my analysis was helpful,
Please click the booster button at the bottom.
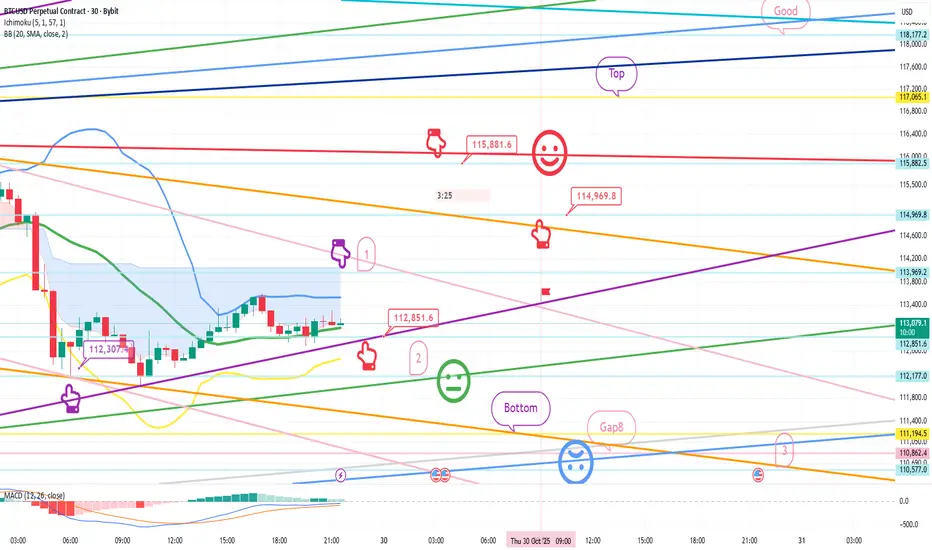
Here's a 30-minute Bitcoin chart.
Shortly, at 11 AM, there will be Nasdaq data releases.
At 3 AM, the FOMC releases data.
Unfortunately, yesterday's BTC move, which involved long and short positions, led to a strategy failure, so today's analysis will be completely public.
I ask for your support.
On the left, the purple finger connects yesterday's final long position entry point, the third section at $112,307.4.
While the interest rate cut is fundamentally positive,
I calculated the Nasdaq price fluctuations and implemented my strategy.
While there may be significant movements early in the morning,
BTC has many important elements, so I recommend reading carefully.
*Conditional Long Position Strategy: When the Red Finger Moves
1. After confirming that the purple finger touches the first section at the top,
the red finger marks the entry point for a long position at $112,851.6.
/ If the green support line is broken, set a stop loss price at $115,881.6.
1st target for a long position: $115,881.6 -> Target price at Top, Good, in that order.
If the strategy succeeds until the first target is touched, $114,969.8 is the point where the long position can be re-entered.
If the red resistance line is broken,
an uptrend could immediately resume.
If the price fails,
there's a possibility of another strong correction.
If the top section is touched before tomorrow's daily candlestick formation,
since this is the resistance line on the daily Bollinger Band chart,
a strong correction is likely,
it would be a good idea to enter a short position and then wait for a long position.
From the first section at the top to the orange resistance line,
a strong rebound is possible, so I don't recommend shorting.
If the price drops immediately without touching the first section,
then I recommend waiting for a final long position in the second section. If the green support line is broken,
then a pullback to the Gap 8 section at the bottom is highly likely.
Please note that if the green support line is broken,
then a pullback to the Gap 8 section at the bottom is highly likely.
Up to section 3 is open,
but this section is connected to the medium-term uptrend line,
so long positions should be held at all costs.
Yesterday's move also broke the first and fourth sections without any support,
breaking the medium-term pattern.
Since the 12-hour MACD dead cross isn't yet considered risky,
I proceeded as safely as possible, as the Nasdaq's movements were in line with it.
Please use my analysis to this point for reference only.
I hope you operate safely, adhering to principled trading and a stop-loss system.
Thank you.
BTCUSDT – Hawkish Fed Sends Bitcoin to Test Its 200‑Day LineBitcoin extended losses this week as Fed Chair Jerome Powell’s hawkish tone cooled expectations for another rate cut. The move left traders torn between short-term risk-off signals and long-term technical support.
The Fed’s second straight 25-basis-point cut was widely expected, but Powell’s comments hinted that the central bank may pause before easing further. That shift strengthened the dollar and Treasury yields, weighing on crypto and risk assets. Bitcoin slipped around 3% to below $108 000 before finding temporary footing.
🔹 Macro & Sentiment
Powell’s message was clear: the committee remains divided, and caution may prevail into year-end. That triggered profit-taking across risk markets. Meanwhile, Trump’s “amazing” meeting with Xi Jinping and a new trade truce added volatility, but digital assets lagged the optimism seen in equities — a sign of hesitation among crypto traders.
🔹 Chart & Levels
BTC is now testing its 200-day moving average near $110 000, a level that has defined the broader uptrend since summer. Below that, key support sits at $107 000 and $100 000. Resistance remains around $120 000–$127 000. A clean bounce from the 200-day line could restore bullish momentum, while a break beneath it would expose the lower range.
As long as $110 k holds, bias stays cautiously bullish toward $120 k+. Below $110 k, the outlook turns more corrective.
🧾 The Takeaway
Fed caution has slowed Bitcoin’s momentum but not yet reversed its trend. The next major move depends on whether the 200-day line can hold under the pressure of a stronger dollar and shifting rate expectations.
Off to you: Will Bitcoin COINBASE:BTCUSD defend its 200-day support or roll over for a deeper correction?

Bitcoin holds above key support while the monthly trend stays inFear comes from chop, not collapse. That matters now because price is sitting on support while the longer chart still points up, which is where the bigger money is made.
My objective is simple. Decide if this drop is a pause inside the monthly uptrend, and map the highest probability path for the next week, the next few weeks, and the next quarter.
The monthly picture is my anchor. On 1M, ADX 14 is 41.95 which signals a strong trend. Price sits well above the 1M EMA 9 at 101766.79 and the 1M SMA 10 at 100687.53, which means pullbacks have room before any structural damage. The 1M MACD line is above the signal with a positive histogram at 2118.32, a sign of trend persistence, even if momentum cooled a bit. The 1M stochastic is overbought at 86.19, which often brings consolidation, not immediate reversal. Translation. Primary uptrend intact, likely sideways to up over the next quarter.
The weekly chart shows the consolidation. On 1W, price is below the 1W EMA 9 at 114030.37 and below the 1W SMA 10 at 113718.48. RSI 14 is 54.5, so momentum is neutral but not weak. The 1W MACD histogram is negative at minus 1113.44, yet it improved from last week, which fits a basing phase. Weekly ATR 14 is about 9297, so swings of nine to ten thousand fit the tape. Conclusion. A test of support is still likely before trend continuation.
Daily tells us where that test happens. On 1D, price hovers near the pivot at 110955.01, with resistance at 112710.01 and support at 108266.28 then 106511.28. The 1D SMA 200 sits at 109213.25, a level buyers care about. RSI 14 is 44.74, which is below neutral and consistent with a pullback. The 1D MACD histogram is positive at 345.64 after a series of higher bars, which often precedes a bounce. Daily ATR 14 is about 3789, so two to three day swings around four thousand are normal.
Intraday texture supports a near term bounce attempt. On 4H, RSI 14 is 43.58 and the stochastic %K turned up to 42.17 from deeply oversold. MACD histogram is still negative at minus 487.12, which is why any bounce should first aim for resistance rather than blue sky. The 4H pivot sits near 110294.59 and VWAP 50 on 4H at 111433.88 is the next tactical magnet.
Key levels I care about. Daily resistance 112710.01. Daily pivot 110955.01. Daily SMA 200 109213.25. Supports 108266.28, 106511.28, 103822.55. If buyers keep price above 109213.25, the path of least resistance is a grind back to 112710.01. Lose 108266.28, and the market likely tags 106511.28 where prior demand sits.
Here are the targets, chosen by timeframe and probability, with moves sized by ATR.
Short term, next 5 to 10 days. I expect a bounce toward 112700 which aligns with daily R1 at 112710.01. Probability about 60 percent, since 4H momentum is turning up and the 1D MACD histogram is rising, while the 1D SMA 200 at 109213.25 offers nearby support.
Medium term, within 4 to 8 weeks. I expect a retest of 106500 which aligns with daily S2 at 106511.28 and fits a weekly consolidation. Probability about 55 percent, because the 1W trend is neutral, price is below weekly moving averages, and weekly ATR allows a drop of this size without breaking the 1M uptrend.
Long term, by Q1 2026. I expect a push toward 123800, near the 1M upper band at 123481.59 and below the swing high at 126199.63. Probability about 65 percent, since 1M ADX is strong, moving averages are rising, and the monthly trend has not been violated.
Bottom line. This is a pullback inside a larger uptrend. Respect 109213.25 on the daily, trade the bounce to 112700, be ready for a weekly dip toward 106500, and keep sights on 123800 into the first quarter.

BTC/USD: Wave 5 Launch or Wave Cycle End?BTC/USD: Wave 5 Launch or Wave Cycle End?
📈 Weekly Scenarios
Bullish scenario: Price holds above ~$110,000, breaks through ~$120,000 → wave (5) strengthens → possible rise to ~$135,000-140,000.
Consolidation: Price trades between ~$110,000 and ~$120,000 without a formed structure, the market is paused.
Bearish scenario: Break of support at ~$110,000 with volume → corrective wave A-B-C → possible decline to ~$100,000-105,000.
✅ Conclusion
On the weekly timeframe, BTC/USD is at a key turning point: either an upward impulse (wave (5)) or the beginning of a major correction.
Holding support at ~$110,000 is the basis for a bullish scenario.
A breakout of resistance at ~$120,000 is a signal for continued growth.
A breakout below ~$110,000 is a signal for a change in structure.

Bitcoin Approaches Key Resistance — Bulls Eye 117K BreakoutHello traders, I want to share my view on Bitcoin (BTCUSD). The current market structure shows a gradual recovery phase following the previous breakdown from a large range near the 118,000 level. After a sharp decline and retest of the 106,400 support zone, the market found strong buying interest, forming a new ascending channel structure. This setup has been characterized by steady higher highs and higher lows, confirming the presence of short-term bullish momentum. At this stage, BTCUSD is approaching a key resistance level around 116,000, which aligns with both the upper boundary of the current channel and the prior horizontal resistance zone — a region that previously acted as a strong supply area. This confluence suggests that the market could face a short-term pause or pullback before attempting another bullish impulse. My primary scenario anticipates that if the price holds above the support line near 113,000–113,500, buyers may maintain control and push toward the 117,000 target (TP1) — the next logical resistance level and the top of the channel. However, a clear rejection from 116,000 without follow-through could open the door to a corrective pullback toward 110,500–111,000 for another demand test. In my opinion, the structure remains bullish in the short term, as long as the lower boundary of the ascending channel holds. Therefore, I continue to favor a long scenario with a TP at 117,000, expecting a potential breakout or test of the upper resistance. Please share this idea with your friends and click Boost 🚀

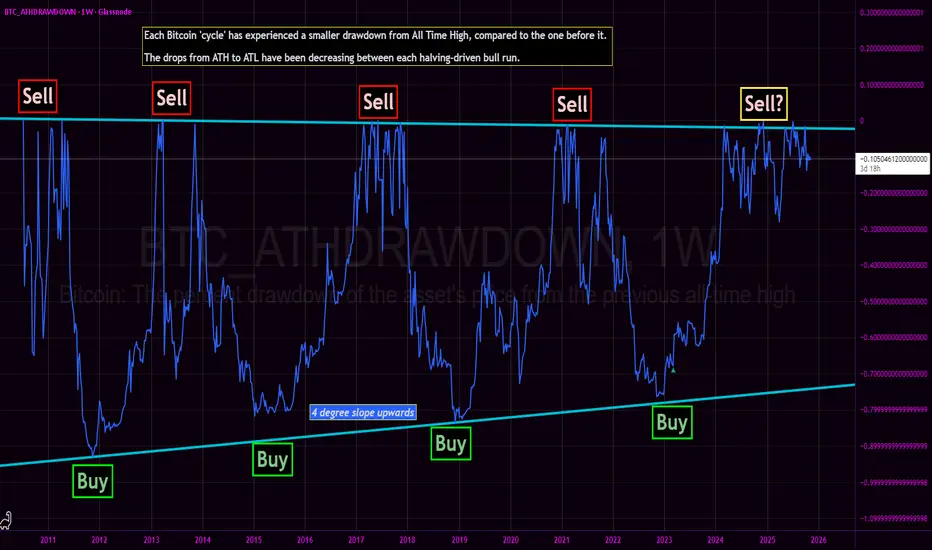
Bitcoin All Time High Drawdown - Bottom nowhere in sight?We revisit the Bitcoin All Time High Drawdown chart originally published in March 2023.
The core thesis of the BTC_ATHDRAWDOWN chart remains intact: each subsequent market cycle has exhibited a diminishing drawdown from its prior All-Time High, with generational cycle bottoms resting squarely on a discernible upward-sloping diagonal support (the 'Buy' line). The 2022-2023 bear market bottomed perfectly on this structural trendline, confirming the '4 degree slope upwards' trend.
Current Cycle Progress: The Sawtooth Fractal
Following the decisive breakthrough of the 2021 All-Time High, price action has entered an unprecedented and structurally complex phase. We are currently witnessing a prolonged high-frequency sawtooth waveform of continuous All-Time Highs.
This action represents the longest sawtooth fractal near ATH of any cycle prior.
This is a stark deviation from the swift, parabolic ascents that characterized previous blow-off tops:
Contrasting the 2017 Pattern: The 2017 bull run culminated in a sharp, almost vertical run-up to $20,000, immediately followed by a steep and rapid crash. That was a classic V-top.
The 2024/2025 Pattern: Instead of a quick V-top, the market is engaged in an extended, messy distribution/consolidation phase right at the very peak. The continuous setting of new, marginal ATHs followed by sharp, shallow pullbacks creates a dense, high-frequency signal in the ATH Drawdown chart.
This structural evolution—a prolonged struggle to hold and marginally exceed previous peaks—suggests that the market is either building a much larger, more resilient base for an extended super-cycle, or undergoing a slow, drawn-out distribution that fundamentally alters the historical BTC cycle cadence.
This is not financial advice, and presented merely as conjectural musing.
BTC/USD Timeframe 4H ..🔍 Chart Overview
Pair: BTC/USD
Timeframe: 4H (Bitstamp feed)
Current price: ≈ $110,300
Pattern: Downward channel breakout → retest → bullish continuation expected
Indicators: Ichimoku Cloud showing price above Kumo with bullish bias.
Support zone: around $108,000–$109,000 (highlighted pink zone).
---
⚙ Technical Setup
This looks like a bullish breakout of a descending channel:
Price broke out of the downtrend channel.
It’s currently retesting the upper boundary of that channel (around $109–110k).
If the retest holds, bullish continuation targets are projected based on the height of the channel.
---
📈 Target Calculation (Based on Chart)
The chart marks two “Target Points”:
1. First Target Point: around $120,000
→ This is a near-term target based on the first measured move after breakout.
2. Second Target Point: around $125,000–$126,000
→ This aligns with a full measured move or Fibonacci extension (1.618 zone).
---
🎯 Target Summary
Target Level (approx) Type Notes
Target 1 $120,000 Conservative First major resistance / take-profit zone
Target 2 $125,000–$126,000 Aggressive Full channel projection / secondary target
Support Zone $108,000–$109,000 Retest area Should hold for bullish setup to remain valid
---
🧭 Plan Summary
Bullish bias remains valid as long as BTC stays above $108k–$109k.
Break below $108k could invalidate the breakout and suggest deeper retracement toward $105k.
Upside targets: $120k → $125k
---

USDCAD falling!USDCAD struggling to stay up.High probability of it falling down. Let's see if the news changes the outcome.

BTC-----Sell around 110800, target 109500 areaOctober 30th BTC Contract Technical Analysis:
On the daily chart, yesterday's close was a small bearish candle, with consecutive negative candles and the price below the moving average. The accompanying indicators show a golden cross with decreasing volume. Although the current trend leans towards a downtrend, we still need to pay attention to the continuation of the price movement and potential breakouts. The short-term trading strategy remains unchanged. On the hourly chart, yesterday's US session saw downward pressure, followed by a correction in the early morning and a continuation this morning. The current candlestick pattern shows consecutive bearish candles, and the accompanying indicators show a death cross, suggesting a high probability of continued downward movement today.
Today's BTC Short-Term Contract Trading Strategy:
Sell at the 110800 area, stop loss at the 111300 area, target 109500 area;

BTC UPDATES OCT 30, 2025Beautifully played in the reversal area — perfection isn’t something we predict; it’s something we challenge ourselves to achieve.
Remember, perfection isn’t about prediction — it’s about pushing yourself beyond limits.

BTCUSDT 4-Hour Chart Analysis !!BTCUSDT 4-Hour Chart Analysis
Support and Trend: BTC has bounced off the ascending trendline and is currently holding above the $110,000-$111,000 support area (represented by the gray band). The price is respecting both diagonal trendline support and horizontal support, which is a positive sign for bullish momentum.
Key Levels: Immediate resistance is at $112,000-$113,000. A clear break above this area could create room for further growth towards the next major resistance at $123,250-$124,000 (marked at the top).
Outlook: As indicated by the green arrow, the chart suggests a bullish scenario if this area holds, with the potential for upward acceleration towards the $123,000 area.
DYOR | NFA

2 key zones to watch out for!We could either fill CME gap soon & head higher to fill golden pocket or hit golden pocket levels 117.3-118K & then sweep the lows where VWAP, VAL & golden pocket of recent lows aligns at 108-109K!
This more or less aligns with wyckoff (yellow bars)

BTCUSD Breakout: Daily Neckline Close Targets 122,000–124,500Hello, traders—BTCUSD is coiling inside a broad 1D range after topping near 126,000. Buyers defended the demand zone at 104,000–108,000 and price has since pushed back toward a clear neckline around 116,000 formed by a developing double-bottom (lows from early September and mid-October). The structure is neutral-to-bullish, with momentum improving as price rebounds from the lower boundary.
Primary path: a daily close above 116,000 confirms the neckline break and opens room toward 122,000 first, then the 124,500–125,000 resistance where supply repeatedly capped rallies. If strength persists, watch for a break-and-hold above 125,000 to transition the range into continuation. Trade-wise, the cleaner confirmation is a daily close ≥116,000/116,500 with targets at 122,000 and 124,500 while using the prior breakout area to trail risk.
Alternative: a firm rejection at 116,000 would keep the range intact and invite a pullback toward 111,500. A decisive daily close below 111,500 puts 108,000 back in play; a loss of 108,000 risks a deeper sweep toward the 104,000 floor.
Invalidation for the bullish idea is a daily close back below 111,500 after breakout, or any decisive failure of 108,000 that negates the base. This is a study, not financial advice. Manage risk and invalidations

Logarithmic Trend Looks Bullish AF Could always be wrong, but we are in that part of the cycle where bears and bulls are speculating upon whether the top is in.
In those times it’s best to zoom out and look at the macro, and this is what that trend line seems to suggest.
Strong Recovery, Key Level Ahead $TRUMPAfter the recent crash, $TRUMP/USDT has made a strong comeback, recovering sharply from the bottom with solid momentum.
On the daily timeframe, the price has successfully broken above the key resistance trendline, showing clear bullish intent. However, it’s now testing a major resistance on the weekly chart.
If the price manages to break and close above this weekly resistance trendline, it could trigger an explosive upside move for TRUMP.
DYOR, NFA
Thanks for reading! Appreciate your support and engagement 🙏

ETH: Range-Bound, But Breakdown Could Get UglyOn the CRYPTOCAP:ETH daily chart, the mid-zone is acting as a clear barrier. The price is currently consolidating within a range, caught between the key support zone and this mid S/R zone.
A breakout above could trigger a strong move higher, while a breakdown here would be a scary scenario for the overall market.
DYOR, NFA
Thanks for reading! Appreciate your support and engagement 🙏

#BTC UpdateCRYPTOCAP:BTC Support: $110K | Resistance: $116K
As long as BTC continues to move sideways between these levels, it’s better to avoid using high leverage.
Nothing lasts forever, and that includes this boring price action.
Sooner or later, things will pick up, but now is the time to prepare while no one’s paying attention.
The plan is simple: preserve funds and wait for a breakout, regardless of direction.

Bitcoin strong, Dominance weak.Bitcoin maintained its strength above the major uptrend and support zone, while BTC Dominance broke below the major uptrend and also received confirmation of a retest of the major resistance and major uptrend for the downside.
For altcoins, this is a trend towards the beginning of a new momentum.

Fed Rate Cut Looms: BTC Dip to 95K-100K = Prime Entry Before MooCRYPTOCAP:BTC / #Bitcoin 🪙
Fed Rate Cut Looms: BTC Dip to 95K-100K = Prime Entry Before Moonshot? (October 29, 2025 )
I've been away from the market for a good long while. In essence, nothing much happened during that time.
We're just hanging out in a sideways range, waiting for the big events:
1. Fed Interest Rate Decision
2. FOMC Press Conference
3. Trump and Xi
In just a couple of hours, we'll see that 0.25% interest rate cut. And there'll be a key speech from Jerome Powell.
For today, trader sentiment looks mostly positive, from what I can tell. But I've got this gut feeling the market's gonna dip again.
The sweet spot for entry on Bitcoin should be 95k to 100k. They'll sweep the long liquidity once more, and then we'll head higher. That's how I see this event shaking out.
Charts:
➖ On the 5-day timeframe, that key level around 95k is still holding. Once it's tested, it'll clear the way for a push up to 145k to 200k (the final leg up).
➖ Chart from Coinglass Legend, which shows long trader liquidations stacking up below from $93k to $98k on the Bybit exchange. I figure they'll clear out that liquidity first before we rally.
➖ Big cluster of orders right nearby on the Coinbase crypto exchange at 93k and 100k, which backs up this zone as a hot spot. Whale money's piling in, partly by scooping up those trader liquidations.
As you know, messing with leveraged trades is a risky game.
The smart play is limit orders, and stick to spot only 😀🔥.
#Crypto #Trading #Coinbase #FED #FOMC #STOCK

BTC: Hold Here or Drop to 104K?CRYPTOCAP:BTC is currently retesting a crucial zone after facing rejection from the recent resistance area.
This “important zone” around $111K–$110K will likely decide the next move, a strong hold here could trigger a bounce back toward the highs, while a breakdown below it might open the doors toward $108K or even $104K.
In short — this is a key make-or-break level. Keep a close eye on how the daily candle closes here.
DYOR, NFA
#BTCUSDT #unichartz
