#BTC UpdateCRYPTOCAP:BTC Support: $110K | Resistance: $116K
As long as BTC continues to move sideways between these levels, it’s better to avoid using high leverage.
Nothing lasts forever, and that includes this boring price action.
Sooner or later, things will pick up, but now is the time to prepare while no one’s paying attention.
The plan is simple: preserve funds and wait for a breakout, regardless of direction.
1-BTCUSD

Bitcoin strong, Dominance weak.Bitcoin maintained its strength above the major uptrend and support zone, while BTC Dominance broke below the major uptrend and also received confirmation of a retest of the major resistance and major uptrend for the downside.
For altcoins, this is a trend towards the beginning of a new momentum.

Fed Rate Cut Looms: BTC Dip to 95K-100K = Prime Entry Before MooCRYPTOCAP:BTC / #Bitcoin 🪙
Fed Rate Cut Looms: BTC Dip to 95K-100K = Prime Entry Before Moonshot? (October 29, 2025 )
I've been away from the market for a good long while. In essence, nothing much happened during that time.
We're just hanging out in a sideways range, waiting for the big events:
1. Fed Interest Rate Decision
2. FOMC Press Conference
3. Trump and Xi
In just a couple of hours, we'll see that 0.25% interest rate cut. And there'll be a key speech from Jerome Powell.
For today, trader sentiment looks mostly positive, from what I can tell. But I've got this gut feeling the market's gonna dip again.
The sweet spot for entry on Bitcoin should be 95k to 100k. They'll sweep the long liquidity once more, and then we'll head higher. That's how I see this event shaking out.
Charts:
➖ On the 5-day timeframe, that key level around 95k is still holding. Once it's tested, it'll clear the way for a push up to 145k to 200k (the final leg up).
➖ Chart from Coinglass Legend, which shows long trader liquidations stacking up below from $93k to $98k on the Bybit exchange. I figure they'll clear out that liquidity first before we rally.
➖ Big cluster of orders right nearby on the Coinbase crypto exchange at 93k and 100k, which backs up this zone as a hot spot. Whale money's piling in, partly by scooping up those trader liquidations.
As you know, messing with leveraged trades is a risky game.
The smart play is limit orders, and stick to spot only 😀🔥.
#Crypto #Trading #Coinbase #FED #FOMC #STOCK

BTC: Hold Here or Drop to 104K?CRYPTOCAP:BTC is currently retesting a crucial zone after facing rejection from the recent resistance area.
This “important zone” around $111K–$110K will likely decide the next move, a strong hold here could trigger a bounce back toward the highs, while a breakdown below it might open the doors toward $108K or even $104K.
In short — this is a key make-or-break level. Keep a close eye on how the daily candle closes here.
DYOR, NFA
#BTCUSDT #unichartz

USDCAD outcome.USD has been loosing strength against CAD this week. With the news coming today, let's see if it will confirm pullback and continue falling or gaining strength and climbing.

BITCOIN SIGNAL: SECRET PATTERN ABOUT TO BREAKOUT (massive)!!!!!!Yello Paradisers! Enjoy the video!
And Paradisers! Keep in mind to trade only with a proper professional trading strategy. Wait for confirmations. Play with tactics. This is the only way you can be long-term profitable.
Remember, don’t trade without confirmations. Wait for them before creating a trade. Be disciplined, patient, and emotionally controlled. Only trade the highest probability setups with the greatest risk to reward ratio. This will ensure that you become a long-term profitable professional trader.
Don't be a gambler. Don't try to get rich quick. Make sure that your trading is professionally based on proper strategies and trade tactics .

BTCUSD — Mind Games at the Range Low Pre Ny Session
🧭 Context
Bitcoin is testing the range low at 112.885, holding just above despite multiple wicks below.
Price hasn’t closed beneath structure — and until the 4H confirms, it’s still a game of perception, not breakdown.
Don’t mistake volatility for intent.
Price can sweep liquidity behind higher-timeframe wicks without flipping bias.
As long as the 4H structure holds, the map remains bullish within the 112.885–116.077 range.
🔹Technical Frame
Range intact: 112.885–116.077
4H close below 112.800 = structural shift
Volume stable, delta neutral — no confirmation of breakdown
Possible liquidity sweep event around macro news
Focus zone: 113.200–114.000 for reactive setups
💡Macro Note
With today’s data on deck, short-term volatility spikes are expected.
Let the reaction confirm direction — not emotion.
This phase is designed to shake conviction, not reward it.
Institutional Logic. Modern Technology. Real Freedom.

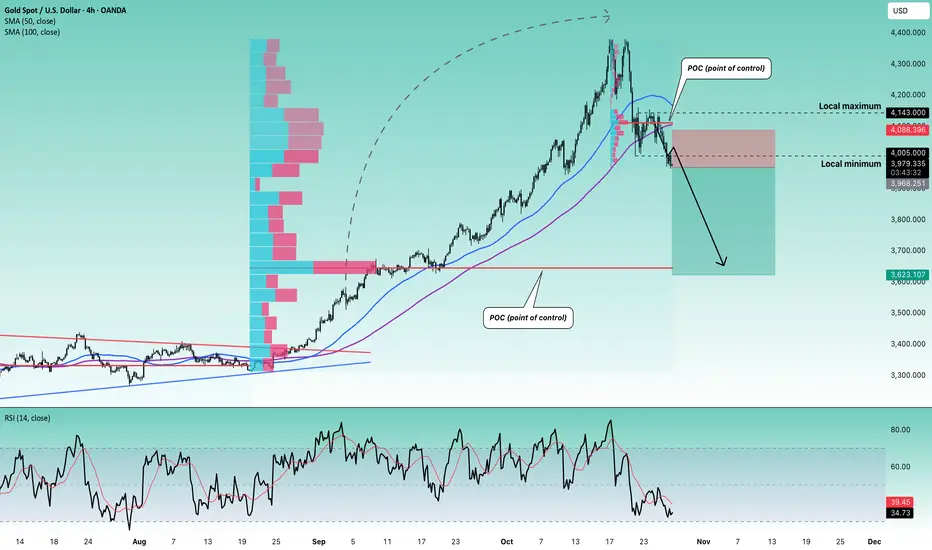
xauusd next target 4161?the next target for XAU/USD (Gold) is highly dependent on its ability to break through key resistance levels, with an immediate focus on the $4,161 area. The upcoming Federal Reserve policy meeting is the primary catalyst that will determine the direction.
The table below summarizes the key price levels and potential targets you should watch.
Timeframe Key Support Key Resistance Bullish Target (if resistance breaks) Bearish Target (if support breaks)
Short-Term $4,004, $3,951 $4,050, $4,161 $4,200 → $4,300 → $4,381 (All-Time High) $3,944 → $3,900
Medium-Term (e.g., 1-3 months) $3,874 - $3,878 - $4,249 - $4,300+ -
🚀 What Will Drive the Next Move?
The consensus among analysts is that the immediate price direction hinges almost entirely on the Federal Reserve's upcoming meeting and subsequent commentary.
The Primary Catalyst: The Federal Reserve
The Rate Decision: A 25-basis-point rate cut is almost fully priced in by the market. Therefore, the decision itself is unlikely to cause a major surprise .
What Really Matters: Powell's Tone: The market will react to the forward guidance from Fed Chair Jerome Powell during his press conference.
Dovish Powell (signaling potential for further easing): This would likely weaken the US Dollar and push gold above $4,161, opening the path toward $4,200 and $4,300 .
Hawkish Powell (suggesting a "cut and pause" approach): This could strengthen the Dollar and trigger a sell-off in gold, pushing it below $4,004 to test the $3,944 - $3,900 support zone .
Supporting Factors
Central Bank Demand: Ongoing accumulation of gold by central banks (e.g., India, China, Germany) provides a solid foundation, limiting severe downside moves.
Geopolitical Tensions: Factors like trade tariffs and global instability continue to bolster gold's role as a safe-haven asset.

October 28 Bitcoin Bybit chart analysis
Hello
It's a Bitcoin Guide.
If you "follow"
You can receive real-time movement paths and comment notifications on major sections.
If my analysis was helpful,
Please click the booster button at the bottom.
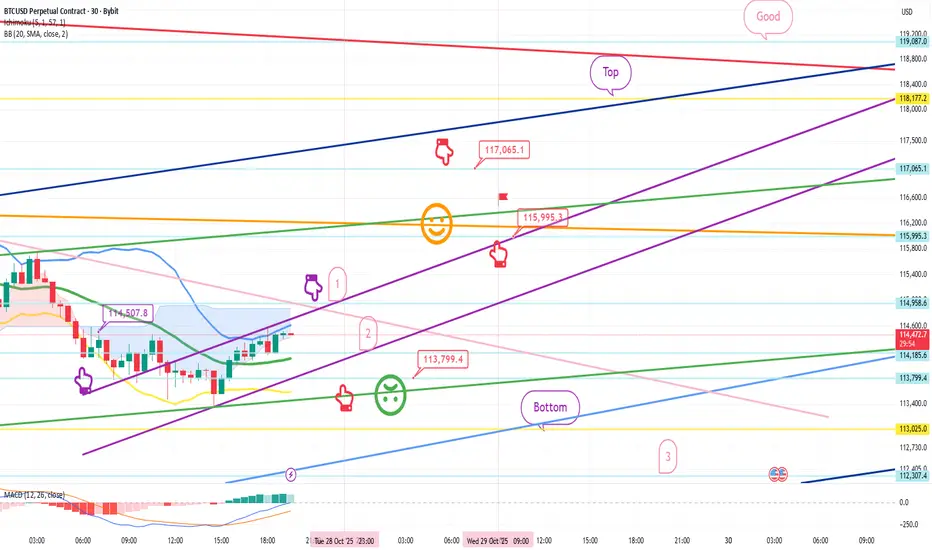
This is Bitcoin's 30-minute chart.
There's a Nasdaq indicator release coming up at 11:00 AM.
Bit has broken its short-term pattern by touching the center line of the 3-hour Bollinger Bands chart.
On the left, the purple finger indicates the entry point for the long position at $114,507.8, which we entered yesterday.
I've followed the same strategy. *Red Finger Movement Path:
Long Position Strategy
1. Confirm that the purple finger touches the first section at the top.
Red finger: $113,799.4 is the entry point for a long position.
/ If the green support line is broken, set a stop loss.
2. $117,065.1 is the first target for a long position. Target prices are set at Top and Good in that order.
If the strategy is successful, 115.9K is the point where the long position can be re-entered.
If the good section is reached before tomorrow's daily candlestick formation,
a correction may occur at the daily Bollinger Band resistance line.
A short position switch can be made.
If the price touches Section 1 at the top and rebounds strongly,
or if Section 2 is touched and rebounds within the purple support line,
a vertical rise is expected.
When the green support line breaks,
I've marked the support line from Bottom to up to Section 3.
Those who entered long yesterday at 114.5K should follow the same stop-loss order today when the green support line breaks.
I hope you'll continue to operate effectively, starting with Section 1 above.
By organizing this,
those who are long, those without a position, and those who are short
will all be able to utilize it.
Please use my analysis to this extent for reference only.
I hope you operate safely, adhering to principled trading and stop-loss orders.
Thank you.
BTCUSD Short: Sellers Aiming for a Pullback Toward 109,600Hello, traders! Bitcoin (BTCUSD) continues to trade within a broader corrective structure after losing momentum from its previous bullish phase inside the Ascending Channel. The breakdown from the channel shifted the short-term sentiment from bullish to neutral-bearish, with sellers now defending the upper boundary of the current Supply Zone. After the strong rejection from the 118K–116K region, BTC entered a range-bound phase between 109,600 (Demand Zone) and 116K (Supply Line). This range represents a period of accumulation or distribution — depending on how the price reacts at its edges.
Recently, the price retested the upper boundary of the Supply Zone, where a fake breakout occurred, followed by selling pressure — a clear sign that supply remains dominant. Now, the market is showing early signs of potential correction back toward the Demand Line near 109,600, where buyers previously stepped in to defend the trend.
If the bearish momentum continues, I expect a move down toward the Demand Zone around 109,600–107,700. This area aligns with both a key pivot point and the ascending demand line, which could act as a springboard for another bullish rebound. Conversely, a confirmed breakout above 116K would invalidate the short-term bearish outlook and signal a possible continuation toward higher resistance levels. For now, my bias remains bearish-to-neutral, anticipating a short-term correction before a potential bullish reaction from the demand area. Manage your risk!

Bitcoin (BTC/USD) - Bullish Continuation from Order Block (OB)The analysis uses concepts from Technical Analysis and Smart Money Concepts (SMC), indicating a short-term bullish bias:
Recent Trend: The chart shows a recent strong upswing followed by a slight pullback. The overall movement from October 27th onwards suggests a continuation of the upward momentum.
Market Structure Shift (MSS): The price recently broke above a local swing high (near $114,500), which is often termed a Market Structure Shift (MSS) in SMC. This break confirmed that the prevailing short-term trend is upward.
Order Block (OB): The gray shaded box, labeled OB, represents an Order Block. This is a specific area where smart money (institutions) may have placed buy orders, and it is identified as a strong area of support.
The current price action shows the price has dropped back into this critical support zone (around $112,500 to $113,500).
Consequent Retracement Levels (CRT):
CRT-L (around $111,800) is the lowest level of the recent swing or the bottom of the structure being referenced for support.
CRT-H (around $116,000) is the swing high, which is also identified as the primary target for the expected bullish move.
Proposed Price Action: The primary black arrow suggests that after testing the OB support zone, the price is expected to turn sharply upward and rally back toward the high at CRT-H ($116,000). The current slight rebound from the OB supports this idea.
Interpretation and Trading Bias
The analysis has a clear bullish continuation bias. The trader is looking for long (buy) entries inside the Order Block (OB) zone, anticipating that the price will hold this institutional support and target the previous swing high at $116,000.

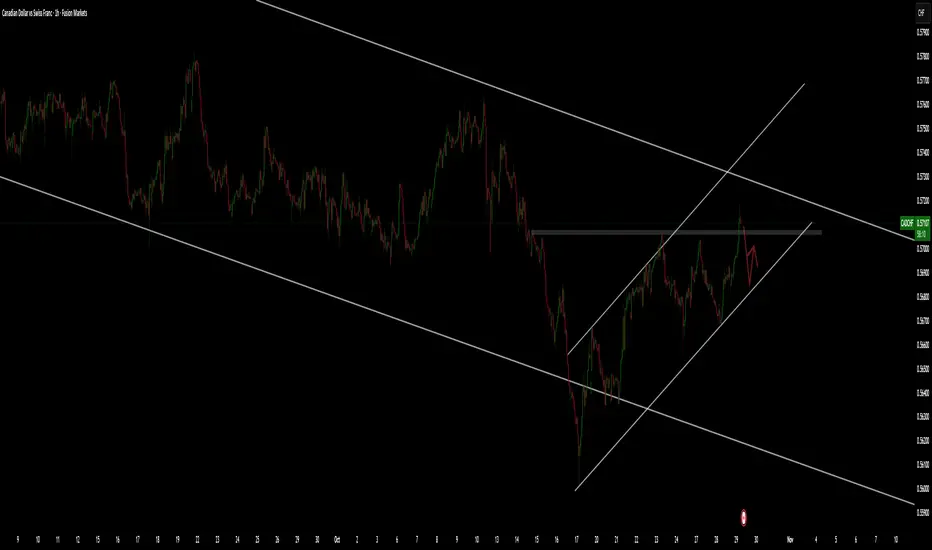
CADCHF pullback.CADCHF has been moving nicely within the channel. But overall it is in the DownTrend and now going for a pull back. If breaks the small channel a possible fall.
GBPCHF climbing back UP!GBPCHF is regaining strength in the London session. Waiting for it to reach RESISTANCE zone and see if it will BreakOut and conquer.


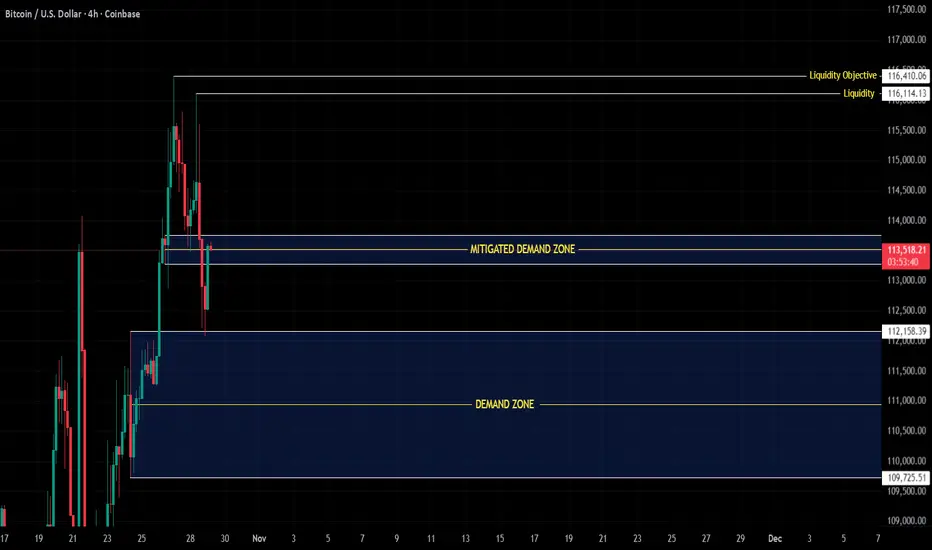
4H Structure Update-Demand Mitigated ,Next Liquidity in Sight
COINBASE:BTCUSD CRYPTO:BTCUSD BINANCE:BTCUSD KRAKEN:BTCUSD
$BTC/Price has reacted strongly from the deeper demand zone (112.15K – 109.70K), showing a clean bullish CHOCH followed by a confirmed BOS on the lower timeframes — signaling early structural alignment for potential continuation.
This reaction confirms mitigation, not reversal, as long as 109.70K remains protected.
Momentum and structure across micro and mid timeframes have now turned bullish, indicating renewed intent from buyers.
The next liquidity objective sits between 116.11K – 116.41K, where previous imbalance and resting liquidity align.
That zone also holds reversal potential, as price may face reaction or redistribution once it reaches those highs.
For now, this remains a healthy corrective phase within the bullish macro structure —
a controlled absorption and expansion sequence in play.
Structure first. Liquidity second.
Confirmation always. 💎
BTC Approaches Golden Pocket for Potential Lower-High ReversalBitcoin on the 4H chart has shown clear recovery after the last major dump toward the $101.5K zone. Since then, price action has formed higher lows under a broken trendline, confirming early bullish structure. The current leg has extended toward $116K, but as the Fed meeting approaches, volatility is expected to increase with potential liquidity grabs on both sides.
The area between $109K–$108.5K remains a key golden pocket where long-side liquidations may occur before any reversal. A sustained bounce or double-bottom formation in this pocket could mark the next leg toward retesting the previous all-time high. As long as BTC holds above $100K psychological support, the market stays in distribution or early markup phase. Patience is key — wait for confirmation before entering long positions.

BTC-----Sell around 113200, target 111700 areaOctober 29th BTC Contract Technical Analysis:
Today, on the daily chart, yesterday closed with a small bearish candle, indicating a continuous decline. The price remains at a high level, and the accompanying indicators show a golden cross. Although the current decline is significant, the price hasn't broken down further, suggesting a range-bound trading pattern. Therefore, our trading strategy should be to sell high and buy low within this range; the high is around 116500, and the low is around 107000. On the hourly chart, the price was under pressure during the US session and continued to decline during the Asian session. Currently, there is a slight rebound, but the trend remains bearish. Therefore, we should expect a further decline and a break below the lows during the European session.
Today's BTC Short-Term Contract Trading Strategy:
Sell at 113200, stop loss at 113700, target 111700.

BTC Updates October 29, 2025Today analysis will remain the same in down trend as predicted a weaken demand and waiting for a new structure and direction to building up.

Stop!Loss|Market View: GOLD🙌 Stop!Loss team welcomes you❗️
In this post, we're going to talk about the near-term outlook for GOLD ☝️
Potential trade setup:
🔔Entry level: 3968.251
💰TP: 3623.107
⛔️SL: 4088.396
"Market View" - a brief analysis of trading instruments, covering the most important aspects of the FOREX market.
👇 In the comments 👇 you can type the trading instrument you'd like to analyze, and we'll talk about it in our next posts.
💬 Description: Metals have broken the lower border of previously identified accumulations. For gold, this is the price range of 4005 - 4143, indicating a highly probable downward impulse previously anticipated toward the 3600 - 3700 region. Currently, the main scenario is a breakout and entry around 3970. If the stop loss is triggered, re-entries can be considered.
Thanks for your support 🚀
Profits for all ✅
❗️ Updates on this idea can be found below 👇
BTC. a longterm perspective :(I read that this recent BTC strength was caused by retail investor wave and that whales are sleeping. If we look from a longterm perspective -> we forget initial CUP n HANDLE pattern, and where it's next PEAK was.
this was also a 3rd wave. Still bullish longterm tho.

Bitcoin : Stay heavy on positionsBitcoin : Stay heavy on positions (3x)
Maintaining the same outlook as before.
** This analysis is based solely on the quantification of crowd psychology.
It does not incorporate price action, trading volume, or macroeconomic indicators.

ATCryptoScan: BTCUSD Waiting to spring into 2026 TOPSo, from previous posts... outcome comments in white. Self-explanatory, close enough, good enough.
Importantly, going forward...
1. wide range moves expected
2. 100K bounce in December, rally to Top
3. Top likely 160K in early Feb 2026
Technically, MACD is losing steam, but it price can be pumped. Weekly candlesticks have a bit of a bullish harami, so look out until Monday for a strong bounce to end the week bullish. Else, pushing down to 100K to make a sandwich stack candlestick.
Heads up yeah?
Short sharp and sweet...

BTC could potentially drop by 50%BTC could potentially drop by 50%, as it has already completed three bull runs and appears to be forming a reversal pattern. (Not financial advice.)
