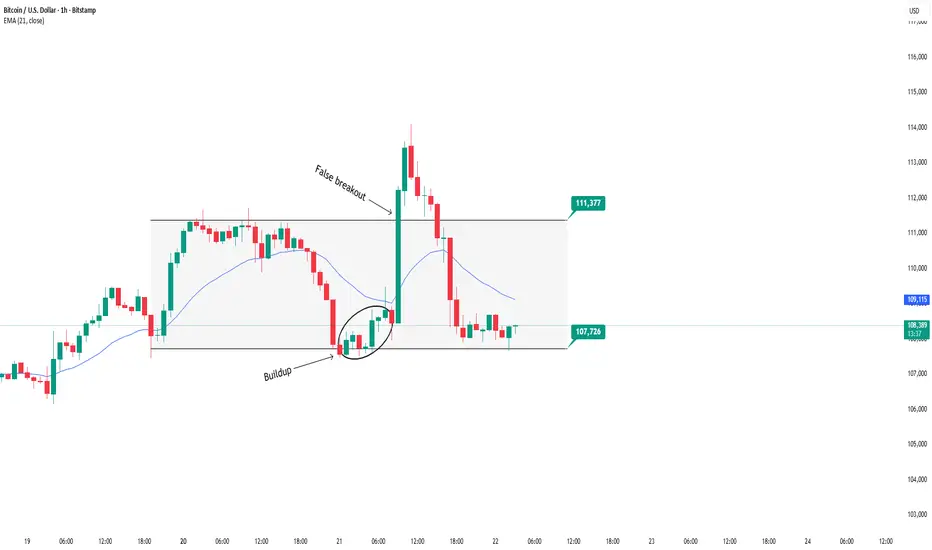
BTCUSD: Sideways - Watch for setup near range boundariesBITSTAMP:BTCUSD Analysis – October 22, 2025
BITSTAMP:BTCUSD is currently trading within a sideways range between 107,726 and 111,377 USD. After a breakout attempt, the price formed a buildup zone near the lower boundary of the range and surged upwards. However, it then created a false breakout at the upper boundary before pulling back to retest the previous buildup area.
This false breakout was caused by weakening buying momentum after breaking above the range, partly because the buildup zone was too far from the upper boundary, limiting the follow-through. According to yesterday’s plan, we are waiting for a buildup close to the upper boundary and EMA compression to confirm a valid breakout.
Trading plan for today:
Look to sell when price forms a buildup near the lower boundary of the range with EMA compressing close. Enter the trade upon the appearance of rejection signals such as RB or ARB.
The buy setup has not yet formed clearly but may be considered if an IRB appears within the larger BTC range.
In summary, BTC is still in an accumulation phase. Prioritize waiting for confirmed signals before entering trades to minimize risk.
Daniel Miller @ ZuperView
1-BTCUSD
Bearish reversal for Bitcoin?The price is rising towards the pivot and could reverse to the pullback support.
Pivot: 108,846.88
1st Suport: 104,701.40
1st Resistance: 113,431.55
Disclaimer:
The above opinions given constitute general market commentary, and do not constitute the opinion or advice of IC Markets or any form of personal or investment advice.
Any opinions, news, research, analyses, prices, other information, or links to third-party sites contained on this website are provided on an "as-is" basis, are intended only to be informative, is not an advice nor a recommendation, nor research, or a record of our trading prices, or an offer of, or solicitation for a transaction in any financial instrument and thus should not be treated as such. The information provided does not involve any specific investment objectives, financial situation and needs of any specific person who may receive it. Please be aware, that past performance is not a reliable indicator of future performance and/or results. Past Performance or Forward-looking scenarios based upon the reasonable beliefs of the third-party provider are not a guarantee of future performance. Actual results may differ materially from those anticipated in forward-looking or past performance statements. IC Markets makes no representation or warranty and assumes no liability as to the accuracy or completeness of the information provided, nor any loss arising from any investment based on a recommendation, forecast or any information supplied by any third-party.

Perfect prediction of BTC trend, today's retracement continuesWith the emergence of the double top structure, gold and silver investors have been taking profits, and market funds have continued to flow into crypto assets led by BTC and ETH.
Historically, BTC and the broader cryptocurrency market have risen after gold peaks, driven by capital rotation.
In his opening remarks at the Federal Reserve's first Payment Innovation Conference held today, Federal Reserve Governor Waller spoke highly of cryptocurrencies and the "DeFi industry." Waller noted that the conference aims to explore how blockchain and cryptocurrency can be integrated into mainstream finance.
At the same time, the Federal Reserve also indicated that it would create a new era in the payment field, and the DeFi industry would not be doubted or despised.
Waller also revealed that he has proposed setting up a new type of account at the central bank, which he called a "payment account." Waller said he has asked the Fed to consider this new type of account, which would make it easier for businesses to access the central bank's payment channels without having to have a full master account. This move has clearly increased market attention for cryptocurrencies.
In the subsequent BTC trading market, we can once again use 109500-108500 as short-term support, and go long on pullbacks to see rebounds. Pay attention to the 113000-115000 resistance zone above. If the momentum is maintained, it may move towards 120000.
BITSTAMP:BTCUSD BITSTAMP:BTCUSD

BTCUSDT — at Edge of the Trend: Bullish or the Next Bear Trap?Main Narrative
Bitcoin is standing at a critical crossroads. After a deep correction from the 126K peak, the price is now forming a Symmetrical Triangle Pattern — a classic setup that appears when the market holds its breath before a major move.
Pressure from both sides — a descending resistance from sellers above and an ascending support from buyers below — is squeezing the price closer to the apex, the point where a decisive breakout becomes inevitable.
The next movement will decide whether the bulls regain control or the bears reclaim dominance.
---
Pattern & Structure Analysis
This triangle has formed after a strong downtrend, signaling a phase of consolidation and uncertainty.
There was one false breakout to the upside (yellow ×) — a typical liquidity trap where market makers lure buyers before pulling the price back inside the pattern.
Currently, Bitcoin remains trapped between:
Descending resistance (upper yellow line): around 110K–112K
Ascending support (lower yellow line): around 106.7K
This is a pressure zone — the longer the price stays inside, the more explosive the breakout will be once it happens.
---
Key Levels
Main Resistance: 110K – 112K (breakout zone)
Primary Support: 106.7K (bulls’ last stand)
Secondary Support: 103.6K and 102.1K (critical continuation zone)
Bullish Targets: 116K–118K (retest of previous resistance), and up to 126K if momentum expands
Bearish Targets: 103K → 102K → potential breakdown continuation below 100K if selling pressure dominates
---
Bullish Scenario — “Real Breakout or Just Another Trap?”
If the 4H candle closes above 112K with strong volume confirmation:
Buyers regain short-term control.
First target lies around 116K–118K (prior supply zone).
Sustained momentum could lift the price back toward 126K — the previous major high.
However, without volume confirmation, any breakout could turn into a second fake rally, often followed by a sharper decline.
---
Bearish Scenario — “Support Break = Bearish Continuation”
If the price breaks below 106.7K, confirmed by a strong 4H close and rising sell volume:
The breakdown could drive the price toward 103.6K, then 102.1K.
A confirmed close below 102K may trigger panic selling and open a path toward the next psychological zone below 100K.
In this case, the triangle would represent a continuation pattern, not a reversal — signaling further downside.
---
Market Psychology
This chart perfectly reflects a battle of patience between buyers and sellers.
The longer the consolidation lasts, the more energy builds up behind the next move.
Experienced traders know: long consolidations often end with violent breakouts.
---
Strategy & Key Notes
Wait for a confirmed 4H candle close beyond the triangle with strong volume.
Breakouts without volume = traps.
Keep position size small until direction is confirmed.
Enter only after a successful breakout retest to reduce risk exposure.
---
Conclusion
Bitcoin is entering a decisive phase.
A confirmed breakout above 112K could ignite a bullish run toward 116K–126K,
while a breakdown below 106K would confirm that the market is leaning back into a bearish phase.
This isn’t just another triangle — it’s a critical point that will define the medium-term trend for Bitcoin.
---
#Bitcoin #BTCUSDT #CryptoAnalysis #Breakout #TechnicalAnalysis #TrianglePattern #BTC #CryptoTrading #CryptoMarket

USDT.D Breaks Out, Altcoin Correction Ahead?USDT.D has broken above the resistance trendline and is now forming higher highs and higher lows, a clear sign of a bullish structure shift.
If the price breaks above the next resistance, we could see more correction across altcoins.
Keep an eye on USDT.D and stay tuned for further updates.
DYOR, NFA

Bitcoin UpdateBTC/USD — The Range Squeeze Tightens: Volatility Decides Direction
Bitcoin remains confined within a bearish range between 113 000 and 116 000. Price sits on the sell side of deviation but has yet to return to discount since yesterday’s flush.
The active range squeeze forms between the bullish point of control near 104 000 and the bearish point of control near 111 000, where both sides continue to fight for conviction. Yesterday’s session cleared heavy bullish liquidation, leaving direction to whoever reclaims volume first.
Structure: Fibonacci geometry shows BTC pressing into bearish oversold zones. Momentum remains reactive—better suited for short, tactical trades.
Order Flow: Sellers defended the 114 000 region; volume still favors supply at the upper band.
Execution: Expect consolidation until a new catalyst breaks the compression.
Upcoming events—U.S. jobless claims, Fed remarks, and tech earnings—may reset volatility. Liquidity tone stays cautious; ETF inflows paused, and yields remain firm.
Patience isn’t waiting—it’s refusing to act in confusion.
For now, watch for a 1H structure shift lower or renewed bearish momentum.
Bounces toward 111–113 k remain tactical until a daily close confirms otherwise.
Bitcoin is coiled inside a range squeeze. One side will lose soon. Until then, probability—not prediction—defines discipline.
— CORE5DAN
Institutional Logic. Modern Technology. Real Freedom.

Market Seasonality: Finding Statistical Edges in Price Patterns🟢 Overview
Market seasonality refers to recurring, quantifiable patterns in asset price movements that appear consistently across different time periods. Rather than mystical predictions, these patterns reflect systematic behavioral trends, institutional flows, and market structures that have persisted across years, and in some cases, centuries, of trading history.
🟢 How Seasonality Works
Seasonality analysis examines historical price data to identify months or periods when specific assets have historically shown strength or weakness. The approach replaces emotion-driven decision-making with probabilistic insights based on historical performance across complete market cycles, including bull markets, bear markets, and periods of consolidation. By quantifying these patterns, traders and investors can identify potential statistical edges in their execution timing.
🟢 Evidence Across Asset Classes
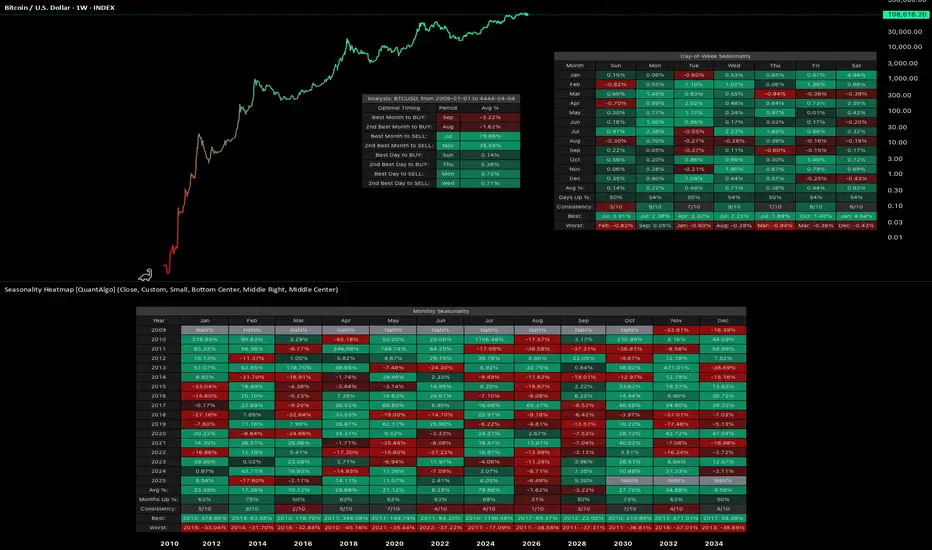
1. Bitcoin INDEX:BTCUSD
Since the development of futures markets and institutional participation, Bitcoin has demonstrated notable seasonal patterns with measurable statistical significance. September has averaged -1.92% returns, establishing it as the weakest month. In contrast, October has emerged as the strongest performer with average returns of +21.59% and a 90% positive occurrence. This level of consistency suggests a robust statistical edge rather than random variation.
Day-of-week patterns in modern Bitcoin are relatively tight, with differences ranging from 0.07% to 0.50%. Monday edges out as the optimal day for selling positions. However, these daily patterns offer considerably less statistical significance than the monthly seasonality effects, as the weekly variations have smoothed out compared to Bitcoin's earlier history.
2. Ethereum INDEX:ETHUSD
Ethereum displays even more pronounced seasonal variations with stronger directional bias. September has been particularly challenging, averaging -10.04% returns and showing negative performance in eight out of ten years, representing an 80% probability of decline. June also demonstrates weakness at -7.20% average returns. Conversely, May stands out as the strongest month with average returns of +34.97%, positive 70% of the time across the dataset. May has delivered positive returns in seven out of ten years, providing a statistically meaningful edge.
Day-of-week analysis reveals differences of 0.2% to 0.6%, with Wednesday edging out slightly for selling and Tuesday showing marginally better performance for buying. However, these daily variations lack statistical significance when compared to the dramatic monthly patterns, representing more noise than actionable alpha for systematic strategies.
3. S&P 500 SP:SPX
With over 50 years of data dating back to 1971, the S&P 500 demonstrates the famous "September Effect." September averages -0.90% returns and has been negative with notable consistency, establishing statistical significance through sheer sample size. November, capturing typical year-end institutional positioning, averages +1.73% with positive performance 70% of the time. April comes in second at +1.44% average returns. The persistence of these patterns across five decades provides robust evidence of systematic seasonal effects even in highly efficient markets.
Day-of-week effects in the S&P 500 are minimal, ranging from just 0.01% to 0.07%. Monday shows a slight negative drift at -0.01%, while Wednesday edges up 0.07%. These intraday variations fall well within normal variance and lack statistical significance for execution timing. For this index, monthly patterns provide the primary source of seasonal alpha.
4. Gold OANDA:XAUUSD
Perhaps most compelling is gold's seasonal data spanning nearly 200 years since 1832, offering an extraordinarily large sample size for statistical validation. January shows the strongest average returns at +0.99% and has been positive 80% of the time, representing a highly reliable statistical edge. June represents the weakest period at -0.18% average returns, with October also serving as a potential entry point at just 0.05% average returns. July comes in as the second-best month at +0.79%. The consistency of these patterns across multiple centuries, world events, and monetary system changes indicates deeply embedded structural inefficiencies in market dynamics.
Day-of-week patterns in gold are similarly minimal. Thursday edges out at 0.09% for optimal selling, while Sunday shows 0.01% for buying opportunities. Like the S&P 500, gold trades predominantly on monthly patterns rather than daily variations, with intraweek effects lacking statistical significance.
🟢 TL;DR
1. Bitcoin INDEX:BTCUSD : Accumulate during September weakness (-1.92%), sell into October strength (+21.59%). October has been positive 9 out of 10 years since 2015, representing a 90% positive occurrence. Day of week: Sunday dips for buying, Monday for selling.
2. Ethereum INDEX:ETHUSD : Summer pain is real. September (-10.04%) and June (-7.20%) are buying opportunities. May (+34.97%) is the monster month historically, positive 7 out of 10 years (70% positive frequency). Day of week: Tuesday buying, Wednesday selling, but minimal statistical significance.
3. S&P 500 SP:SPX : The September Effect demonstrates statistical significance (-0.90% average over 50+ years). November (+1.73%) captures the year-end rally with 70% positive occurrence. Day of week effects are negligible (0.01-0.07%) and lack statistical significance.
4. Gold OANDA:XAUUSD : January strength (+0.99%, 80% positive frequency) after June weakness (-0.18%). Nearly 200 years of data backing these patterns provides exceptional statistical validation. Day of week: Sunday buying, Thursday selling, but minimal differences.
🟢 Final thoughts
Ultimately, seasonality analysis does not guarantee future results, but it provides a framework for probabilistic decision-making with quantifiable statistical edges. Rather than attempting to time markets based on sentiment or short-term price movements, systematic traders and investors can align decisions with periods that have historically shown consistent strength or weakness with statistical significance. This approach is particularly valuable for planning entry and exit points, portfolio rebalancing, and managing position sizing within a rules-based framework.
Notably, while day-of-week patterns exist in some assets, monthly seasonality tends to provide more significant and statistically reliable edges across most markets. The data suggests that seasonal patterns persist even in highly efficient markets, driven by recurring institutional behaviors, tax considerations, and structural market dynamics that create exploitable inefficiencies.
Market seasonality should be viewed as one analytical tool within a comprehensive quantitative framework, not a guarantee of performance, but a method to incorporate historical probabilities and statistical edges into systematic investment decisions.
This isn't about perfect timing either. It's about leveraging statistical edges based on historical probabilities instead of emotion. You'll still be wrong sometimes, but less often when operating with decades of data and quantifiable patterns rather than sentiment alone.
👉 Try the Seasonality Heatmap indicator yourself on TradingView to explore these patterns across different assets and timeframes.
*This analysis is for educational purposes only and is not financial advice. Past performance does not guarantee future results. Always do your own research and consult with a qualified financial advisor before making investment decisions.
BTC update — still red, eyes on 109.3K📊 Market Update
BTC lost the +volume in the last 24H. With this time frame, BTC will only be back in the volume zone if it returns to 109.3K.
Until that, BTC stays in breakdown mode.
The new BTC cycle can start from 116K.
For now, we follow daily BTC to see if it turns green — starting from the low time frame, which is still red.
🔹 Market Structure
In the last 12H the market showed a breakdown trend.
In the last 4H, the market is building an accumulation trend — still processing.
Soon, new update with last follow.

BTC-----Buy around 107400, target 109000 areaOctober 22nd BTC Contract Technical Analysis:
Today, the large-scale daily chart closed with a medium-sized negative candlestick pattern. The candlestick pattern showed consecutive positive lines with a single negative line, but the price was below the moving average. The accompanying indicator formed a death cross, and yesterday's closing line had a long upper shadow. Therefore, based on the trend pattern and trend structure, the overall downward trend is still dominant and obvious. Trading should remain short-term, as we are engaged in short-term contract trading. What matters is the success rate and accumulation of profits. We must not mistake the direction. The short-term hourly chart showed a high early morning price rise and then a pullback under pressure. The current candlestick pattern shows a series of negative lines, but the price is near the low support level, so it is not appropriate to sell directly during the day. Watch for a break of the 107,400 area. If it does not break, you can try to buy, with a stop loss at the 106,800 area and a target of 109,000. Real-time trading is based on the real-time intraday trend.

BTCUSDT 2-Hour Chart Analysis !!BTCUSDT 2-Hour Chart Analysis
This 2-hour chart of Bitcoin/USDT shows the shift in price structure, as well as key technical levels and potential scenarios:
Bitcoin has broken out of a long-standing descending trendline and initially retested this breakout.
The market recently reached the resistance area around $111,000-$112,500, marked by the gray band.
Support:
The previous green box ($102,500-$106,000) remains a key demand area below, where buyers previously emerged.
Resistance:
The gray resistance area of $111,000-$112,500 has caused several rejections, but now the price is consolidating just below it after a breakout attempt.
Higher resistance at $123,000-$124,000 remains a distant target.
Retest and Breakout:
After reclaiming the trendline, the price has returned to test support at the breakout level and the lower trendline. This retest is significant: if bulls defend this area, we could see a new uptrend toward the $112,500 resistance area and possibly even higher, as indicated by the green arrow.
Upside Scenario:
If the price remains above the intersection of the trendline and horizontal support, a rally toward $115,000-$117,000 becomes possible.
Downside Risk:
Failure to hold the breakout level could cause the price to retrace to the green support area below $106,000.
DYOR | NFA

Will escalating trade tensions continue to pressure bitcoin?
Investor confidence in Bitcoin is weakening as fears grow over a potential breakdown in US-China talks and accelerating institutional outflows. President Trump hinted that the meeting may not take place, reigniting trade concerns and fueling broader risk aversion that further pressured crypto sentiment. Meanwhile, heightened market volatility and deteriorating risk appetite triggered USD 530 million in outflows from Bitcoin ETFs in a single day.
BTCUSD briefly tested 114000 before consolidating within the range of 106000–114000. The death-crossed EMAs indicate a potential shift toward bearish momentum. If BTCUSD breaks below the 106000 support, the price could retreat toward 100000. Conversely, if BTCUSD breaches above both EMAs and the 114000 resistance, the price may advance toward 126000.

Bitcoin Analysis.I still believe that the markets are still down trending. We will see how prices react to the discount imbalances to see if we get a reaction from the weekly third trend line touch.

BTCUSD Completes Correction – Heading Towards $125,000BINANCE:BTCUSD is currently trading in a well-defined ascending channel, indicating that the bullish trend continues. The price is following the channel's structure, creating higher highs and higher lows, which is a clear sign that the uptrend remains intact. The recent price correction shows a healthy pullback, which could serve as the foundation for the next upward move.
The price is now approaching an important support zone, marked by the lower boundary of the channel and a previous demand zone. If this support holds, it could present an opportunity for buyers to re-enter with strength. The expected target is $125,000 , aligning with the middle of the channel and the previous resistance level.
As long as the price remains above the support zone and the ascending trendline, the bullish scenario remains valid. However, if the price breaks below this level, it could invalidate the current setup and increase the likelihood of a deeper correction.
Always ensure you confirm your setups and trade with proper risk management.
Good luck!

GOLD – top is in?There are many possible Elliott Wave interpretations regarding the recent years in gold, but one thing seems quite clear. The rise that began in August 2025 was preceded by a triangle, which according to wave theory always signals the final wave of an impulse of the same degree. After it concludes, one should expect a correction of the entire impulsive five-wave sequence, typically retracing to the level of the preceding fourth wave.
In recent days, the media have been filled with images of people buying physical gold — and as we know, the crowd is never right. Could this widespread euphoria be signaling the end of the bull run, at least for a while? Many signs point to that. It is not unlikely that we will soon see capital rotation into crypto.

$GOLD Rally Pause – Will the Golden Fib Hold?TVC:GOLD has seen a strong rally after months of accumulation, but the recent sharp pullback looks like a healthy correction rather than a trend reversal.
Currently, price is approaching the Golden Fib Zone (0.5–0.618), an area that often acts as a strong support during ongoing uptrends. If the price manages to hold this zone and form a solid base, we could see the next leg higher, potentially leading to new highs.
For now, the focus remains on how price reacts at this Fib zone, a bounce here could confirm continuation, while a breakdown below may signal a deeper correction.
DYOR, NFA
THANKS FOR THE READING

ETH Consolidating Before the Next Move$ETH/USDT has been trading sideways for the past 74 days, holding strong at the confluence of the rising trendline and key support zone. This prolonged consolidation suggests that both buyers and sellers are in a state of equilibrium, waiting for a decisive move.
A breakout on either side could set the tone for the next major trend. If ETH manages to hold this support and gain momentum, we might see a strong recovery toward the upper resistance levels.
However, if it loses this zone, a deeper correction could follow before any significant upside move.
DYOR, NFA
PEACE
