BTC : Short Trade setup from Ascending ChannelBitcoin is trading inside an ascending channel and has just tapped into a supply zone, making this a clean scenario for a short‑term counter‑trend short back toward prior support. The idea is to fade the move inside the supply, then ride price down to the support level where buyers previously stepped in.
Price has been respecting an ascending channel. Current location is at the upper band plus an overlapping supply zone, which often acts as a magnet for profit‑taking and short entries.
After a strong impulsive leg up, price is overextended into supply on the 15m chart, with RSI elevated and showing potential for momentum fade rather than fresh trend acceleration.
Take Profit:
TP1: Mid‑channel near 90,000–90,200 to secure partial profits.
TP2: Support zone around 89,200–89,300, where the last strong breakout originated.
Stop Loss: Conservative: Just above the supply zone and recent high, around 92,300–92,500.
1-BTCUSD

BTC Trade Secured 1500 PipsSet up played out perfectly sweeping SSL followed by 15m engulfing and CISD to target BSL

BTCUSD downtrend continuation resistance at 98,240The BTCUSD currency pair continues to display a bearish outlook, in line with the prevailing downward trend. Recent price action suggests a corrective pullback, potentially setting up for another move lower if resistance holds.
Key Level: 98,240
This zone, previously a consolidation area, now acts as a significant resistance level.
Bearish Scenario (rejection at 98,240):
A failed test and rejection at 98,240 would likely resume the bearish momentum.
Downside targets include:
87,066 – Initial support
84,880 – Intermediate support
82,220 – Longer-term support level
Bullish Scenario (breakout above 88,530):
A confirmed breakout and daily close above 98,240 would invalidate the bearish setup.
In that case, potential upside resistance levels are:
100,127 – First resistance
102,450 – Further upside target
Conclusion
BTCUSD remains under bearish pressure, with the 98,240 level acting as a key inflection point. As long as price remains below this level, the bias favours further downside. Traders should watch for price confirmation around that level to assess the next move.
This communication is for informational purposes only and should not be viewed as any form of recommendation as to a particular course of action or as investment advice. It is not intended as an offer or solicitation for the purchase or sale of any financial instrument or as an official confirmation of any transaction. Opinions, estimates and assumptions expressed herein are made as of the date of this communication and are subject to change without notice. This communication has been prepared based upon information, including market prices, data and other information, believed to be reliable; however, Trade Nation does not warrant its completeness or accuracy. All market prices and market data contained in or attached to this communication are indicative and subject to change without notice.

BTCUSD - Daily Bearish View200MA can be seen on this daily timeframe to be a consistent point of support for this bullrun
This level has since been broken, suggesting bear movement coming on this timeframe.
Up arrows show the support along 200MA.

Global Long Imbalance — Structural UpdateYesterday I posted an idea describing a rare long-side imbalance detected by Long Zigg , where the 10% depth reached its maximum value of 100 several times over the past days.
This update focuses on what changed since then and how the current structure looks on the hourly chart.
Recent observations
On the chart I’ve marked all recent moments where Long Zigg = 100 .
Despite the continued price decline, the structural picture remains the same:
– The 10% depth is printing 100 again
– Limit order structure is still tilted toward buyers
– Price continues to move lower while the imbalance remains extreme
In other words, the market is showing a combination of falling price and a maximum long imbalance.
What this may indicate
Such setups often appear during periods of spot accumulation, where passive buyers continue absorbing sell pressure despite short-term declines.
This does not imply an immediate reversal, but for now the structure resembles accumulation, not panic distribution.

USDJPY: bullish potential 🛠 Technical Analysis: On the 4-hour timeframe, USDJPY remains in a strong uptrend, moving within an ascending channel and respecting a key ascending trendline. The "Global bullish signal" (Golden Cross) is in effect, with the price currently pulling back into a bull flag pattern, finding support at the 155.380 level and the 50 SMA. The projected setup anticipates a bullish bounce from this strong confluence of support, leading to a breakout from the consolidation pattern to re-test the upper channel resistance.
🌍 Fundamental Analysis: The Yen is finding short-term support from today's firm Tokyo CPI data (2.7% YoY), which is fueling speculation that the Bank of Japan may hike interest rates again as soon as December. This fundamental pressure is causing the current pullback, while the US Dollar is experiencing very thin liquidity following the Thanksgiving holiday. Traders are now watching to see if the dominant, long-term technical uptrend can absorb this news and resume its upward path.
❗️ Trade Parameters (BUY) ❗️
➡️ Entry Point: Buy on breakout of the local resistance (approx. 156.476)
🎯 Take Profit: 159.593
🔴 Stop Loss: 155.242
⚠️ Disclaimer: This is a potential trade idea based on current analysis; market conditions and price direction are subject to change based on news factors and volatility.

EURUSD: descending channel🛠 Technical Analysis: On the 4-hour timeframe, EURUSD is clearly moving within a descending channel, with price currently testing a major confluence of resistance. This resistance cluster is formed by the channel's upper trendline, the 100 and 200 SMAs, and a horizontal static zone around 1.1607. The "Global bearish signal" (Death Cross) identified earlier remains valid, reinforcing the downtrend. The projected trade anticipates a rejection from this heavy resistance, pushing the price back down toward the lower support zones, with an ultimate target near the channel's bottom at 1.1380.
🌍 Fundamental Analysis: Market liquidity is thin today in the wake of the US Thanksgiving holiday, which can lead to unpredictable or muted price action. Focus is shifting to next week's high-impact data, including Eurozone 'Flash' Inflation (Dec 2) and the crucial US Non-Farm Payrolls report (Dec 7). These releases will be vital in shaping the market's expectations for future ECB and Federal Reserve interest rate decisions, directly impacting the EURUSD exchange rate.
❗️ Trade Parameters (SELL) ❗️
➡️ Entry Point: Sell on rejection from the resistance zone (approx. 1.1600 – 1.1630)
🎯 Take Profit: 1.1468, medium-term target at 1.1380
🔴 Stop Loss: Above the resistance structure (approx. 1.1671)
⚠️ Disclaimer: This is a potential trade idea based on current analysis; market conditions and price direction are subject to change based on news factors and volatility.

Double Top: The Pattern That Warns You Before the Crash📘 Mastering the Double Top Pattern: A Complete Educational Guide for Traders
The Double Top is one of the most powerful and reliable reversal patterns in technical analysis. When understood and applied correctly, it helps traders catch the early phase of a trend reversal — often leading to high-reward opportunities with strong risk control.
1 . Understanding the Structure of a Double Top
A Double Top consists of three essential components:
🔸 First Top
- Price pushes upward in a strong bullish trend.
- It forms a peak at a key resistance zone.
- Price then retraces downward → creating the neckline.
🔸 Second Top
Price rises again but fails to break above the first peak.
This failure indicates:
+ weakening bullish momentum
+ growing selling pressure
This is the first warning of a potential reversal.
🔸 Neckline Breakout (Confirmation)
- When price breaks below the neckline, the pattern is confirmed.
- This confirms that buyers have lost control and sellers have taken over.
- This is where professional traders begin to look for short opportunities.
2. What the Double Top Really Tells You (Market Psychology)
A Double Top is psychology in motion:
- Buyers attempt to break resistance twice
- The first attempt succeeds (forming Top 1)
- The second attempt fails (forming Top 2)
- This failure shows exhaustion
- Once the neckline breaks → confidence shifts to sellers
- A new downtrend is likely to start
This pattern is especially powerful after a strong uptrend, because a reversal has more room to move.
3. Requirements for a High-Quality Double Top
To filter out fake signals, look for:
✔️ A strong bullish trend before the pattern
✔️ Two tops of similar height
✔️ Second top usually forms with weaker volume
✔️ Clear and decisive neckline breakout
✔️ Retest of the neckline increases probability
This helps you avoid low-quality setups and false reversals.
4. How Professional Traders Trade the Double Top
1️⃣ Entry Strategy
- The safest and highest-probability entry: SELL on the neckline retest after the breakout.
Entering early (at the second top) is risky — no confirmation yet.
2️⃣ Stop Loss Placement
SL should be:
- above the second top or above the structure that failed
- This protects you from false breakouts and liquidity grabs.
3️⃣ Take Profit Strategy
To project your target:
- Measure the height from the top → neckline
- Project the same distance downward
- This becomes your TP zone
Simple, clear, and effective.
5. Pro Tips to Avoid Traps
⚠️ DO NOT enter just because price forms a second top
⚠️ Wait for the neckline break
⚠️ Watch for decisive bearish candles
⚠️ Combine with:
- RSI divergence
- Trendline breaks
- FVG imbalance
- Liquidity sweeps
These confluences dramatically increase your win rate.
🧠 Final Thoughts
The Double Top is a classic pattern for a reason — it reveals clear market psychology and provides precise entries when used correctly. Mastering it allows you to catch early reversals with confidence and discipline.
If this lesson helped you, let me know in the comments 🚀📉📘

JAPAN STOCK (NIKKEI225) vs Bitcoin CYCLYE CHART ! JAPAN STOCK (NIKKEI 225) vs Bitcoin CYCLE CHART !
1950-2025 NIKKEI vs 2010-2025 BTC
FRACTAL ( 5 cycles)

BTC Price Watching Key Barrier and Rising SupportThe chart highlights a rising support line guiding recent movement, while a horizontal zone near the top acts as a key barrier.
If price continues respecting the upward structure, momentum may build once this upper level is cleared with strength.

BTCUSD: A fragile rebound, with risk of returning to the 84,000 After a fairly “tiring” week , Bitcoin has ticked up slightly at the start of the week, but the overall picture still leans clearly toward the bears . Outflows from U.S. spot Bitcoin ETFs have now extended into the fourth consecutive week , showing that institutional money is still cutting exposure. At the same time, the market is both hoping for a Fed rate cut in December (around 70% probability) and worrying because many Fed officials remain cautious. With no new bullish catalyst , the crypto market in general – and BTC in particular – remains under short-term downside pressure.
On the D1 timeframe, BTCUSD is holding a clear downtrend below the Ichimoku cloud . A descending trendline drawn from the previous highs continues to cap every rebound. Price is currently trading around 87,000 USD, after dropping to a recent low near 83,500 USD and then bouncing slightly. The scenario illustrated on the chart suggests BTC may range and consolidate before pushing up to retest the 96,700 USD area – a key confluence resistance where the descending trendline meets a horizontal supply zone.
If BTC reaches the 96,700 USD region but faces strong selling, the primary scenario is a new leg down back toward the 84,000 USD support zone. With ETF flows still negative and the Fed’s outlook still uncertain, every bounce into higher resistance levels currently looks more like a distribution opportunity than the start of a sustainable uptrend .

Bitcoin Analysis October 2025Bitcoin faced correction after last flash crash where bitcoin had 10% pullback, and it now has nice rally to the upside. Fixed volume range showed accumulation of buying orders. I expect price to push to the previous high on the left.

Bitcoin prediction Nov 2025Bitcoin prediction Nov 2025, Bitcoin is expected to push to the upside after it broke previous high and came to test previous low and bullish order block and start to move toward previous high (Bullish Extension). This move may break previous all-time high and break record of 2025 All-time high.

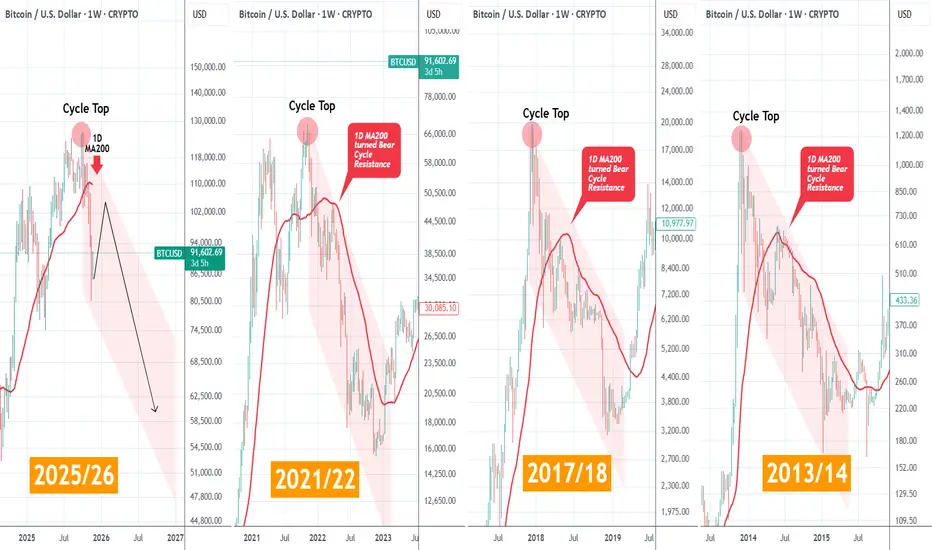
BITCOIN ! HAPPY THANKSGIVING ! Does the 1D MA200 spoil the mood?First of all allow me to wish everyone Happy Thanksgiving with all the blessings this day may bring to your family and loved ones.
As for Bitcoin (BTCUSD), the anticipated short-term rebound is targeting the first Lower High of the emerging Bear Cycle. What's critical in this? The 1D MA200 (red trend-line) and the reason is simple.
As the previous three Cycles show on this graph, when BTC starts a Bear Cycle and breaks below its 1D MA200, it then turns into the Resistance for the rest of the Cycle. And as you can see, it rejected every single time the Lower Highs. Practically that is the most optimal level for someone to short for as long as the Bear Cycle lasts.
As a result, we expect the current counter-trend rally/ dead-cat bounce (call it as you want), to be limited by the 1D MA200, which is currently at $110k and falling, then get rejected and start the next Bearish Leg of the Channel Down.
So do you think the 1D MA200 will play the role of the long-term Resistance from now on? Feel free to let us know in the comments section below!
---
** Please LIKE 👍, FOLLOW ✅, SHARE 🙌 and COMMENT ✍ if you enjoy this idea! Also share your ideas and charts in the comments section below! This is best way to keep it relevant, support us, keep the content here free and allow the idea to reach as many people as possible. **
---
💸💸💸💸💸💸
👇 👇 👇 👇 👇 👇
BTC/USD levels to watchBitcoin continues to recover from its big falls and it has broken a few important short-term levels, although too early to say whether it had bottomed out. After all, the bearish trend line is still intact.
$91.6K marks last support pre breakdown and top of rising channel - we have seen a bit of reaction from this level already.
$95.0K another important level on the upside
Support at 89.2K and then 87.9K
if we go below recent low of 86266, bias would turn bearish again.
By Fawad Razaqzada, market analyst with FOREX.com

BTCUSD - bullish on Weekly TFAfter a long pullback on the weekly TF, now we can inspect price to high

BTCUSD | short ideaLooking for bitcoin to get into this zone and make a move downwards. I don't think this downtrend is over just yet.
Let me know what you think!
Stay safe out there and do your own due diligence, this is not investment advise!

BTC 4H – Fib Rejection, But Is Another Leg Down Next?BTC is pressing into a heavy confluence area: the macro downtrend line, the 50/100 EMAs, and the 0.5–0.786 Fib retracement zone. Price reacted cleanly from local supply and failed to close above the cluster of moving averages, keeping the 4H structure bearish.
The Stoch RSI is fully overbought and curling down, signaling weakening bullish momentum on approach into resistance. Unless BTC can reclaim the trendline with a strong impulsive close, this area favors a lower-high formation and continuation toward downside targets.
A confirmed rejection here opens a move back toward prior demand zones, while a break above the 0.618 would shift momentum toward deeper Fib targets and potentially challenge the trendline from above.
Key levels:
• Resistance: 93,826 / 97,010 / 101,543
• Support: Prior local demand under 90K
• Structure shift only if trendline breaks with volume

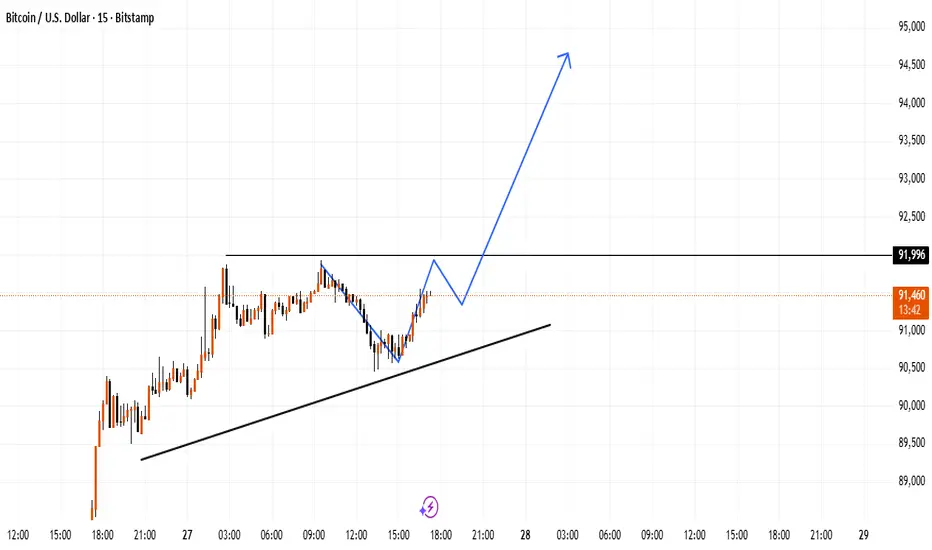
BTCUSDT (bitcoin) toward $91k?Hi!
BTC has finally broken its major descending trendline, signaling a shift in market sentiment after a long period of selling pressure. Following that break, price formed a clear inverse head and shoulders pattern, showing that buyers stepped in aggressively after the final liquidity sweep at the Head. Since then, BTC has been moving inside a well-defined ascending channel, consistently printing higher highs and higher lows, which confirms bullish momentum.
As long as price respects the lower boundary of this channel, the upside structure remains intact. The next significant resistance sits at 92,500–93,000, which also aligns with the previous breakdown zone you highlighted. This area is likely to attract sellers, making it a logical target for the current move.
Overall, the chart supports continued upside toward 93K, unless price breaks below channel support, which would weaken the bullish reversal setup.

BTCUSD H4 | Potential Bullish ReversalMomentum: bearish
The price is falling towards the buy entry which acts as an overlap support.
Buy entry: 89,034.03
Overlap support
Stop loss: 81,966.16
Pullback support
Take profit: 104,866.08
Overlap resistance
Slightly above the 61.8% Fibonacci retracement
High Risk Investment Warning
Stratos Markets Limited (tradu.com ), Stratos Europe Ltd (tradu.com ):
CFDs are complex instruments and come with a high risk of losing money rapidly due to leverage. 70% of retail investor accounts lose money when trading CFDs with this provider. You should consider whether you understand how CFDs work and whether you can afford to take the high risk of losing your money.
Stratos Global LLC (tradu.com ): Losses can exceed deposits.
Please be advised that the information presented on TradingView is provided to Tradu (‘Company’, ‘we’) by a third-party provider (‘TFA Global Pte Ltd’). Please be reminded that you are solely responsible for the trading decisions on your account. Any information and/or content is intended entirely for research, educational and informational purposes only and does not constitute investment or consultation advice or investment strategy. The information is not tailored to the investment needs of any specific person and therefore does not involve a consideration of any of the investment objectives, financial situation or needs of any viewer that may receive it. Past performance is not a reliable indicator of future results. Actual results may differ materially from those anticipated in forward-looking or past performance statements. We assume no liability as to the accuracy or completeness of any of the information and/or content provided herein and the Company cannot be held responsible for any omission, mistake nor for any loss or damage including without limitation to any loss of profit which may arise from reliance on any information supplied by TFA Global Pte Ltd.

GBPAUD consolidating.GBPAUD taking a BUY position with confirmation from the bounce off SUPPORT and Price Action. It should keep rising going to NY session.

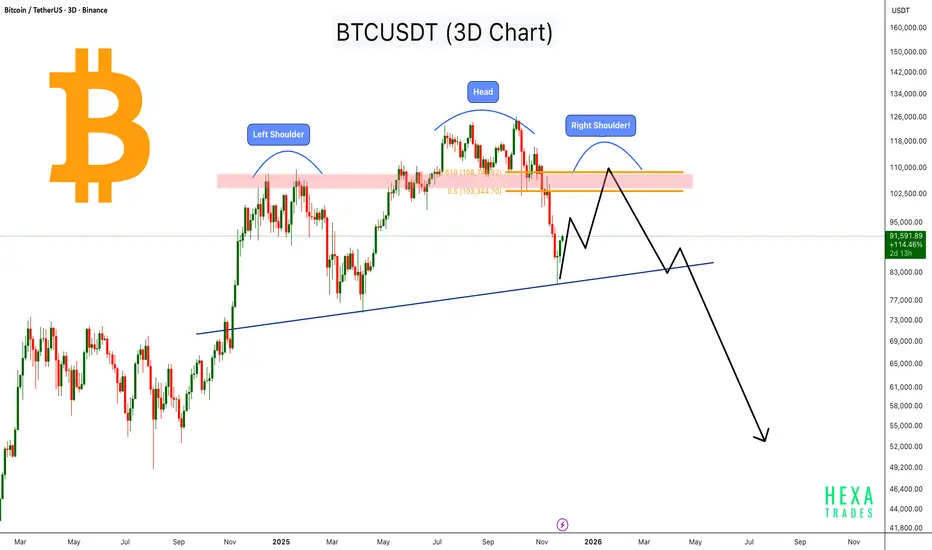
BTC Forming a Massive Head & Shoulders - Macro Reversal Ahead?Bitcoin is forming a large Head & Shoulders pattern on the 3-day chart, with the left shoulder and head already completed, and the right shoulder now developing within the major resistance zone around the 0.5–0.618 retracement (103,000–108,000).
Price recently bounced from the long-term ascending trendline, but the overall structure still suggests a potential macro reversal unless Bitcoin breaks above the resistance zone with strong momentum.
If the right shoulder completes and price rejects from the supply zone, BTC could retest the trendline again. A breakdown of this trendline may open the door for a deeper correction toward the lower demand zones.
This is a medium-term pattern and may take 1–3 months to validate fully.
Key Points:
- Left Shoulder, Head, and Right Shoulder zone highlighted
- Major resistance at $103,000–$108,000
- Price bouncing from long-term ascending trendline
- Breakdown below the trendline may trigger a strong downside move
- Right shoulder formation may take a few more weeks
Cheers
Hexa