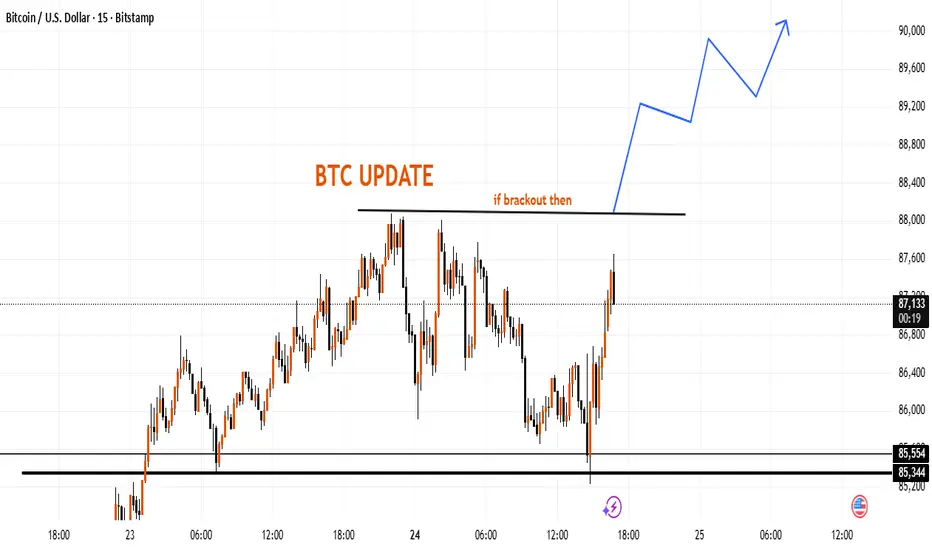
BTC – Key Level Watch and Structural OutlookThis chart highlights an important resistance zone around the 88,000 area. If price manages to move firmly above this level, the market may continue forming a higher-timeframe structure toward the 89,000–90,000 region.
The lower zone near 85,300–85,550 remains a notable support area where previous reactions occurred.
This outline is based purely on market structure and potential price behavior, not a trading instruction.
1-BTCUSD
Bitcoin Market Truth: Whales, Corrections, and the BraveHello my friends,
I have carefully analyzed Bitcoin for you.
Markets never move straight up; they progress with corrections. Whales often take profit along the way. Think of it like running a supermarket: you buy apples at the cheapest price so that when customers purchase from you, you make a profit. Whales use the same logic. They trick people into thinking prices are falling, but in reality, their goal is to balance supply and demand. They feed on the losses of others.
For me, the most suitable buying zone is between 85,000 and 74,000 dollars. From this range I will enter the trade, with my first target at 107,000 and my second target at 120,000 dollars.
This business belongs to the fearless and the brave. If you act out of fear of losing money, this is not for you. Those who cannot manage risk should look for other paths.
My dear friends, every single like you give is my greatest motivation to continue sharing these analyses. Thank you to all who support me—you are the reason I keep going.
Each of my followers is like family to me, never forget that.
⚠️ And remember this: In trading, don’t trust everyone who calls themselves a “trader.” Most of the people you follow don’t earn a cent in their real accounts. This is not an easy business. Around 90% of people lose consistently, while only about 10% make money regularly. Many YouTubers or influencers you see online don’t actually profit with their real money. In fact, some of the celebrities you follow come to me asking for analysis. I won’t expose names, but these are the facts.
Respect and love

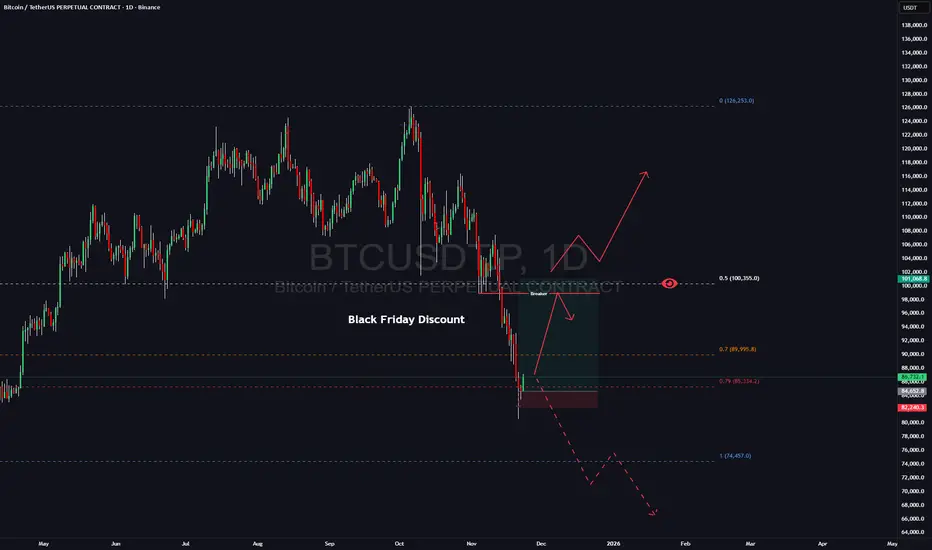
BTC Is Preparing Monster Move: My Bullish Roadmap to New High!A lot of people are already calling for the end of the BTC rally and welcoming a new bear market. Whether that’s true or not — the chart will show. I approach the market with a neutral mindset and let price action speak for itself.Plus dont forget we have Black Friday coming and probably crypto market decided to give you a nice discount)
From my perspective, Bitcoin has simply tapped the weekly discount zone. Historically, BTC often delivers a 20–30% corrective move, which is completely normal within a bullish cycle. And with Black Friday approaching, it seems the crypto market decided to offer its own “discount.”
I’ve taken a long position from this area, with my first target set at 94–96K, where I plan to secure the majority of my profits.
My stop is positioned around 82K — if the market goes against me, I’m fully comfortable with the risk.
I’ve also added some spot positions and will share detailed analysis on those in upcoming posts.
Once we reach the 94–96K zone, I’ll reassess the market. Price can shift in either direction from there, which is why that area is my main profit-taking zone while letting the remainder of the position run.
Follow me for further updates and trade breakdowns.
XAUUSD: triangle compression🛠 Technical Analysis: On the 4-hour timeframe, Gold (XAUUSD) is consolidating within a massive symmetrical triangle, indicating a period of indecision and building volatility. The price action is currently compressing near the lower support trendline of the formation. The Moving Averages (SMA 50, 100, 200) are converging, further confirming the squeeze. The projected trade setup anticipates a bearish breakout below the triangle's support. A confirmed close below the trendline opens the path for a decline toward the immediate support zone at 3,893, with a medium-term target potentially reaching the 3,700 level marked on the chart.
🌍 Fundamental Analysis: The precious metal is under pressure as the market anticipates key US economic data due later this week. Investors are closely monitoring the upcoming US GDP (Preliminary) and Core PCE Index figures. Stronger-than-expected data could reinforce the Federal Reserve's hawkish stance (or delay rate cuts), boosting the US Dollar and yields, which traditionally weighs on non-yielding assets like Gold. Additionally, liquidity may thin out approaching the US Thanksgiving holiday, potentially leading to sharper, erratic moves upon any breakout.
📉 Trade Parameters (SELL):
Entry Point : Sell on the confirmed breakdown of the triangle support (approx. 4,060 – 4,070).
Take Profit: 3,893, medium-term target at 3,700
Stop Loss: Above the immediate structure or SMA cluster (approx. 4,150).
⚠️ Disclaimer: This is a hypothetical trade idea based on current analysis; market conditions and price direction are subject to change based on news factors and volatility.

Bearish momentum to continue?Bitcoin (BTC/USD) is reacting off the pivot which is a pullback resistance and could reverse to the 1st support.
Pivot: 89,178.40
1st Support: 81,214.21
1st Resistance: 93,070.41
Disclaimer:
The opinions given above constitute general market commentary and do not constitute the opinion or advice of IC Markets or any form of personal or investment advice.
Any opinions, news, research, analyses, prices, other information, or links to third-party sites contained on this website are provided on an "as-is" basis, are intended to be informative only, and are not advice, a recommendation, research, a record of our trading prices, an offer of, or solicitation for, a transaction in any financial instrument and thus should not be treated as such. The information provided does not involve any specific investment objectives, financial situation, or needs of any specific person who may receive it. Please be aware that past performance is not a reliable indicator of future performance and/or results. Past performance or forward-looking scenarios based upon the reasonable beliefs of the third-party provider are not a guarantee of future performance. Actual results may differ materially from those anticipated in forward-looking or past performance statements. IC Markets makes no representation or warranty and assumes no liability as to the accuracy or completeness of the information provided, nor any loss arising from any investment based on a recommendation, forecast, or any information supplied by any third party.

Bitcoin Price Approaches Key Support: Rebound Toward 98,700?BITSTAMP:BTCUSD is approaching a key support zone, an area where buyers have repeatedly stepped in before and triggered notable reversals. That price history alone makes this level worth watching very closely. Price is pressing into this zone again, and the current structure suggests bullish potential if we see clear signs of rejection, such as a strong bullish engulfing candle, long lower wicks that show absorption of selling, or a visible increase in buying volume.
If this support holds, I expect price to push up toward the 98,700 area, which fits well with a short-term rebound scenario. If, on the other hand, price breaks below this zone and starts to hold underneath it, the bullish idea is invalidated and the door opens for a deeper downside move.
In my view, the best approach here is to let the chart confirm the story at this level. Watch how candles close, how volume reacts, and only consider long setups if the market clearly defends this zone. Solid risk management is essential: position size, stop loss placement and invalidation levels all need to respect the potential volatility around such an important area.
This is simply my personal view on the current support and resistance structure, not financial advice. Always confirm your own setup and trade with disciplined risk management. Good luck out there.

BITCOIN FREE SIGNAL|SHORT|
✅BTCUSD tapped supply and left a clean VFG inefficiency above the rejection wick. A return into that VFG for refinement offers optimal entry, aligning with bearish order-flow toward sell-side liquidity below.
—————————
Entry: 88,900$
Stop Loss: 90,154$
Take Profit: 87,164$
Time Frame: 2H
—————————
SHORT🔥
✅Like and subscribe to never miss a new idea!✅

TOTAL Market Cap at key support, 100 EMA + Sto/RSI = BULLISH!The Total Market Cap is holding key trendline support going back many years, including the
Covid crash. Price is also holding at the 100 Week EMA and the stochastics RSI is turning up, which has been a good predictor of price on the weekly time frame.
So I would expect some kind of a bounce here especially now that the FED watch tool is showing we're back to an 85% chance of a further rate cut in December.
However the markets are very fragile and certainly can see another deeper drop come in December possibly forcing the FED to do a additional rate cut in January.
All of this leads toward possible QE and liquidity injection into the economy which would get these markets moving again.
I can see us hitting you highs in 2026 probably kicking off around May where Jerome Powell is replaced when his term is up with a more friendly fed chairman.
And then starting the money printers back up again.
For now, at least the markets aren't bleeding and haven't broken this key Market structure.
We will know soon enough.

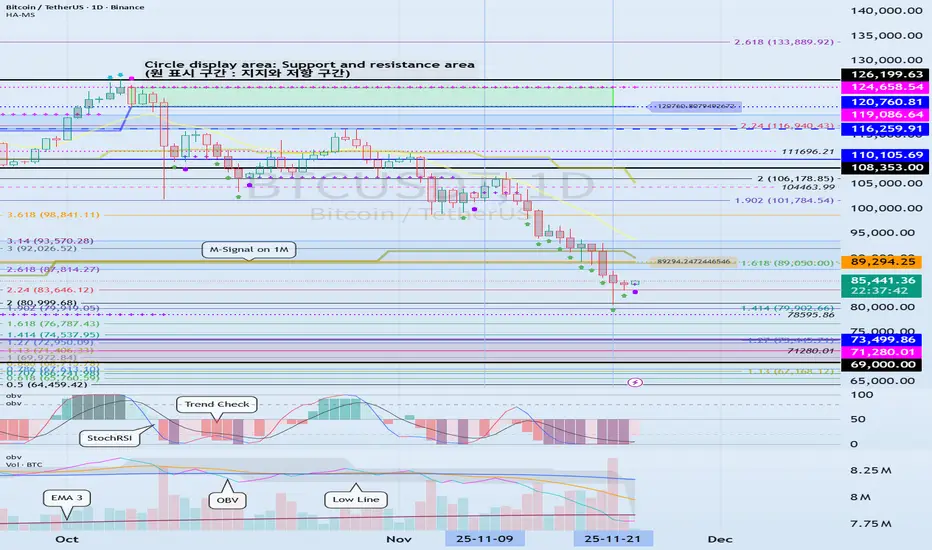
Weekly and Monthly Forecast
Hello, fellow traders!
Follow us to get the latest information quickly.
Have a great day!
-------------------------------------
(BTCUSDT 1D chart)
The volatility period has ended.
The key is whether it can rise above 89294.25.
If not, we need to check for support near 69000-73499.86.
(1W chart)
The following are important areas as the price falls below the third range:
- 116259.91-119086.64
- 87814.27-93570.28
- 69000-73499.86
A decline below the 69000-73499.86 range can be considered a long-term downtrend, so this is a very important area for now.
Therefore, as the price approaches the 69000-73499.86 range, we need to check for increased trading volume or the emergence of a new HA-Low indicator on the 1W chart.
If the HA-Low indicator is formed, it's important to determine whether there's support near it.
The basic trading strategy is to buy in the DOM(-60) ~ HA-Low range and sell in the HA-High ~ DOM(60) range.
If the price rises near the HA-Low indicator and moves toward the HA-High indicator, the wave should be considered closed (reset).
Conversely, if the price falls near the HA-High indicator and moves toward the HA-Low indicator, the wave should also be considered closed (reset).
A closed (reset) wave means that the trend has been reestablished.
Therefore, as mentioned earlier, the basic trading strategy is created.
However, if the price rises in the HA-High ~ DOM(60) range, a stepwise uptrend is likely, while if the price falls in the DOM(-60) ~ HA-Low range, a stepwise downtrend is likely.
The end of a stepwise uptrend is a decline, and the end of a stepwise downtrend is a rise.
Therefore, a decline after encountering the HA-Low indicator is different from a decline after encountering the HA-High indicator.
Therefore, a stepwise downtrend indicates a period of truncation buying, while a stepwise uptrend indicates a period of truncation selling.
During a stepwise downtrend, even if the price declines, there's an expectation that a price increase will occur soon, so you can increase the number of coins (tokens) representing profit.
This method involves trading at each purchase price and selling the same amount of coins (tokens) when the price rises, thereby increasing the number of coins (tokens) representing profit.
The coins (tokens) representing profit are those with a purchase price of 0, which can lead to significant profits later.
-
A bullish trend can be considered when the price rises above the M-Signal indicator on the 1M chart and holds.
However, the point where you should actually buy is when the price rises above 108353.0.
Based on the current trend, the next volatility period is expected around December 23rd.
Therefore, you should check to see if the price holds above 89294.25 during the next volatility period.
Therefore, it appears likely that the price will move sideways to reverse the trend.
Based on the price movement, the start of a major bear market is expected to begin after the first quarter of next year.
However, if the price falls below 69000-73499.86, you should consider this a bear market and consider a response plan.
-
Thank you for reading to the end.
I wish you successful trading.
--------------------------------------------------
- Here's an explanation of the big picture.
(3-year bull market, 1-year bear market pattern)
I'll explain more in detail when the bear market begins.
------------------------------------------------------
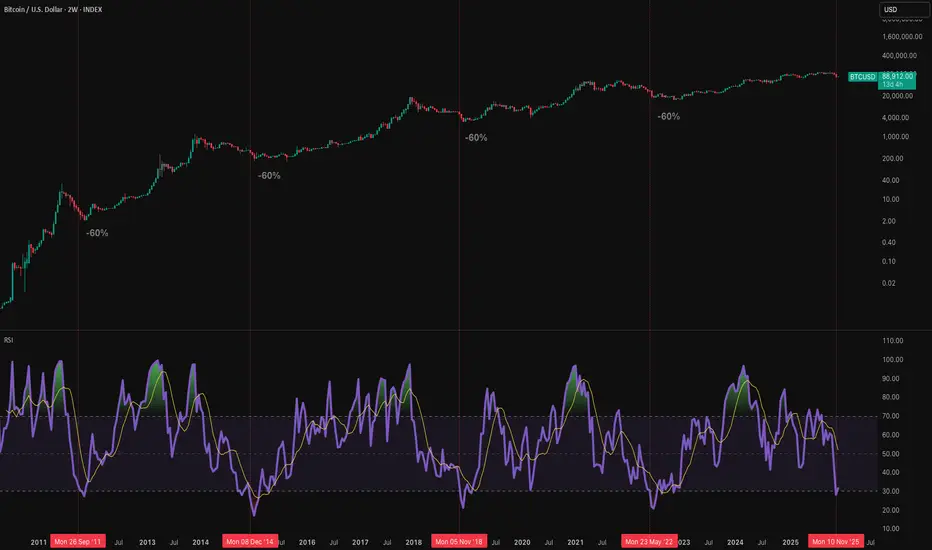
Bitcoin 2 Week RSIBitcoinUSD 2 Week stock RSI (14 period close)
The current level has been associated with 50-60% corrections in all of the past cycles
Bitcoin doesn't repeat patterns forever, just until enough people have noticed them
If this pattern does continue, a rapid and large correction could be imminent
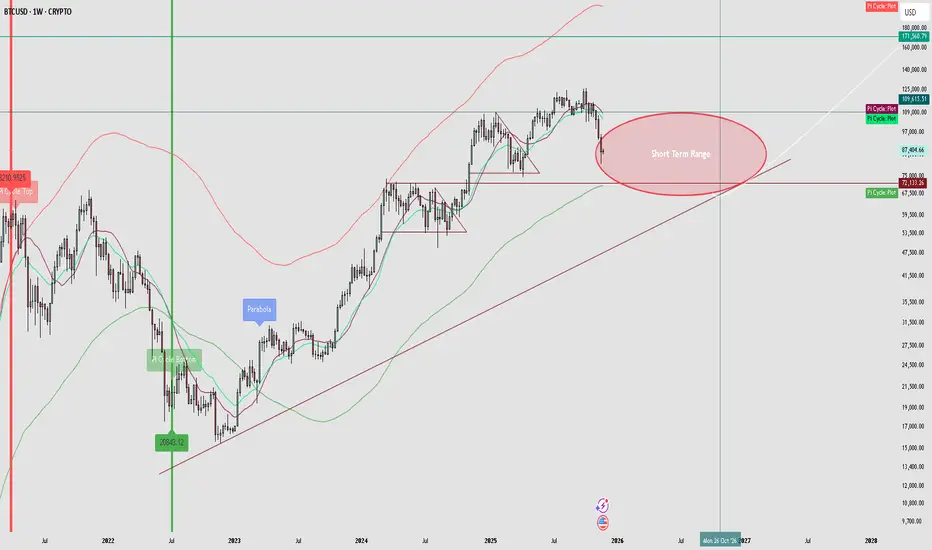
BITCOIN The Bear Cycle's High Volatility period has just begun..Bitcoin (BTCUSD) closed last week brutally below its 2W MA20 (red trend-line) and has started this week off with the first signs of a potential rebound. We explained on previous analyses the dynamics of the 1W MA50 bearish closing as well as the rebound potential on the 1W MA100 but today are looking at what this 2W MA20 bearish closing means.
First of all, observe for a moment the remarkable symmetry between the 2W MA20 bearish closings across all Bear Cycles. The date range between the March 31 2014 and March 26 2018 2W MA20 closings was 104 candles (1456 days), March 26 2018 and December 06 2021 was 97 candles (1351 days) and December 06 2021 and today's November 10 2025 was again 103 candles (1435 days).
As you can see on two of those three occasions, BTC initially rebounded above the 2W MA20 again but then got rejected back below and consolidated while turning the 2W MA20 into its main Resistance for the rest of the Bear Cycle. In 2022 it just fell below it and consolidated for 4 months before getting violently rejected to new Lows.
As a result, given also the amazing symmetry of the 2W RSI sequence among those fractals, we still expect the market to potentially deliver the first counter-trend rally (limited) of the Bear Cycle, namely 'Santa's Rally' but then get strongly rejected below the 2W MA20 again.
We call this the start of the 'Bear Cycle's High Volatility Period' and needless to say, it is the phase where due to the aggressive ups and downs in range, most traders/ investors can potentially get trapped. Following Bitcoin's 4-year Cycle Theory (and our 2020 Golden ratio) has historically never let us down and until invalidated will continue to be the way to go for us.
So do you think BTC is entering a brutal High Volatility period? Feel free to let us know in the comments section below!
P.S. For reference take a look at our legendary 2020 Golden 51%-49% Ratio, viewed 400k times on TradingView and its 2024 update to see how well macro Cycles work at timing (entries and exits on) the market:
---
** Please LIKE 👍, FOLLOW ✅, SHARE 🙌 and COMMENT ✍ if you enjoy this idea! Also share your ideas and charts in the comments section below! This is best way to keep it relevant, support us, keep the content here free and allow the idea to reach as many people as possible. **
---
💸💸💸💸💸💸
👇 👇 👇 👇 👇 👇

Bitcoin - The only 100% probability setup!🔪Bitcoin ( CRYPTO:BTCUSD ) will drop -40% very soon:
🔎Analysis summary:
If we just take a look at previous cycles, Bitcoin is already starting a major -40% correction. If we then also take market structure and price action into account, this becomes a 100% probability setup. The next clear crypto bearmarket is starting right now.
📝Levels to watch:
$100,000
SwingTraderPhil
SwingTrading.Simplified. | Investing.Simplified. | #LONGTERMVISION

Weekly crypto review: BTC macro + short-term bearish lookBitcoin Bitcoin is closing its second consecutive week below the 50-week moving average. Throughout this growth cycle (since the 2022 lows), price has always found support at these levels.
Chart:
Historically, closing below this level for more than two weeks in a row has almost always marked the start of a macro-correction cycle or ‘crypto winter,’ rather than just a standard drawdown.
Chart:
On RSI:
The Weekly RSI, which maintained an uptrend throughout 2024 and almost all of 2025, decisively broke its long-term support line in November. As long as RSI remains above the support line, the bullish cycle structure usually holds; however, a downward breakdown often coincides with the completion of a growth phase.
Chart:
The combination of these two signals—dropping below the 50-week average and the RSI support breakdown—sharply increases the probability that the market has already entered a macro-correction phase. In my view, the probability of this scenario is currently over 80%.
On 200W MA
In all past cycles, the final Bitcoin bottom formed specifically around the 200W MA. Currently, this sits near 66k, and by mid-2026, it could rise to the 73–75k range, fitting a scenario of a further 15–20% decline from current levels.
Chart:
Expectations for the week:
I see potential for another correction wave as long as price remains below 93k. In the coming days/week, it is logical to expect a bounce (already in progress) toward this resistance zone; however, without sustained consolidation above it, the risks of another drop toward 75–70k remain high.
Chart:
If the market does test the 75–70k zone, a local bottom may form there, triggering a powerful bearish rally toward the falling 200-day average. This is the ‘dead cat bounce’ scenario with potential upside of around +40%, typically used to regroup positions in the middle of a bearish phase

BITCOIN SIGNAL: BUY NOW!!!!!!!? (trap) Yello Paradisers! Enjoy the video!
And Paradisers! Keep in mind to trade only with a proper professional trading strategy. Wait for confirmations. Play with tactics. This is the only way you can be long-term profitable.
Remember, don’t trade without confirmations. Wait for them before creating a trade. Be disciplined, patient, and emotionally controlled. Only trade the highest probability setups with the greatest risk to reward ratio. This will ensure that you become a long-term profitable professional trader.
Don't be a gambler. Don't try to get rich quick. Make sure that your trading is professionally based on proper strategies and trade tactics.

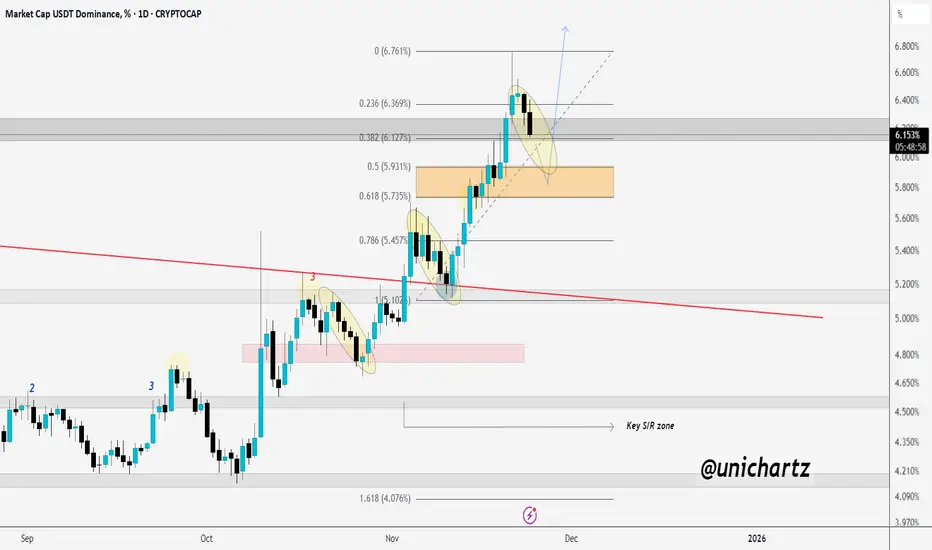
Golden Zone Test: Will USDT.D Extend Higher?USDT.D appears to be retesting the zone after breaking out, and it could push higher since this structure has repeated many times in the past.
The marked golden zone is crucial and will play a key role in determining the next major direction of the market.
DYOR, NFA
The Bear MarketHere’s my current view of the Bitcoin market:
The 4-year cycle still appears intact, and many who doubt it seem to be in the denial phase. While some market dynamics have changed, the overall structure is still on track. Based on prior cycles, I expect a bear-market bottom to form roughly 324–340 days from now. Until then, I plan to avoid leverage and focus on accumulating during deeper pullbacks. I view Bitcoin around $68k as fair value, with prices above that currently leaning toward overvaluation.
I also disagree with the idea that the cycle can’t be over simply because “too many people are calling the top.” As Bitcoin matures and more cycles unfold, more traders naturally recognize recurring patterns. Increased awareness doesn’t invalidate the possibility that the top is already in.
Comparing this cycle to 2021 is also misleading. The previous double-top was heavily influenced by the pandemic, unprecedented Federal Reserve intervention, stimulus payments, and the surge of retail traders stuck at home. Those conditions don’t exist today. This cycle has been driven instead by regulatory clarity, institutional involvement, and growing governmental trust—resulting in a healthier, more sustainable rally.
Despite extreme fear in the market and widespread pessimism, I believe we still have downside ahead due to broader economic fragility. My current expectation is for a market bottom around October 2026, followed by a renewed parabolic move into the next bull market. I don’t expect Bitcoin to reach $1 million by 2030, though it may be possible someday.
ETH Approaching Lower Key Zone If Support FailsCRYPTOCAP:ETH is holding the current support zone after a sharp decline, showing its first signs of slowing down. As long as this zone holds, we could see a short-term bounce or consolidation.
But if this support breaks, price may head toward the lower key zone highlighted on the chart.
For now, this support acts as the main level to watch.
DYOR, NFA

BTC - UPDATE: #BITCOIN - update: Bull retest ongoing - What are the key levels to watch?? 👀
For now, prices follow my previous outlook nicely!
Monthly correction still ongoing; momentum & trend remain bearish 📉 - But Monthly support are around the corner!
Let's keep it simple, here, I see a retest of the previous key support (88k) area with another bearish structure.
🟥If bulls are unable to push above 88.5k then prices will likely fall toward a new low, 79,000 --> 74,000 area! 📉🎯
A weekly candle close under 82,000$ could be a bad event (LL breakout weekly). (Holding for now).
🟩Bull scenario:
A consolidation above 79,000$ - 78,500$ would be very positive and could lead to another ATH if the monthly momentum remain stable! 📈
🟨Technically, We could also see a sideway phase starting inside the 76,000|79,000 - 100,000$ mark (monthly levels).
Currently bulls must push above 88.5k - 90k resistances.
Then --> 93 - 94k retest likely 🎯
Sum up:
Chart remain clearly bearish Under 89k --> Likely 76 - 74k or even 69k - 70k next. I think that's better to not HOPE for bull reaction yet, and wait for clean bull reversal signs.
#DYOR before investing.

BTC Wave 4 Bounce Looks Like a Trap! Is it?BTC is still moving inside a clear corrective channel, with the current bounce likely forming wave 4 before one final drop toward the 1.618 extension near 79,650 . The highlighted red zone shows a potential trap area where price may lure traders into thinking a reversal has started. Until BTC breaks above the channel convincingly, the broader structure still favors a wave 5 decline. The wave count from 1–2–3 supports this final leg down before any major recovery.
Stay Tuned!
@Money_Dictators

BTC Update: The Rollercoaster EditionAttention all chart warriors, candlestick whisperers, and Fibonacci fanatics!
If you're reading this trade plan, congratulations — you've officially entered the realm of market prophecy
🚀 BTC Update: The Rollercoaster Edition 🎢
What’s New?
Bitcoin is chilling around $86K, like that friend who says “I’m fine” after a breakup but keeps posting cryptic stories.
Upper Trendline:
Sitting pretty near $90,774 – that’s the “VIP section” where bulls want to party. Break above it, and we’re talking $97K–$104K dreams.
Lower Trendline (Breakout Zone):
Guarded at $85,500. If BTC slips below this, next stop could be $80K – aka the “budget seats.”
Price Action:
Currently stuck in a descending channel, but RSI is whispering, “Hey, maybe we’re oversold.” MACD is like that friend who says, “I think things are turning around.”
Target:
If BTC breaks the upper trendline, $97K–$104K is the next dance floor. If not… well, let’s just say $80K might be the couch we crash on.
Fun Fact:
Bitcoin’s November mood? Extreme Fear. Basically, the market is acting like someone saw a spider in the bathroom.
Good luck, everyone! And hey, don’t forget to smash that like button and drop your wildest market predictions in the comments! ❤️
Disclaimer: My trading strategy isn’t a signal—it’s more like a workout for my brain. I’m just here flexing my market structure knowledge and sharpening my trading skills while building my trade journal. Think of it as financial gym time—no personal trainers, just candlesticks!

BTC Trade Set Up Nov 24 2025Price has shifted to bullish structure making HH/HL on the 1h and engulfed a 4h bearish candle so i am looking to hold buys up to higher BSL levels to be swept

BTCMissed the fib level 0.618, looks like we are in a continuation of the downtrend. Or a while when sp500 was pushing higher btc was not following. It formed a bearish flag, expect continuation downward. There is quite a bit of liquidity above 88k.

🇺🇦BTC/USDT — Weekly Outlook BTC/USDT — Weekly Outlook
✔️ The week closed with a bearish candle with a lower wick. Buyers are active but lack strength.
🟢 Historical RSI and fear levels — typically reversal or strong bounce zones.
🟢 Open Interest (OI) is at cycle lows, similar to 2022.
🟢 QT officially ends in one week. Market conditions may ease once liquidity stops being drained. Next step — QE.
🟠 Significant ETF outflows, but total inflows in 2025 remain $44.4B.
🟠 Many are waiting for 70–60–50–30k entries. Will the market offer them?
🔴 No sharp bounce so far. Probability of a bullish divergence or reversal pattern increases if we get one more leg down.
🔴 The shortest bear phase in history lasted ~1.5 months — that’s the most optimistic reference.
🔴 Negative cumulative delta: –$1.75B.
🧠 A real trend reversal needs a strong catalyst.
QE is the most anticipated, but not the only option.
Until then — accumulation and further unwinding.
✔️ Тиждень закрився ведмежою свічкою з тінню сзнизу. Покупець бореться, але сил недостатньо
🟢 Історичні рівні RSI та страху. Зазвичай це зони розвороту або сильного відскоку.
🟢 Відкритий інтерес (OI) на мінімумі - на рівнях 2022 року.
🟢 Через тиждень офіційно завершується QT. Ринку стане легше дихати, коли припинять вилучати ліквідність. Наступний крок - QE.
🟠 Великі відтоки з ETF. Але сумарні притоки за 2025 рік — $44.4 млрд.
🟠 Ті, хто не купує зараз, чекають біткоїн по 70–60–50–30k. Чи дадуть?
🔴 Різкого відскоку не було. Зростає ймовірність формування конвергенції або розворотного патерна через ще одне зниження.
🔴 Найкоротша ведмежа фаза в історії тривала 1.5 місяці - це найоптимістичніший орієнтир.
🔴 Від’ємна кумулятивна дельта (-$1.75 млрд)
🧠 Для реального розвороту потрібен потужний інфопривід.
QE - найбільш очікуваний, але не єдиний варіант.
До його появи - аккумуляція та додаткова розмотка.
