BTC Short-Term 15m Chart📉 BTC 15M — Short-Term Analysis
1. Key Levels from the Chart
Support
$90,400–$90,450 – strong, repeatedly tested (orange zone).
$90,178 – lower support (thin red line).
$89,460 – deeper daily support.
Resistance
$90,900–$91,000 – local resistance zone.
$91,214–$91,545 – SMA 72 / SMA 200 (yellow and blue) = strong dynamic resistance.
$91,800–$92,200 – higher structural resistance.
🧠 2. Market Structure
Short-term trend (15m)
Price remains below the SMA 200 and SMA 72 → bearish momentum.
Lower highs and lower lows are visible → bearish structure.
Narrower range: 90,400 – 90,900 → price compression / consolidation.
📊 3. Indicators
MACD – neutral / slightly bearish
Histogram hovers around zero → lack of strong momentum.
Recent downward crossover → downward pressure.
RSI – 48 (neutral)
Not oversold yet, but:
RSI is forming a bearish divergence from previous highs.
RSI often bounces from 50 in a downtrend → confirms bearish pressure.
🔎 4. What's happening now?
The price is retesting the $90,400 zone, a key defensive level for bulls.
The structure indicates:
supply pressure,
buyers exhausting themselves below the 200 SMA,
possible breakout below if 90,400 breaks.
🎯 5. Short-Term Scenarios (15m)
🔻 Bearish Scenario (more likely)
If 90,400 falls:
Target 1: 90,180
Target 2: 89,460
Target 3: 88,960
The structure strongly suggests this because:
Price below the 200 SMA
Weak momentum
No strong rebound from the lows
🔼 Bullish Scenario (only after breaking 90,900)
If the market rebounds from 90,400 and breaks 90,900:
Target 1: 91,200 (SMA 72 + 200)
Target 2: 91,550
Target 3: 91 800
15minchart

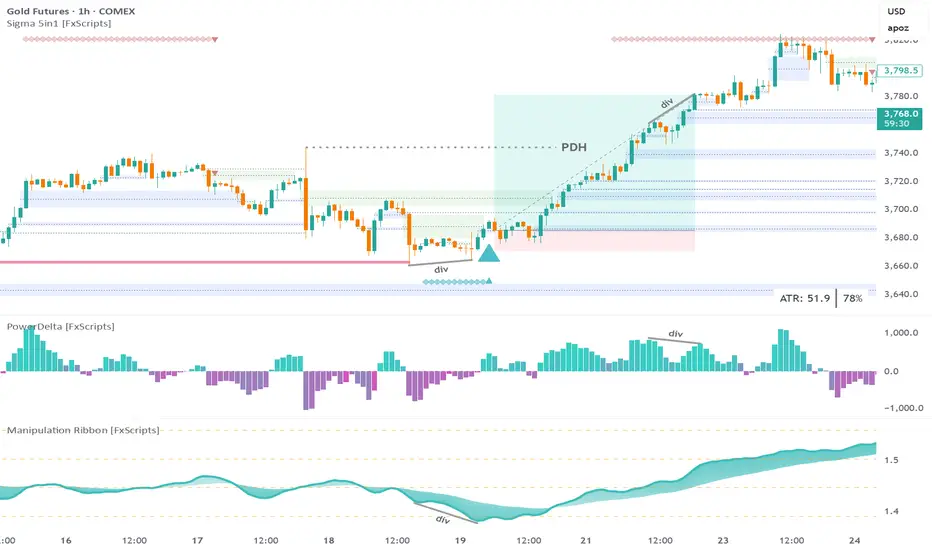
GC Futures 15m: 6.6:1 trade executed using Sigma Trading SystemStep 1: wait for a sweep of daily liquidity
Note: the sweep must be confirmed for any of the other confluences to be valid
Step 2: wait for a bullish marker to be drawn by the Reversal Print indicator
Tip: set an alert if you don’t want to spend all day staring at the chart
Step 3: look for a divergence with either the PowerDelta Oscillator or, in this case, the Manipulation Ribbon
Info: the Manipulation Ribbon detects areas of price manipulation by Market Makers vs areas where it is trading in a natural, price-driven state
Step 4: the entry is a tap of the most recent confirmed FVG
FYI: all the drawings on the main chart are created by the Sigma 5-in-1 indicator
SL: low of first candle that forms the entry FVG
Tip: for a more conservative approach the recent swing low could also be used
TP: bearish divergence with the PowerDelta Oscillator
Note: gold was at an all-time high so anything beyond the Previous Day High (PDH) posed a risk however for a more conservative approach you could exit half your position at the PDH
EURUSD LONG 15MThe trend still bullish, It will go short first then fulfill the unmitigated imbalance. This is just my analysis sorry if i'm wrong.

EURUSD 15M The trend on 1H is Bearish, i check on 15M we can open trade for a scalp to take a little profit

Equity Research Report – TVS Motor Company Ltd.📌 Timeframes Analyzed: 15-Minute and 1-Hour
📅 Date: May 5, 2025
📍 CMP: ₹2,774.40
📈 Setup: Bullish breakout from falling channel with EMA crossover
🔹 Technical Highlights
Pattern: Descending channel breakout (1H)
Moving Averages: Price is trading above the 20-EMA and 50-EMA with bullish crossover
Volume: Breakout confirmed by increasing volume
RSI (Momentum): RSI is trending up above 50 with positive divergence
🟢 Trade Plan – Intraday to Short-Term Swing
✅ Buy Levels (Confirmation Entry)
Buy Above: ₹2,780 (breakout confirmation level)
🎯 Targets
Timeframe Target 1 Target 2 Target 3
15-min ₹2,810 ₹2,835 ₹2,860
1-hour ₹2,850 ₹2,880 ₹2,920
🔻 Stop Loss
Intraday SL: ₹2,745 (below channel support and 50-EMA)
Swing SL: ₹2,720

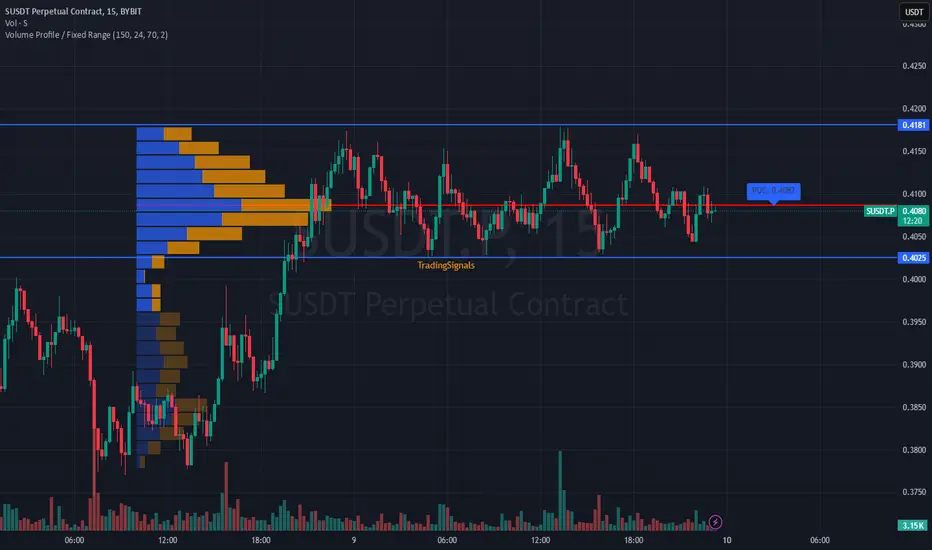
Analysis of #SUSDT – Watching for a Breakout📊 Analysis of BYBIT:SUSDT.P – Watching for a Breakout
15M TF
✅ Overview:
➡️ BYBIT:SUSDT.P is trading within a range, consolidating between $0.4025 (support) and $0.4181 (resistance).
➡️ POC (Point of Control) at $0.4087 represents the highest liquidity area, making it a key level where price could decide its next move.
➡️ A breakdown below $0.4025 could lead to further downside, as there is little strong support below this level.
➡️ If the price holds above $0.4181, we could see a push toward higher resistance levels.
⚡ Plan of Action:
📈 Bullish Scenario:
➡️ If price holds above $0.4087 (POC) and breaks $0.4181, an upward move is expected with increased momentum.
📉 Bearish Scenario:
➡️ If price drops below $0.4087 and breaks $0.4025, expect accelerated downside movement.
🚀 BYBIT:SUSDT.P is in a consolidation phase – preparing for a breakout!
📢 BYBIT:SUSDT.P is in an accumulation phase, and a breakout of key levels will determine the next trend.
📢 Watch volume closely – an increase on a breakout will confirm a stronger move.

UJ update / analysis D and 15 min - targets in sights higherAs mentioned when we failed to go below the old W1 low, that sights go to upper targets.
Nice confluence on 15 and D for area to watch for this first target above.
Happy Trading!
- Doc

15 min bias to upside .. looking for move before FOMC Laggy, overlapping trading this am.
Discuss bias , move potentials and the window of TIME..
IF its going to go.. when it should MOVE or tell us we have a session to skip.
where levels to upside were set and ask if want a higher TF quick vid for the upper zone explanation.
Happy Trading guys..
Careful this afternoon with FOMC..
-- DOC

SMC - UsdJpy 15min update - levels etcReview of where we are looking and if the lows are out .. at least for now.. eyes are above and there are levels here to reach for.
Still using the previous marked 1h and weekly levels and important areas of interest for framing the Price Action
Happy Trading,
-- Doc
PS - leave a comment and let me know what you think will happen. Let me know if you see something different if you have more experience with this pair etc. What do you think of the areas of interest and how the price is moving around them etc.

NQ Premarket 15 min Targets and markups - SMC SMC premarket mark up at 15/1 levels. Note the DVI in aqua. Currently my eyes are on the upper BSL resting from REH at overnight highs. Monday is fickle - we have potential monday hangover. Friday did not reclaim any of the bull move - so the 25% drop is in mind. Personally not interested in this today. Main target above is still in sights - that obvious 925 area on the new DEC contract.
NWOG and NDOGs are out for me with new contract so will use HLOC of days looking back 3-5 for now.
Lets see how Monday goes.. Sl bias UP but only gonna hop in trade on this Monday if it is a great setup..
Happy Trading -- Doc

NQ Sep 16 Targets, gaps and SMC setups premarketThe new week is about to open.. Primary target for the week is that CLEAN upper zone at 925.
on the new Dec contract.
We have Short term interest above but we also never reclaimed any of the Last week bull move.. so we have a MONDAY HANGOVER possible situation with the 25% mark retrace of the bull week marked as a line in the sand below.
Monday and no news.. unlikely to move that much, but worth marking it out.
Best looking target to me right now is the OVERNIGHT HIGHS REH, should a good set up arise.
WKLY FVG is just below and attractive to move there during the premarket.
Happy Trading
- Doc

head and shoulder at $2500since price hit 2500 for first time on last friday
gold is sideways but it has made this head and shoulder pattern with yellow line working as neckline of pattern .
first intraday support 2480
yellow line intraday resistance

NZDUSD | 15m Trade Plan | Intraday15m current market condition : Took entire buy-side liquidity
During killzones:
Plan A : Take a short position after a 15m bearish confirmation.
Plan B : After inducement is taken, take a long position following a 15m bullish confirmation.
Plan C : Wait for the entire sell-side liquidity sweep, then take a long position based on a 15m bullish confirmation.
note : It's more likely that the marked demand zone will not be respected by the upcoming market session(s).

15m Trade Plan | IntradayHere's a breakdown of the steps you can follow to analyze the 15-minute chart based on your strategy:
Identify a Valid Break of Structure (BoS):
On the 15-minute chart, find the most recent significant swing point where the price broke a previous structure. This is your BoS.
Mark the Swing High and Swing Low associated with this BoS.
Mark Internal Pullbacks (Liquidity Spots):
Within the range of the Swing High and Swing Low, identify the smaller pullbacks or retracements. These are the internal liquidity spots.
Mark these liquidity spots on your chart.
Identify Sub-Internal Structural Points:
Between the marked liquidity spots, look for even smaller price movements or minor structural points that may represent areas of consolidation or minor trend reversals.
Mark these sub-internal structural points on the chart.
Determine Entry Points:
Based on the liquidity sweeps:
Buy-side liquidity sweeps: Look for areas where the price sweeps the liquidity above the previous highs.
Sell-side liquidity sweeps: Look for areas where the price sweeps the liquidity below the previous lows.
Take entries at these points depending on the direction of the BoS.
Consider the 15-Minute BoS Direction as the Continuation Trend:
Ensure your entries align with the overall trend direction indicated by the 15-minute BoS.
If the BoS is upward, focus more on buy-side entries.
If the BoS is downward, focus more on sell-side entries.
This approach helps you stay aligned with the trend while also capitalizing on liquidity sweeps for potentially high-probability trade entries.

EUR/USD in 15min time frameI expect that it will fall to the next order block then we will buy after seeing the choch signal

UK100 is Ready For SHORT Positionuk100 /USDT is Going to get a good setup for SHORT POSITION
you can get this position with 0.2 LOT
Good Luck & dont forget to set SL & TP

GOLD is Ready For LONG PositionXAU /USDT is Going to get a good setup for LONG POSITION
you can get this position with 0.1 LOT
Good Luck & dont forget to set SL & TP

GBPJPY is Ready For LONG PositionGBP / JPY is Going to get a good setup for LONG POSITION
you can get this position with 0.7 LOT
Good Luck & dont forget to set SL & TP

GOLD is Ready For SHORT PositionXAU /USDT is Going to get a good setup for SHORT POSITION
you can get this position with 0.1 LOT
Good Luck & dont forget to set SL & TP

BTC 15mIf we do hold that up trend, here's a trade set up we are watching. Short at the intersect of the previous trend line and the purple box. Trade entry around 16:30-17:30-ish.
If price tests that zone too early, or after 17:30h, we sit on our hands. Just an idea, have fun!
edit: green dashed lines for take profits, stop placed somewhere above that purple zone, give it some room and manage your risk well (of course you do that already)

NASDAQ US100Hey traders,im currently analyzing nasdaq US100. All i can say is that the us100 on this lower timeframe is gonna have some buying power, following its trend. Not perfect but i hope i have atleast great insights on thi signal. Plese let me know what you think?🙏📉

USDJPY: enough Monday momentum?Potential bullish Judas Swing for another entry position.
1) liq grab of low
2) bullish CHoCH
3) identify established FVg
4) set entry to 50% of FVG/imbalance
5) wait for FVG to be fully tested and rejected (closed inside but wicked outside.
6) go to your lower tf (I pick 1m for entry)
7) wait for CHoCH on lower tf
8) find fvg created
9) wait for retest and rejection
10) enter
