$BTC — WEEK 49 TREND REPORTBTC — WEEK 49 TREND REPORT
Ticker: BITSTAMP:BTCUSD — 12/02/2025 @ 90,800
Timeframe: WEEKLY
This is a reactive structural classification of BTCUSD based on the weekly chart as of this timestamp. Price conditions are evaluated as they stand — nothing here is predictive or forward-assumptive.
⸻
1) Current Trend Condition
• Trend Duration: +9 weeks (bearish)
• Trend Reversal Level (Bullish): 103404.5$
• Trend Reversal Level (Bullish)( Confirmation ): 103405$
• Pullback Support: 100,074$
• Correction Support: 79,507$
⸻
2) Structure Health
• Retracement Phase:
Correction (approaching 61.8%)
• Position Status:
Unstable (price below both structural layers)
⸻
3) Temperature:
• Cooling Phase
⸻
4) Momentum :
• Bearish
⸻
Author’s Note
This analysis is fully reactive, not predictive. Market conditions, trend structure, and behavior are classified as they appear in real time. The objective is to identify where directional shifts first occurred, where structural integrity remains intact, and where it would begin to weaken if key levels were breached.
Predictive analysis projects outcomes that do not exist yet. Without price confirmation, prediction is built on baseless assumptions. This framework avoids that entirely by responding only to verified structural changes and live conditions.
The levels shown simply identify where the current trend structure first shifted and where it would begin to lose integrity if breached. Recognizing these boundaries allows for clearer interpretation of market behavior without relying on forward guarantees, speculative projections, or unsupported assumptions.
⸻
Methodology Overview
This classification framework evaluates directional conditions using internal trend-interpretation logic that references price behavior relative to its structural layers. These relationships are used to identify when price movement aligns with the framework’s criteria for directional phases, transition points, or regime shifts. Visual elements or structural labels reflect these internal interpretations, rather than explicit trading signals or preset indicator crossovers. This framework is observational only and does not imply future outcomes.
2026bullrun

SPX WEEK 48 — Strong Bounce Into Year-End! 2026 BULL RUN COMING?Strong week for the SP:SPX index. After two weeks of hesitation candles, price finally shifted back into strength and pushed decisively higher. This week’s candle not only reclaimed momentum but fully erased last week’s cooling-off behavior.
Price also moved well above the key mid-range levels that traders usually watch to define trend health. It’s now sitting firmly above the major risk zone and continues building distance away from it — a clear sign of strength. From the moment this week’s upside break triggered, the index has gained roughly 1.9%, and that kind of move typically translates into solid returns for options traders playing directional setups.
Major support zones sit lower around 5900, 5100, and the deeper structural support near 4000. As long as price holds above the upper layers of support, momentum remains intact.
On the higher-timeframe monthly chart, the trend has been active for eight straight months with no signs of exhaustion. Price is still far above the level where the monthly trend began, and even further above the long-term midline — showing how dominant the larger trend still is.
The 2-day chart continues to support the overall bullish structure, breaking above short-term levels and maintaining strength after multiple confirmations earlier in the week.
This week was a clean continuation of the broader uptrend — strong candle, strong momentum, and strong positioning above every major structural region.
Elite clarity. Elite precision. More coming soon.

NYFANG ETF: A Consistent Performer with Promising Future Return
Title:
NYFANG ETF: A Consistent Performer with Promising Future Returns
Greetings, Traders!
🌟 Hello everyone,
The NYFANG ETF has demonstrated remarkable consistency in recent years, delivering impressive returns year-on-year. Since 2023, it has consistently posted returns ranging from **25%** to **100%**, showcasing its robust performance.
ICEUS:NYFANG
Key Observations:
- Over the past few years, NYFAANG has shown strong growth, with annual returns of approximately **100%**, **73%**, and **30%** in consecutive years. These figures highlight its potential for generating substantial wealth.
- The compound annual growth rate (CAGR) exceeds **30%** year-on-year, indicating that investments in NYFAANG could potentially double within a three-year period.
- Looking ahead to 2026, the prospects for NYFAANG remain strong, making it one of the top picks for accumulating **25%** or more wealth over the year.
Technical Analysis:
The chart analysis reveals a consistent upward trend, with significant gains from January to December each year. The historical performance suggests that the ETF is likely to maintain its positive momentum, providing a favorable environment for long-term investors.
Fundamental Factors:
The underlying companies in NYFAANG continue to innovate and expand their market presence, ensuring sustained growth. Factors such as technological advancements, strong earnings reports, and market leadership contribute to the ETF’s resilience and potential for future returns.
Trading Strategies:
Given the historical performance and strong fundamentals, investors may consider accumulating positions in the NYFAANG ETF, particularly for long-term growth. Strategic entries during market dips can enhance overall returns, and maintaining a diversified portfolio is key.
In Conclusion:
NYFAANG ETF stands out as a consistent winner, offering significant growth potential. With a proven track record of high returns and a promising outlook for the coming years, it remains an attractive investment for those seeking robust long-term gains.
Engage with Us:
🟢 If you find this analysis insightful, please give it a LIKE.
🟡 Don’t forget to FOLLOW for more updates.
🔵 SHARE with fellow traders who might benefit from this information.
🔴 Feel free to COMMENT with your thoughts and insights!
Your active participation enriches our trading community, fostering knowledge exchange and collective growth. Share your feedback and ideas in the comments below or by boosting this post.
In case of any queries, please reach out for further clarification. Looking forward to your thoughts!
Happy trading!

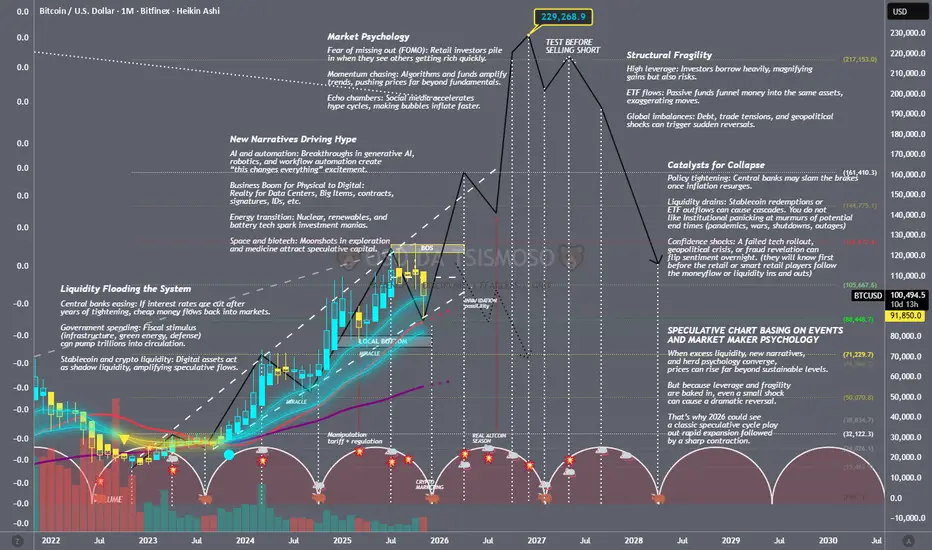
SPECULATIVE CHART (EVENTS AND MARKET MAKER PSYCHOLOGY FOR BTC)📘 Bitcoin Speculative Cycle (2026 Potential move I see)
1. Recognize the Setup
Liquidity conditions: Track central bank easing, stablecoin issuance, and ETF inflows. These are the fuel.
Narratives: Watch for hype drivers (AI + blockchain, tokenized real‑world assets, sovereign adoption).
Sentiment signals: Social media buzz, Google Trends, and retail inflows often spike before parabolic moves.
2. Identify the Expansion Phase
Price action: BTC breaks prior cycle highs with strong volume.
On‑chain metrics: Rising active addresses, increasing exchange inflows, and high leverage in futures.
ETF/Institutional flows: Monitor daily net inflows into Bitcoin ETFs — they magnify moves.
3. Ride the Momentum
Entry strategy: Scale in during confirmed uptrend (higher highs, higher lows).
Risk management: Use stop‑losses or hedge with stablecoins; never go all‑in.
Position sizing: Keep leverage modest speculative cycles punish overexposure.
4. Spot the Peak
Excessive leverage: Funding rates go extreme, perpetual swaps show unsustainable longs.
Retail mania: Everyone is talking about BTC, mainstream media runs “get rich quick” stories.
On‑chain warnings: Whales start sending coins to exchanges, signaling distribution.
5. Prepare for the Collapse
Exit strategy: Scale out when parabolic moves stall; don’t wait for the top tick.
Liquidity drains: Watch stablecoin redemptions and ETF outflows they trigger cascades.
Policy shocks: Rate hikes or regulatory crackdowns can flip sentiment instantly.
6. Survive and Reset
Capital preservation: Rotate into cash or defensive assets once the downtrend is confirmed.
Audit your trades: Document entries/exits to refine your playbook for the next cycle.
Re‑accumulate: Buy back BTC only after capitulation signs (low volume, despair, long consolidation).
🛠 Tools I used to track this;
On‑chain dashboards: Glassnode, CryptoQuant (free tiers give useful signals).
ETF flow trackers: Daily inflows/outflows for spot BTC ETFs.
Stablecoin supply charts: USDT/USDC issuance as shadow liquidity indicators.
Funding rate monitors: Binance, Bybit, Deribit for leverage extremes.
2025 BTC Top $109K or $123K Max for this Bull Run ???Currently, Bitcoin is unable to break through the all-time high timeline, and it has been testing it twice so far. Being unable to get a one-day candle to close over this resistance line. BTC may be able to keep sliding up the line till $123K but may not be able to get the $160K target price as I was assuming it would hit based on the Fibonacci scale. Currently, there are too many factors holding it down. At the moment Bitcoin can currently go all the way down $43,709 at this point and still be bullish to make a second attempt to break the Resistance line. If it goes below this price point then that is an official signal we are in the bear market. Also at the current price point, the target bottom drop for BTC would be about $25K. And if BTC is able to go higher in price then these target prices would just move up a little. Sadly if all of this comes true then we will be looking at an even smaller increase through the next Bull Run of 2026.
