2350 Technical Analysis: Breakout with Weekly Bullish Signals2350 (Saudi Kayan Petrochemical Co.)
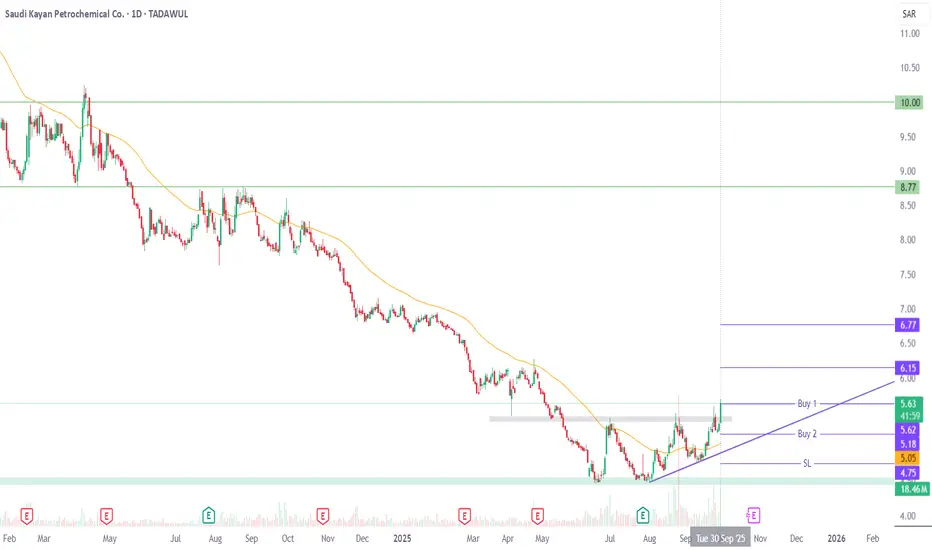
Price has broken out above the previous high, which had also been a major resistance level since May. It is trading above the 55 Fibonacci EMA, a level that has historically served as dynamic support.
On the weekly timeframe, price has broken out of a falling wedge, confirmed a double bottom, and printed bullish divergence — all of which strengthen the bullish outlook.
The first buy is at CMP, with Buy 2 positioned lower to average in on a pullback. TP1 and TP2 are aligned with near-term resistances, while sustained momentum beyond TP2 opens room for price to extend toward 8.77 and even 10. Stop loss is set below 4.75 on a closing basis to define risk.
Recommended Levels:
Buy 1: 5.62 (CMP)
Buy 2: 5.18
Stop Loss: Closing below 4.75
Take Profit 1: 6.15
Take Profit 2: 6.77
Take Profit 3: Ride the trend with a trailing stop
Potential upside remains as long as momentum sustains above the breakout zone and 55 EMA. Happy trading!
2350
TASI-2350: SAUDI KAYAN PETROCHEMICAL COMPANYShot-term Bullish Retracement for TASI-2350: Saudi Kayan Petrochemical Company
Buy-1 at 6.92 and Buy-2 at 6.87 with Stop Loss at 6.82
TP-1 = 6.98, TP-2 = 7.02

2350_Trendline Breakout (Bullish Setup)Price has taken support at C&H formation target.
HH, HL in formation.
Price has reached a strong horizontal level (acting as resistance)
Take Entry after Breakout of horizontal level (Resistance); will be converted to support.
SL and TPs are specified.
Trail stop loss accordingly.

2350: SAUDI KAYAN_TASI (Parallel Channel Breakout)Parallel Channel Breakout Observed
Completion of Cup & Handle Target
Short term and long term Bullish setup is available
Wait for HH, HL formation
Entry above watchout level
Horizontal support Levels are specified for TPs
Ride the trend and Trail your stop loss
Manage your risk properly

2350: SAUDI KAYAN_TASI (Channel Breakout)Descending Parallel Channel Breakout and Retest
Inverted Cup & Handle formation
Support from 50 EMA
Crossed Strong Horizontal Support/Resistance Line
Series of HH, HL formation
Trade with stop loss
Ride with trailing stop loss

2350: SAUDI KAYAN_TASI
Watch for Triangle Breakout
Take Entry with stop loss @ Triangle Top
Trail Stop Loss for TPs as per fib levels

2350: TASIWait for Target completions for Long Entry
Watchout for
Horizontal Supports,
Cup & Handle Patterns Targets,
Ascending Triangle Breakdown targets


BITCOIN: BTCUSD Must break above 2350 to stay positive nowBITCOIN: BTCUSD Approaching major resistance at 2340- 2350 again. It has to break above 2350 now to remain positive and to re-open the way for 400 point rally back to the high
