2380 Technical Analysis: Weekly Bullish Breakout in Play2380 (Rabigh Refining & Petrochemical Co.)
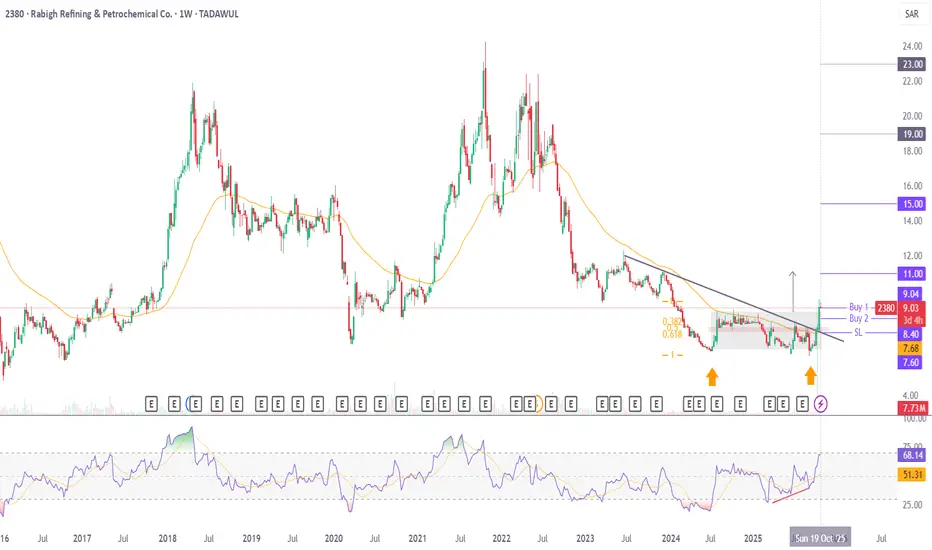
Price has broken out of a bullish rectangle pattern on the weekly timeframe, supported by bullish divergence and strong volume. On the monthly chart, it has formed a double bottom and hidden bullish divergence, while continuing to move within a long-term range between 26 and 6 since 2009.
Price is trading above the 55 Fibonacci EMA on the weekly chart — a level it has historically respected as dynamic support and resistance. It has also given a breakout from the daily trendline, further strengthening the bullish structure.
Buy 2 is positioned lower in case of a healthy pullback for a stronger average. TP1 aligns with the rectangle projection, while sustained momentum could open room for price to extend toward 15, 19 and 23.
Recommended Levels:
Buy 1: 9.04 (CMP)
Buy 2: 8.40
Stop Loss: Closing below 7.60
Take Profit 1: 11.00
Take Profit 2: 15.00
Take Profit 3: Ride the trend with a trailing stop
Financially, the stock isn’t too strong — only free cash flow from operating activities and overall FCF remain positive on a quarterly basis.
Potential remains strong technically as long as price sustains above the 55 EMA. Happy trading!
2380
2380 : Petro Rabigh (+50% by Dec 2022)Petro Rabigh chart had performed very well for us last year from sub 14 to 27 SAR and now is about to perform again!
The reason for this projection is the underline macro trend that is now confirmed and is about to break to the upside with potential gains of +50%.
The method we use is HVF, long tested and proved accurate with combined with volume analysis.
What we see in this chart is an imminent move in the stock to +23% from current levels by July 2022. And +50% by year end. Other targets are marked on the chart.

2380 : Petro Rabigh Macro Trend TADAWUL:2380
Petro Rabigh is way under appreciated in a pull market. The chart is moving towards a breakout above 15 SAR to make Hi3 on the underlying volatility funnel. For early entry only!
