JPY Futures - Can We Take Out The 3rd ExoFade PeakTo clear any confusing for those that dont know, 6J Futures aka JPY/USD, is the inverse of your regular USD/JPY. Got it?
It's currently in a strong uptrend, since the dollar is in a free fall.
We've been taking out the ExoFade peaks and the trend looks juicy. Taking the 3rd pullback bounce of a uptrend is not my favorite thing to do cos each time you get a bounce, the probably of the next of failing goes up significantly cos sellers need to feed their families too lol.
The first bounce in a new uptrend has a higher success rate and with much lower risk required.
The ExoFade peaks are great for setting price targets and prediction, and we can see the last 2 peaks we're successfully taken out. If the trends momentum stays intact, i expect us to take out the 3rd one as predicted.
London session is in a couple of hours, which will inject more volatility and we have unemployment news in the morning, which can disrupt the trend.
We'll see how it goes.
6J1!

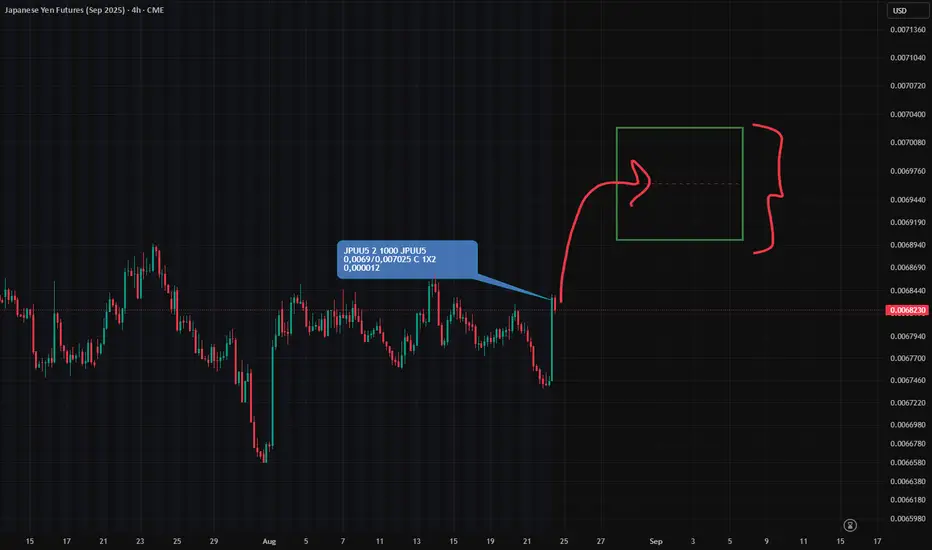
Just Because It’s Big Doesn’t Mean It’s SmartJPY Call Spread Breakdown: Bullish Signal — Or Just Obvious FOMO?
A new vertical call spread appeared in JPY options yesterday (per CME Globex data):
Long 0.0069 Call
Short 0.007025 Call
🎯 Target: 0.007025 — upside continuation play.
Open interest increased at both strikes → new position, not a roll.
Size? Relatively large for JPY (based on systematic observations).
⏰ When Was It Opened?
9:45 AM CT — after yesterday’s sharp rally in JPY futures.
In fact — right at the top of the move.
📌 Not before the move.
But after the impulse, on momentum.
🔍 Combining Flow + Chart Context:
Price had already spiked up.
The spread bets on further upside .
🧠 Key Takeaways:
✅ Sentiment: Bullish
❌ Predictive value: Low — nearly zero
Why?
The setup is too obvious.
No evidence of insider-like timing.
If this had been placed before the move — yes, it would matter.
But opening at the peak? That’s not edge — it’s FOMO dressed as strategy.
🚫 Will I go long JPY futures based on this?
No.
Not because I doubt the move.
But because this isn’t smart money behavior — it’s trend-chasing.
🎯 Final Lesson:
Not every large options trade is a signal.
Always ask:
When was it placed?
Why here?
Who’s behind it?
🔍 True edge isn’t in the trade itself — it’s in the context around it.
USDJPY: The Fed & BOJ Likely To Keep Rates In Place. Buy It!Welcome back to the Weekly Forex Forecast for the week of July 28 - Aug 1st.
In this video, we will analyze the following FX market:
USDJPY
The FED and BOJ are expected to keep their perspective interest rates, come Wednesday. The USD is stabilizing, a US-Japanese tariff deal inked, and investors are slowing moving money from the Yen safe haven to riskier assets.
Look for USDJPY to slowly move higher.
Enjoy!
May profits be upon you.
Leave any questions or comments in the comment section.
I appreciate any feedback from my viewers!
Like and/or subscribe if you want more accurate analysis.
Thank you so much!
Disclaimer:
I do not provide personal investment advice and I am not a qualified licensed investment advisor.
All information found here, including any ideas, opinions, views, predictions, forecasts, commentaries, suggestions, expressed or implied herein, are for informational, entertainment or educational purposes only and should not be construed as personal investment advice. While the information provided is believed to be accurate, it may include errors or inaccuracies.
I will not and cannot be held liable for any actions you take as a result of anything you read here.
Conduct your own due diligence, or consult a licensed financial advisor or broker before making any and all investment decisions. Any investments, trades, speculations, or decisions made on the basis of any information found on this channel, expressed or implied herein, are committed at your own risk, financial or otherwise.

July 7 - 11th: Sell The RIPs, Buy The DIPs! (PART 2)Welcome back to the Weekly Forex Forecast!
This is Part 2 of the FOREX futures outlook for the week of July 7 - 11th.
In this video, we will analyze the following FX markets:
CHF and JPY
Last Friday was a bank holiday, so the price action is discounted. This Monday has no red folders on the calendar, so the environment is set for a day of misdirection. Be careful to take only trades that confirm your directional bias!
USD is still weak, and analyst have determined the FED will put off cutting rates until September. Tariffs wars may start up again July 9th. And Trumps Bill can add 3+ trillion to the debt.
None of this supports the USD!
Look to buy the dips xxx USD, and look to sell the rips vs USD xxx.
Enjoy!
May profits be upon you.
Leave any questions or comments in the comment section.
I appreciate any feedback from my viewers!
Like and/or subscribe if you want more accurate analysis.
Thank you so much!
Disclaimer:
I do not provide personal investment advice and I am not a qualified licensed investment advisor.
All information found here, including any ideas, opinions, views, predictions, forecasts, commentaries, suggestions, expressed or implied herein, are for informational, entertainment or educational purposes only and should not be construed as personal investment advice. While the information provided is believed to be accurate, it may include errors or inaccuracies.
I will not and cannot be held liable for any actions you take as a result of anything you read here.
Conduct your own due diligence, or consult a licensed financial advisor or broker before making any and all investment decisions. Any investments, trades, speculations, or decisions made on the basis of any information found on this channel, expressed or implied herein, are committed at your own risk, financial or otherwise.

Risk On! The US Dollar Is Weak! Buy The Major Pairs!This is the FOREX futures outlook for the week of Jun 29 - July 4th.
In this video, we will analyze the following FX markets:
USD Index, EUR, GBP, AUD, NZD, CAD, CHF, and JPY.
Investors are taken money out of safe havens and putting it into risk assets. The US Dollar saw those outflows last week, and we are likely to see that continue going into this week.
Buy the EUR, GBP and CHF vs USD. JPY should also see some upside.
The AUD and NZD continue to grind upwards as well.
Enjoy!
May profits be upon you.
Leave any questions or comments in the comment section.
I appreciate any feedback from my viewers!
Like and/or subscribe if you want more accurate analysis.
Thank you so much!
Disclaimer:
I do not provide personal investment advice and I am not a qualified licensed investment advisor.
All information found here, including any ideas, opinions, views, predictions, forecasts, commentaries, suggestions, expressed or implied herein, are for informational, entertainment or educational purposes only and should not be construed as personal investment advice. While the information provided is believed to be accurate, it may include errors or inaccuracies.
I will not and cannot be held liable for any actions you take as a result of anything you read here.
Conduct your own due diligence, or consult a licensed financial advisor or broker before making any and all investment decisions. Any investments, trades, speculations, or decisions made on the basis of any information found on this channel, expressed or implied herein, are committed at your own risk, financial or otherwise.

US Missiles Flyin'! Buy USD vs EUR GBP AUD NZD CAD CHF JPY!This is the FOREX futures outlook for the week of Jun 22-28th.
In this video, we will analyze the following FX markets:
USD Index, EUR, GBP, AUD, NZD, CAD, CHF, and JPY.
The USD is the world's reserve currency. When there are geo-political hot spots in the world, the USD sees inflows from investors. In light of US strikes against Iranians nuke sites last night, buying the USD versus other currencies is prudent and wise.
The USD should see more gains as long as the current tensions are high. If Iran comes back to the negotiations table, then the environment switches back to a risk on scenario, where the outflows from the USD go back into riskier assets like the stock market.
Enjoy!
May profits be upon you.
Leave any questions or comments in the comment section.
I appreciate any feedback from my viewers!
Like and/or subscribe if you want more accurate analysis.
Thank you so much!
Disclaimer:
I do not provide personal investment advice and I am not a qualified licensed investment advisor.
All information found here, including any ideas, opinions, views, predictions, forecasts, commentaries, suggestions, expressed or implied herein, are for informational, entertainment or educational purposes only and should not be construed as personal investment advice. While the information provided is believed to be accurate, it may include errors or inaccuracies.
I will not and cannot be held liable for any actions you take as a result of anything you read here.
Conduct your own due diligence, or consult a licensed financial advisor or broker before making any and all investment decisions. Any investments, trades, speculations, or decisions made on the basis of any information found on this channel, expressed or implied herein, are committed at your own risk, financial or otherwise.

Short Term USD Strength This Week! Sell The Majors?This is the FOREX futures outlook for the week of Jun 8 - 12th.
In this video, we will analyze the following FX markets:
USD Index, EUR, GBP, AUD, NZD, CAD, CHF, and JPY.
USD gained some strength on Friday's job data. Talks with China this week may add to it. But I believe the bullishness will be short term.
Look for valid sells in EUR and GBP. Be cautious with AUD and NZD. CAD and CHF will also offer opportunities to sells.
CPI Data due Wed, making that day and the days that follow potentially the best trading days this week.
Enjoy!
May profits be upon you.
Leave any questions or comments in the comment section.
I appreciate any feedback from my viewers!
Like and/or subscribe if you want more accurate analysis.
Thank you so much!
Disclaimer:
I do not provide personal investment advice and I am not a qualified licensed investment advisor.
All information found here, including any ideas, opinions, views, predictions, forecasts, commentaries, suggestions, expressed or implied herein, are for informational, entertainment or educational purposes only and should not be construed as personal investment advice. While the information provided is believed to be accurate, it may include errors or inaccuracies.
I will not and cannot be held liable for any actions you take as a result of anything you read here.
Conduct your own due diligence, or consult a licensed financial advisor or broker before making any and all investment decisions. Any investments, trades, speculations, or decisions made on the basis of any information found on this channel, expressed or implied herein, are committed at your own risk, financial or otherwise.

Weekly FOREX Forecast: When Missiles Fly, So Does The US Dollar This is the FOREX futures outlook for the week of Jun 16-20th.
In this video, we will analyze the following FX markets:
USD Index, EUR, GBP, AUD, NZD, CAD, CHF, and JPY.
Middle East tensions are high, missiles flying.... and so will the USD. Look for the USD to
out perform its counterparts during precarious period.
Enjoy!
May profits be upon you.
Leave any questions or comments in the comment section.
I appreciate any feedback from my viewers!
Like and/or subscribe if you want more accurate analysis.
Thank you so much!
Disclaimer:
I do not provide personal investment advice and I am not a qualified licensed investment advisor.
All information found here, including any ideas, opinions, views, predictions, forecasts, commentaries, suggestions, expressed or implied herein, are for informational, entertainment or educational purposes only and should not be construed as personal investment advice. While the information provided is believed to be accurate, it may include errors or inaccuracies.
I will not and cannot be held liable for any actions you take as a result of anything you read here.
Conduct your own due diligence, or consult a licensed financial advisor or broker before making any and all investment decisions. Any investments, trades, speculations, or decisions made on the basis of any information found on this channel, expressed or implied herein, are committed at your own risk, financial or otherwise.

Weekly FOREX Forecast Jun 2 - 6th: CHF & JPY FuturesThis is the FOREX futures outlook for the week of Jun 2 - 6th.
In this video, we will analyze the following FX markets:
CHF JPY
It's been a consolidative week, but the USD is still weak. Look for valid breakdowns of consolidations before buying against the USD.
NFP week ahead! Mon-Wed will be the best days to trade.
Enjoy!
May profits be upon you.
Leave any questions or comments in the comment section.
I appreciate any feedback from my viewers!
Like and/or subscribe if you want more accurate analysis.
Thank you so much!
Disclaimer:
I do not provide personal investment advice and I am not a qualified licensed investment advisor.
All information found here, including any ideas, opinions, views, predictions, forecasts, commentaries, suggestions, expressed or implied herein, are for informational, entertainment or educational purposes only and should not be construed as personal investment advice. While the information provided is believed to be accurate, it may include errors or inaccuracies.
I will not and cannot be held liable for any actions you take as a result of anything you read here.
Conduct your own due diligence, or consult a licensed financial advisor or broker before making any and all investment decisions. Any investments, trades, speculations, or decisions made on the basis of any information found on this channel, expressed or implied herein, are committed at your own risk, financial or otherwise.

Weekly FOREX Forecast Jun 2 - 6th: Wait to BUY Majors vs USD!This is the FOREX futures outlook for the week of Jun 2 - 6th.
In this video, we will analyze the following FX markets:
USD Index EUR GBP AUD NZD CAD CHF JPY (CHF and JPY forecast to follow).
It's been a consolidative week, but the USD is still weak. Look for valid breakdowns of consolidations before buying against the USD.
NFP week ahead! Mon-Wed will be the best days to trade.
Enjoy!
May profits be upon you.
Leave any questions or comments in the comment section.
I appreciate any feedback from my viewers!
Like and/or subscribe if you want more accurate analysis.
Thank you so much!
Disclaimer:
I do not provide personal investment advice and I am not a qualified licensed investment advisor.
All information found here, including any ideas, opinions, views, predictions, forecasts, commentaries, suggestions, expressed or implied herein, are for informational, entertainment or educational purposes only and should not be construed as personal investment advice. While the information provided is believed to be accurate, it may include errors or inaccuracies.
I will not and cannot be held liable for any actions you take as a result of anything you read here.
Conduct your own due diligence, or consult a licensed financial advisor or broker before making any and all investment decisions. Any investments, trades, speculations, or decisions made on the basis of any information found on this channel, expressed or implied herein, are committed at your own risk, financial or otherwise.

Weekly FOREX Forecast: USD Weakness Continues. Buy The Majors!This is the FOREX futures outlook for the week of May 25 - 31st..
In this video, we will analyze the following FX markets:
USD Index EUR GBP AUD NZD CAD CHF JPY
USD Index has been bearish for weeks. Expect that to continue as Trump threatens EUR and Apple with tariffs.
Buying against the USD is the best bet. Notice the other major currencies charts are showing bullish price action in the form of Bullish Flags or prices nearing buy side liquidity.
Run with the bulls!
Enjoy!
May profits be upon you.
Leave any questions or comments in the comment section.
I appreciate any feedback from my viewers!
Like and/or subscribe if you want more accurate analysis.
Thank you so much!
Disclaimer:
I do not provide personal investment advice and I am not a qualified licensed investment advisor.
All information found here, including any ideas, opinions, views, predictions, forecasts, commentaries, suggestions, expressed or implied herein, are for informational, entertainment or educational purposes only and should not be construed as personal investment advice. While the information provided is believed to be accurate, it may include errors or inaccuracies.
I will not and cannot be held liable for any actions you take as a result of anything you read here.
Conduct your own due diligence, or consult a licensed financial advisor or broker before making any and all investment decisions. Any investments, trades, speculations, or decisions made on the basis of any information found on this channel, expressed or implied herein, are committed at your own risk, financial or otherwise.

Weekly FOREX Forecast: USD, EUR, GBP, AUD, NZD, CAD, CHF, JPYThis is the FOREX Currency futures outlook for the week of May 18 - 24th.
In this video, we will analyze the following FX Majors markets:
USD Index
EUR
GBP
AUD
NZD
CAD
CHF
JPY
USD Index has been bullish for 4 weeks. Will it continue? Expect a pullback before bullish continuation.
Selling the commodity currencies (AUD, CAD, NZD) may be the best course of action this week. Buying the EUR, GBP and CHF may also be worthwhile.
Enjoy!
May profits be upon you.
Leave any questions or comments in the comment section.
I appreciate any feedback from my viewers!
Like and/or subscribe if you want more accurate analysis.
Thank you so much!
Disclaimer:
I do not provide personal investment advice and I am not a qualified licensed investment advisor.
All information found here, including any ideas, opinions, views, predictions, forecasts, commentaries, suggestions, expressed or implied herein, are for informational, entertainment or educational purposes only and should not be construed as personal investment advice. While the information provided is believed to be accurate, it may include errors or inaccuracies.
I will not and cannot be held liable for any actions you take as a result of anything you read here.
Conduct your own due diligence, or consult a licensed financial advisor or broker before making any and all investment decisions. Any investments, trades, speculations, or decisions made on the basis of any information found on this channel, expressed or implied herein, are committed at your own risk, financial or otherwise.

BUY The Major FX Pairs vs USD?? This is the FOREX Currency futures outlook for the week of May 12 - 16th.
In this video, we will analyze the following FX Majors markets:
USD Index
EUR
GBP
AUD
NZD
CAD
CHF
JPY
USD Index finally finished the move to the Daily -FVG, as forecasted last week. Now, will the resistance hold, sending prices lower? I thinking so.
Look to buy xxxUSD pairs. Sell USDxxx pairs.
Wait for valid setups. CPI Data on Tuesday, so be careful.
Enjoy!
May profits be upon you.
Leave any questions or comments in the comment section.
I appreciate any feedback from my viewers!
Like and/or subscribe if you want more accurate analysis.
Thank you so much!
Disclaimer:
I do not provide personal investment advice and I am not a qualified licensed investment advisor.
All information found here, including any ideas, opinions, views, predictions, forecasts, commentaries, suggestions, expressed or implied herein, are for informational, entertainment or educational purposes only and should not be construed as personal investment advice. While the information provided is believed to be accurate, it may include errors or inaccuracies.
I will not and cannot be held liable for any actions you take as a result of anything you read here.
Conduct your own due diligence, or consult a licensed financial advisor or broker before making any and all investment decisions. Any investments, trades, speculations, or decisions made on the basis of any information found on this channel, expressed or implied herein, are committed at your own risk, financial or otherwise.

USD is Bearish, SO BUY EUR, GBP, AUD, NZD CHF & JPY!In this video, we will update Saturday's forecasts mid-week, and look for valid setup for the rest of the week ahead. The following FX markets will be analyzed:
USD Index
EURUSD
GBPUSD
AUDUSD
NZDUSD
USDCAD
USDCHF
USDJPY
Enjoy!
May profits be upon you.
Leave any questions or comments in the comment section.
I appreciate any feedback from my viewers!
Like and/or subscribe if you want more accurate analysis.
Thank you so much!
Disclaimer:
I do not provide personal investment advice and I am not a qualified licensed investment advisor.
All information found here, including any ideas, opinions, views, predictions, forecasts, commentaries, suggestions, expressed or implied herein, are for informational, entertainment or educational purposes only and should not be construed as personal investment advice. While the information provided is believed to be accurate, it may include errors or inaccuracies.
I will not and cannot be held liable for any actions you take as a result of anything you read here.
Conduct your own due diligence, or consult a licensed financial advisor or broker before making any and all investment decisions. Any investments, trades, speculations, or decisions made on the basis of any information found on this channel, expressed or implied herein, are committed at your own risk, financial or other wise. In this video, we will update the forecasts for the following FX markets:

USD Is Bullish Short Term. Short The Majors! This is the FOREX outlook for the week of April 28 - May 2nd.
In this video, we will analyze the following FX markets:
USD Index
EUR
GBP
AUD
NZD
CAD, USDCAD
CHF, USDCHF
JPY, USDJPY
The USD Index is heading up towards a bearish FVG. The EURUSD, GBPUSD, and the other Major pairs will be pulled down by this price action .... until the USD hits it's POI. Then things will get interesting!
Take advantage of the USD push higher!
Remember, NFP is Friday! Be careful of wonky price action on Thursday and Friday.
Enjoy!
May profits be upon you.
Leave any questions or comments in the comment section.
I appreciate any feedback from my viewers!
Like and/or subscribe if you want more accurate analysis.
Thank you so much!
Disclaimer:
I do not provide personal investment advice and I am not a qualified licensed investment advisor.
All information found here, including any ideas, opinions, views, predictions, forecasts, commentaries, suggestions, expressed or implied herein, are for informational, entertainment or educational purposes only and should not be construed as personal investment advice. While the information provided is believed to be accurate, it may include errors or inaccuracies.
I will not and cannot be held liable for any actions you take as a result of anything you read here.
Conduct your own due diligence, or consult a licensed financial advisor or broker before making any and all investment decisions. Any investments, trades, speculations, or decisions made on the basis of any information found on this channel, expressed or implied herein, are committed at your own risk, financial or otherwise.

I've Cracked the BEARISH Code for Japanese Yen Using COTJapanese Yen is setup for sells based on COT positioning and other underlying fundamental conditions.

6J1!: Yen Steady as Dollar Recovers: Reversal WatchThe Japanese Yen maintains its strength in relation to the recovering US Dollar. However, recent improvements in global risk sentiment are beginning to weaken the JPY's appeal as a safe-haven currency. At this point, the Yen is positioned within a significant supply zone, where we are closely monitoring for potential reversal opportunities.
According to the latest COT report, retailers are predominantly holding long positions, which adds an interesting dynamic to the current market environment. As we evaluate the situation, our focus is on the possibility of a reversal, especially as the US Dollar shows signs of regaining momentum. This scenario could lead to notable shifts in currency dynamics, and we are keen to see how these factors will unfold in the near term.
✅ Please share your thoughts about 6J1! in the comments section below and HIT LIKE if you appreciate my analysis. Don't forget to FOLLOW ME; you will help us a lot with this small contribution.

Weekly FOREX Forecast: Wait To Buy JPY vs USD!In this video, we will analyze JPY futures and USDJPY. We'll determine the bias for the upcoming week, and look for the best potential setups.
The Yen is strong, and will outperform the USD in times of uncertainty. It is the worlds' safe haven of choice.
Look for a small retracement before JPY pushes higher.
Enjoy!
May profits be upon you.
Leave any questions or comments in the comment section.
I appreciate any feedback from my viewers!
Like and/or subscribe if you want more accurate analysis.
Thank you so much!
Disclaimer:
I do not provide personal investment advice and I am not a qualified licensed investment advisor.
All information found here, including any ideas, opinions, views, predictions, forecasts, commentaries, suggestions, expressed or implied herein, are for informational, entertainment or educational purposes only and should not be construed as personal investment advice. While the information provided is believed to be accurate, it may include errors or inaccuracies.
I will not and cannot be held liable for any actions you take as a result of anything you read here.
Conduct your own due diligence, or consult a licensed financial advisor or broker before making any and all investment decisions. Any investments, trades, speculations, or decisions made on the basis of any information found on this channel, expressed or implied herein, are committed at your own risk, financial or otherwise.

Weekly FOREX Forecast: Wait for Buys vs USD!This is the FOREX outlook for the week of April 14-18th.
In this video, we will analyze the following FX markets:
USD Index
EUR
GBP
AUD
NZD
CAD
CHF
JPY
The USD is still overall bearish... but is due for a correction. Short term bullishness in the USD is what I am monitoring this week, then aa resumption of it's bearish trend. This will provide
buying opportunities in xxxUSD pairs, and selling opportunities in USDxxx pairs.
Enjoy!
May profits be upon you.
Leave any questions or comments in the comment section.
I appreciate any feedback from my viewers!
Like and/or subscribe if you want more accurate analysis.
Thank you so much!
Disclaimer:
I do not provide personal investment advice and I am not a qualified licensed investment advisor.
All information found here, including any ideas, opinions, views, predictions, forecasts, commentaries, suggestions, expressed or implied herein, are for informational, entertainment or educational purposes only and should not be construed as personal investment advice. While the information provided is believed to be accurate, it may include errors or inaccuracies.
I will not and cannot be held liable for any actions you take as a result of anything you read here.
Conduct your own due diligence, or consult a licensed financial advisor or broker before making any and all investment decisions. Any investments, trades, speculations, or decisions made on the basis of any information found on this channel, expressed or implied herein, are committed at your own risk, financial or otherwise.

Weekly FOREX Forecast: Buy EUR, GBP, AUD, NZD vs USDThis is an outlook for the week of April 7 - 11th.
In this video, we will analyze the following FX markets:
USD Index
EUR
GBP
AUD
NZD
CAD
CHF
JPY
Wait for the market to tip its hand! Monday is a no red folder news day. Great time to let the markets settle on a direction.
Trading a market after a huge push in one direction can be tricky. There is likely to be a pullback before continuing the overall trend. Bear this in mind with the USD.
Enjoy!
May profits be upon you.
Leave any questions or comments in the comment section.
I appreciate any feedback from my viewers!
Like and/or subscribe if you want more accurate analysis.
Thank you so much!
Disclaimer:
I do not provide personal investment advice and I am not a qualified licensed investment advisor.
All information found here, including any ideas, opinions, views, predictions, forecasts, commentaries, suggestions, expressed or implied herein, are for informational, entertainment or educational purposes only and should not be construed as personal investment advice. While the information provided is believed to be accurate, it may include errors or inaccuracies.
I will not and cannot be held liable for any actions you take as a result of anything you read here.
Conduct your own due diligence, or consult a licensed financial advisor or broker before making any and all investment decisions. Any investments, trades, speculations, or decisions made on the basis of any information found on this channel, expressed or implied herein, are committed at your own risk, financial or otherwise.

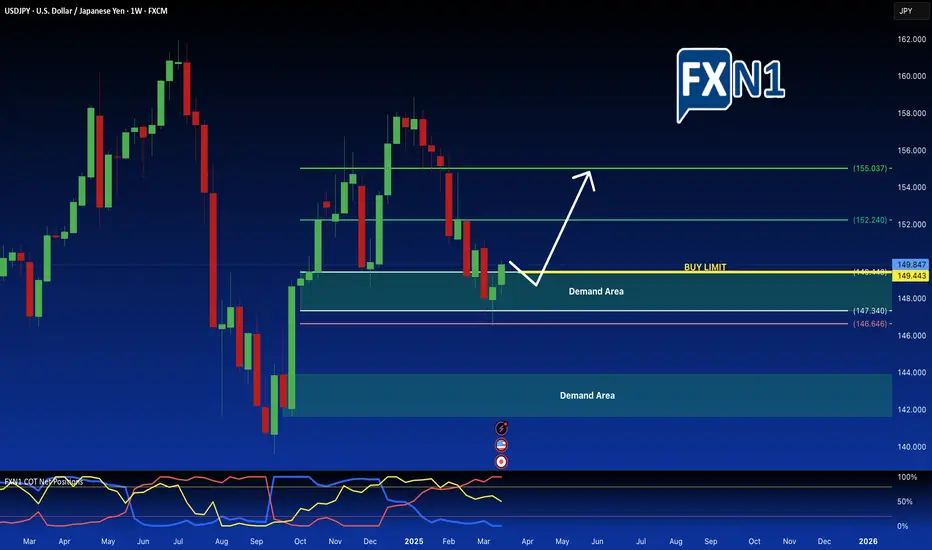
USD/JPY: Long Opportunity at Weekly Demand ZoneThe USD/JPY currency pair is currently pulling back into a significant weekly demand area, presenting a promising opportunity for traders looking to enter long positions. This area historically denotes strong buying interest, suggesting potential upward momentum.
In contrast, the 6J1! Yen futures market displays a bearish sentiment, with many retail traders positioning against this bullish signal in USD/JPY. This divergence in market sentiment could create unique trading opportunities for those who can effectively interpret technical indicators and retail positioning.
Yen Futures
To capitalize on this potential rebound, a pending order has been set on the CFD for USD/JPY, with a buy limit positioned just above the demand zone. Effective risk management, including a stop-loss just below the demand area, is essential as traders navigate this evolving landscape.
In summary, the combination of strong demand at critical levels and contrasting sentiment in the futures market presents a strategic trading scenario for bullish plays in USD/JPY.
✅ Please share your thoughts about USD/JPY in the comments section below and HIT LIKE if you appreciate my analysis. Don't forget to FOLLOW ME; you will help us a lot with this small contribution.
USDJPY; Heikin Ashi Trade IdeaOANDA:USDJPY
In this video, I’ll be sharing my analysis of USDJPY, using my unique Heikin Ashi strategy. I’ll walk you through the reasoning behind my trade setup and highlight key areas where I’m anticipating potential opportunities.
I’m always happy to receive any feedback.
Like, share and comment! ❤️
Thank you for watching my videos! 🙏

Weekly FOREX Forecast Mar 24-28: Buy CAD, CHF, JPY vs USD!This is an outlook for the week of March 24 - 28th.
In this video, we will analyze the following FX markets:
USD Index
EUR
GBP
AUD
NZD
The USD Index is entering a Daily +FVG, which is nested in a Weekly +FVG. This is a bearish indication for the USD, which is a potential bullish situation for EURUSD, GBPUSD, AUDUSD and NZDUSD. This will be potentially bearish for the USDCAD, USDCHF, and USDJPY. Wait for the market structure shift going in the direction of your TP, and enter on the pullback.
Enjoy!
May profits be upon you.
Leave any questions or comments in the comment section.
I appreciate any feedback from my viewers!
Like and/or subscribe if you want more accurate analysis.
Thank you so much!
Disclaimer:
I do not provide personal investment advice and I am not a qualified licensed investment advisor.
All information found here, including any ideas, opinions, views, predictions, forecasts, commentaries, suggestions, expressed or implied herein, are for informational, entertainment or educational purposes only and should not be construed as personal investment advice. While the information provided is believed to be accurate, it may include errors or inaccuracies.
I will not and cannot be held liable for any actions you take as a result of anything you read here.
Conduct your own due diligence, or consult a licensed financial advisor or broker before making any and all investment decisions. Any investments, trades, speculations, or decisions made on the basis of any information found on this channel, expressed or implied herein, are committed at your own risk, financial or otherwise.
