American Airlines Group Inc. (AAL) Reports Earnings TodayAmerican Airlines Group Inc. (NASDAQ: NASDAQ:AAL ) today reported its fourth-quarter and full-year 2025 financial results, including:
Record fourth-quarter revenue of $14.0 billion and record full-year revenue of $54.6 billion.
The government shutdown negatively impacted revenue in the fourth quarter by approximately $325 million
Fourth-quarter and full-year GAAP net income of $99 million and $111 million, or $0.15 and $0.17 per diluted share, respectively.
Excluding net special items1, fourth-quarter and full-year net income of $106 million and $237 million, or $0.16 and $0.36 per diluted share, respectively.
Reduced total debt2 by $2.1 billion in 2025
Full-year 2026 adjusted EPS3 expected to be between $1.70 and $2.70
Company expects free cash flow4 of more than $2 billion in 2026
Technically, NASDAQ:AAL is constricted in a bullish symmetrical triangle. A breakout above the ceiling of the triangle could resort to a bullish move to the $25 resistant. With RSI at 42, the shares of NASDAQ:AAL is poised for a breakout already up 3% in Tuesday's premarket session.
Aalbuy

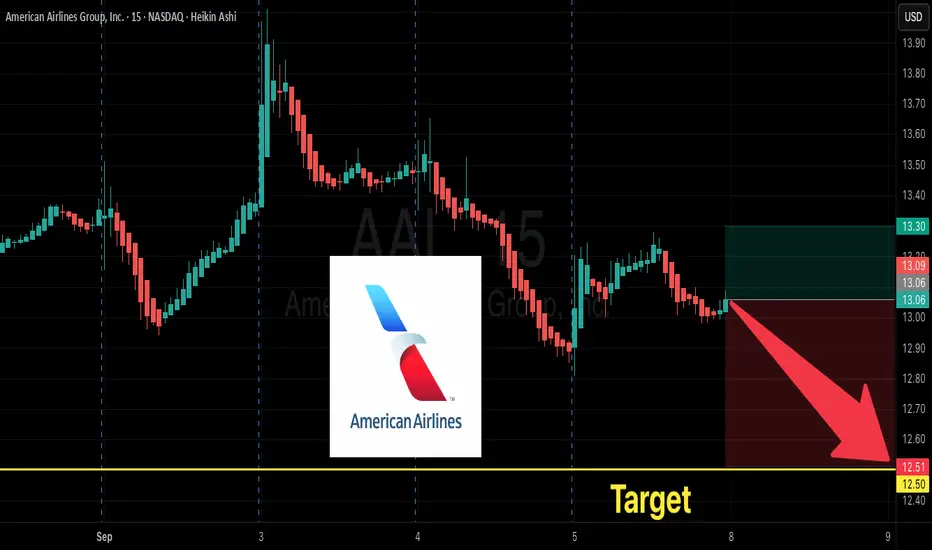
AAL Breakdown Setup — $12.50 PUT Trade Idea!
# 🐻 AAL Weekly Bearish Setup — \$12.50 PUT 🎯 (Sep 12 Expiry)
📊 **Summary**
* **Momentum:** Daily RSI 53.4 falling, Weekly RSI 64.4 falling → downside tilt.
* **Volume:** +30% on a red week → institutional distribution.
* **Options Flow:** Call/Put ratio 1.65 (bullish flow) but likely **retail/covered calls**, not confirmation.
* **Volatility/Gamma:** Favorable for weekly directionals.
---
🎯 **Trade Plan**
* Instrument: **AAL**
* Direction: **PUT (short)**
* Strike: **\$12.50**
* Expiry: **2025-09-12**
* Entry Price: **\$0.20**
* Profit Target: **\$0.40** (100%)
* Stop Loss: **\$0.10**
* Size: **1 contract**
* Confidence: **70%**
---
⚠️ **Risks**
* Heavy call flow could cause short-term squeezes.
* Low-priced weekly options = high theta decay.
* Exit by Thursday to avoid Friday gamma ramp.
---
📉 **Overall Bias:** Bearish tilt — price action + distribution outweigh bullish options flow.
🕒 **Signal Time:** 2025-09-06 09:15 EDT
---
### 🔑 Tags :
\#AAL #OptionsTrading #PutOptions #WeeklyOptions #StockMarket #Bearish #TradingSetup #MomentumTrading #OptionsFlow #TradingView
AAL ( American Airlines Group Inc. ) BUY TF H4 TP = 14.34On the H4 chart the trend started on Aug. 13. (linear regression channel).
There is a high probability of profit taking. Possible take profit level is 14.34
This level, which I have outlined above, is certainly not a “finish” level. But it is the level that has the “highest percentage of hits on target.”
Using a trailing stop is also a good idea!
Please leave your feedback, your opinion. I am very interested in it. Thank you!
Good luck!
Regards, WeBelievelnTrading

AAL Double Bottom RepeatingAAL has seen its first double bottom pump through a bear phase of this indicator
Now it will see its second double bottom pump through similarly the bear phase of the indicator (in green)

AAL $20 Calls December expAAL bouncing the bottom of this trendline. Could see some upside movement right in time for the holiday season!
Entry: $19.50

AAL (AMERICAN AIRLINES GROUP INC) LONG SET UPTITLE/(DATE)- BUY AAL
(American Airline) (9/23)
ASSET- STOCK
ORDER TYPE- market first/BUY LIMIT
Time Frame-1Week
ENTRY PRICE 1- $11.50 market ✅
ENTRY 2- $8.50 (pending)
STOP LOSS- $7.50 (40 PIPS)
TAKE PROFIT 1-$14.50 (30 PIPS)
TAKE PROFIT 2- $19.50 (80 PIPS)
TAKE PROFIT 3- $23.50 (120 PIPS)
STATUS: 🏃🏽♂️ACTIVE 🏃🏽♂️

Tasty investment opportunity! American Airlines buy signalsAmerican Airlines (AAL), monthly chart: 12 years long(!) support line + Oversold + Hidden divergence + 2 Hammers

AAL - GREAT Buy Opportunity, IF ... !!!Hello! Friends,
This would be a great Buy Opportunity, IF NASDAQ:AAL breaks up the Resistance at $10.76 !!

AMERICAN AIRLINES GROUP INC (AAL) Monthly & WeeklyDates in the future with the greatest probability for a price high or price low.
The Djinn Predictive Indicators are simple mathematical equations. Once an equation is given to Siri the algorithm provides the future price swing date. Djinn Indicators work on all charts, for any asset category and in all time frames. Occasionally a Djinn Predictive Indicator will miss its prediction date by one candlestick. If multiple Djinn prediction dates are missed and are plowed through by same color Henikin Ashi candles the asset is being "reset". The "reset" is complete when Henikin Ashi candles are back in sync with Djinn price high or low prediction dates.
One way the Djinn Indicator is used to enter and exit trades:
For best results trade in the direction of the trend.
The Linear Regression channel is used to determine trend direction. The Linear Regression is set at 2 -2 30.
When a green Henikin Ashi candle intersects with the linear regression upper deviation line (green line) and both indicators intersect with a Djinn prediction date a sell is triggered.
When a red Henikin Ashi candle intersects with the linear regression lower deviation line (red line) and both indicators intersect with a Djinn prediction date a buy is triggered.
This trading strategy works on daily, weekly and Monthly Djinn Predictive charts.
Trades made when the monthly, weekly and daily arrows are pointing in the same direction are the most profitable.
This is not trading advice. Trade at your own risk.
