Apple Vision Pro Product Will Add Value To AAPL Stock
I wanted to share some exciting news about Apple’s latest Apple Vision Pro product.
This new device boasts some seriously impressive specs, including a high-resolution display and a powerful processor. But what sets it apart is its unique way of interacting with virtual reality. Instead of relying on clunky controllers, the Apple Vision Pro uses advanced eye-tracking technology to allow for a more natural and intuitive experience.
This could be a game-changer for the VR industry, which has struggled to gain widespread adoption due to its high cost and complex setup. With the Apple Vision Pro, we could see a new wave of interest and excitement in VR, which could translate into big profits for investors.
So, I encourage you to consider investing in Apple long-term. With their track record of innovation and success, I believe they have the potential to revolutionize the VR industry and bring it into the mainstream.
Thank you for your time and consideration. Have a wonderful day! Please let me your thoughts via a comment.
Aaplelong

Get Ready to Experience the Power of Apple's iPhone 15!Are you ready to witness the next big thing in smartphones? Brace yourselves, as Apple's upcoming iPhone 15 will take the tech industry by storm! With its groundbreaking features and cutting-edge technology, the iPhone 15 puts the company in a massive position of strength.
The rumors are already spreading like wildfire, and it's no surprise that Apple fans worldwide are eagerly waiting for the launch of this revolutionary device. From the sleek design to the advanced camera system, the iPhone 15 promises to be a smartphone game-changer.
As an Apple enthusiast, I cannot wait to get my hands on this incredible device. And I strongly encourage you to consider investing in Apple, as the iPhone 15 will be a massive success. With Apple's reputation for delivering innovative and high-quality products, there's no doubt that the iPhone 15 will exceed all expectations.
So, get ready to experience the power of Apple's iPhone 15 and join me in investing in this incredible company. Let's be a part of the revolution and witness the future of technology.
Thank you for your time, and I look forward to your thoughts.

AAPL VR-Headset cause EXPOLSION Rally😎Hi Traders, Investors and Speculators of Charts📈📉
Apple AAPL recently made a new ATH after its introduction of VR Headsets. From technical indicators, we can see that there is still a lot of buying strength in this rally which could likely result in the price going even higher. We use the trend-based Fibonacci Extension to get a possible target at roughly $220.
_________________________________
A bit more on the Tech: The Apple Vision Pro AR headset is expected to offer advanced features, high-quality display, and immersive experiences. It is rumored to have a sleek design, lightweight build, and premium materials. The headset may incorporate both augmented reality (AR) and virtual reality (VR) capabilities, providing users with a wide range of interactive and immersive experiences.
One of the key concerns with this technology is the pricing. The Apple VR headset is expected to be relatively expensive, potentially limiting its accessibility to a broader consumer market. Another concern is the potential for motion sickness or discomfort during extended use, which has been a common challenge with VR headsets.
The introduction of Apple VR headsets can potentially change the way we do things in the future. Firstly, it can revolutionize entertainment and gaming experiences, offering users a more immersive and realistic environment. Additionally, it can have significant implications for industries such as education, training, and communication, providing new ways to learn, collaborate, and connect with others remotely.
Overall, the Apple VR headsets hold the promise of delivering cutting-edge technology and innovative experiences, although there are considerations regarding affordability and user comfort that need to be addressed.
Would you get one?
_______________________
📢Follow us here on TradingView for daily updates and trade ideas on crypto , stocks and commodities 💎Hit like & Follow 👍
We appreciate your support !
CryptoCheck

AAPL set out for the next coming daysTraders we in profit and you can still add more buys as the price move bullish you can see that the price has created a 123 move out of the resistance zone and I believe it will continue doing so until it reaches the Major Swing Level.

Apple to find support at previous resistance?Apple - 30d expiry - We look to Buy at 156.61 (stop at 151.11)
This is curremtly an actively traded stock.
Our bespoke resistance of 157.50 has been clearly broken.
Previous resistance at 156.00 now becomes support.
The primary trend remains bullish.
We look to buy dips.
Our profit targets will be 170.66 and 172.66
Resistance: 162.50 / 165.00 / 166.84
Support: 159.78 / 156.00 / 154.00
Please be advised that the information presented on TradingView is provided to Vantage (‘Vantage Global Limited’, ‘we’) by a third-party provider (‘Signal Centre’). Please be reminded that you are solely responsible for the trading decisions on your account. There is a very high degree of risk involved in trading. Any information and/or content is intended entirely for research, educational and informational purposes only and does not constitute investment or consultation advice or investment strategy. The information is not tailored to the investment needs of any specific person and therefore does not involve a consideration of any of the investment objectives, financial situation or needs of any viewer that may receive it. Kindly also note that past performance is not a reliable indicator of future results. Actual results may differ materially from those anticipated in forward-looking or past performance statements. We assume no liability as to the accuracy or completeness of any of the information and/or content provided herein and the Company cannot be held responsible for any omission, mistake nor for any loss or damage including without limitation to any loss of profit which may arise from reliance on any information supplied by Signal Centre.

AAPL bullish hammer at the beginning of wave 3 uptrendAAPL bullish hammer at the beginning of wave 3 uptrend don't hold over earnings.

AAPL bullish play ideaAAPL is onto big things 2023-2024!
Apple is a technology company that designs, manufactures, and sells consumer electronics, computer software, and online services. The company is well-known for its innovative products such as the iPhone, iPad, and Mac computers. Apple is also one of the largest companies in the world by market capitalization, with a strong balance sheet and a history of generating significant profits.
Over the past decade, Apple's stock has performed very well, with the share price increasing more than fivefold from around $50 per share in 2010 to over $250 per share in 2020. Apple has consistently delivered strong financial results, with revenues and earnings growing steadily year over year.
There are several factors that have contributed to Apple's success and strong stock performance. One key factor is the company's focus on product innovation, with a track record of releasing popular and high-quality products that have captured a loyal customer base. Apple's brand strength and customer loyalty have helped to maintain strong demand for its products, which has translated into strong financial results and stock performance.
Another key factor is Apple's financial strength and stability. The company has a large cash balance and generates significant free cash flow, which it has used to invest in research and development, acquisitions, and share buybacks. This has helped to support Apple's growth and profitability over the long term, which in turn has translated into strong stock performance.
AAPL stocks are always bullish.

Apple -> The Bulls Are StrongHello Traders,
welcome to this free and educational multi-timeframe technical analysis .
On the weekly timeframe you can see that Apple stock just recently perfectly broke above a key previous weekly resistance area exactly at $155 and now after this break all of this previous resistance is turned support.
You can also see that we have a long term downtrendline coming in exactly at $165 which is turned very strong resistance again, so I am now just waiting for a retest of the $155 support area and then I do expect a move to retest the $165 resistance line.
On the daily timeframe you can see that my last analysis on Apple (linked below) already played out nicely, I am now just waiting for a minor break and retest of the current resistance area before I then do expect more continuation towards the upside.
Thank you for watching and I will see you tomorrow!
You can also check out my previous analysis of this asset:

#AAPL Trading plan!Hello friends!
In this idea, I describe the reasons based on which I consider trading in one direction or another.
Resistance level - reversal;
There is energy accumulation before the level for breakout;
The stock looks better than the S&P500;
Yesterday's close below the level (a good signal);
Parabolic energy accumulation before the level.
The stock looks very good, on the chart we have a two-month parabolic accumulation.
If we analyze only the chart, the stock looks like it has potential for medium-term growth upwards.
But let's not forget about the news from the Federal Reserve System (Fed) on March 22, 2023, where
they will discuss further plans regarding the interest rate. So, if the price opens below the level of $153.35,
I plan to buy on the breakout of this level. If the price opens above the level, then I plan to buy on the price
pullback to the level of $153.35. I will describe 4 targets in case of good execution of my plan, where I will close the deal.
Target №1: $160.00
Target №2: $163.00
Target №3: $170.00
Target №4: $176.00
Despite all the targets, at any moment if I do not like the market, the trade will be closed. Be careful, the market
is very unstable right now, enter only from strong levels and with stops!!!
Wishing everyone profits!

Apple -> All Eyes On The BreakoutHello Traders,
welcome to this free and educational multi-timeframe technical analysis .
On the weekly timeframe you can see that Apple stock is once again retesting the quite strong resistance area exactly at $156.
You can also see that this is already the fourth retest from a weekly perspective and the more often we actually retest a zone, the higher the likelihood that we will eventually break it, so from a weekly timeframe I am now just waiting for a breakout above the resistance and a retest and then definitely the continuation towards the upside.
On the daily timeframe you can also see that Bulls are always trying to push Apple stock above the resistance, I think that we are definitely ready for a breakout with my next upside target being at $165.
Thank you for watching and I will see you tomorrow!
You can also check out my previous analysis of this asset:

Apple to break even higher?Apple - 30d expiry - We look to Buy a break of 157.65 (stop at 152.04)
This is curremtly an actively traded stock. 157.50 has been pivotal.
Short term momentum is bullish.
A break of the recent high at 157.38 should result in a further move higher.
Our outlook is bullish.
The primary trend remains bullish.
Our profit targets will be 171.65 and 173.65
Resistance: 157.50 / 160.00 / 163.50
Support: 152.50 / 149.50 / 143.90
Please be advised that the information presented on TradingView is provided to Vantage (‘Vantage Global Limited’, ‘we’) by a third-party provider (‘Signal Centre’). Please be reminded that you are solely responsible for the trading decisions on your account. There is a very high degree of risk involved in trading. Any information and/or content is intended entirely for research, educational and informational purposes only and does not constitute investment or consultation advice or investment strategy. The information is not tailored to the investment needs of any specific person and therefore does not involve a consideration of any of the investment objectives, financial situation or needs of any viewer that may receive it. Kindly also note that past performance is not a reliable indicator of future results. Actual results may differ materially from those anticipated in forward-looking or past performance statements. We assume no liability as to the accuracy or completeness of any of the information and/or content provided herein and the Company cannot be held responsible for any omission, mistake nor for any loss or damage including without limitation to any loss of profit which may arise from reliance on any information supplied by Signal Centre.

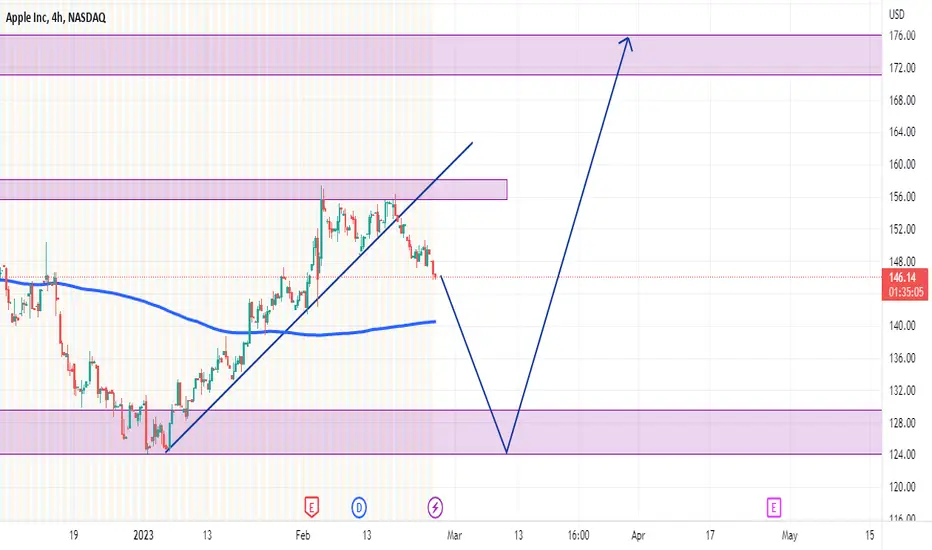
AAPL's next target is $176.40
The short-term resistance for AAPL is at $157.40, and the current market is very close to it after experiencing an uptrend. The market sentiment is bearish, but as others fear, I am greedy. Although there is a need for adjustment in the market, the probability of AAPL continuing to rise and break through in the future is higher. Short-term profits can be taken, but the view of being bullish on AAPL in the medium and long term remains unchanged.
Personal suggestion: Continue to enter the market for long positions near $150, with a target of $176.40 and a medium to long-term layout. It requires a certain amount of capital pressure resistance and a good mentality. I will continue to update my views on AAPL in the future, please stay tuned.

here an idea about APPLEhi every one
this is how is apple chart look like for me and i wan to know your idea too
The information provided on this Page does not constitute investment advice, financial advice, trading advice, or any other sort of advice and you should not treat any of the website's content as such. this page does not recommend that any cryptocurrency should be bought, sold, or held by you. Do conduct your own due diligence and consult your financial advisor before making any investment decisions
AAPL pulls back, back to bearish move?$AAPL pulls back along with the market, just before President Biden speaks. on top of the power hour few minutes before the market close. aapl release
a news about laying off their contractors as part of mass tech layoffs. if you notice lately, most of the tech layoffs sometimes make positive effects on
company stocks. making it to bounce up from the bad news. In 1hr chart AAPL is entering the squeeze momentum. and it looks like it will continues to
pulls back tomorrow depending on the market conditions volatility.
AAPL average price move per day is $3 TO $4 per day depending on market volatility and catalyst.
Below is the price level I'm looking for entries and exit for AAPL
Buy call above 153.97 and sell at 155.49 or above
Buy puts below 152.59 and sell at 151.49 or below
make sure that you set up alerts on those key level so you wont miss the move.
and always to take your profits as you see one.
Another honorable mentions for bearish setups are semis:
$AMD , $QCOM, $TSM and $META

Apple -> New All Time Highs ComingHello Traders,
welcome to this free and educational multi-timeframe technical analysis .
Over the past couple of weeks Apple stock had a quite nice pump towards the upside, again rejecting a massive weekly previous support zone , so this recent rally was definitely not unexpected.
Currently we are quite overextended towards the upside and also retesting a resistance zone ; therefore I do expect a short term retracement but then the longer term continuation towards the upside.
From a daily timeframe I am now just waiting for a retest of the next support area from which we could then definitely see the next impulse towards the upside.
Thank you for watching and I will see you tomorrow!
You can also check out my previous analysis of this asset:

AAPL - Dont catch the falling KnifeThis is not an investment advice, please do your DD.
I think we are doing 2000 and 2008 again with a little twist. I expect a selloff until sometime in late February to mid March before we have a relief rally. A lot of people will say we have bottomed then but I think the real bottoming will be around November and that is probably when the fed will do its first rate cut as "inflation will no longer" be a problem. This will lead nicely to the election year and provide the catalyst for a new rally in all markets, crypto included (bitcoin halving in march 2024 or so) and will last for another 6 years before the final crash in all assets. Crypto, stocks, housing you name it will crash probably worse than 2008. The fed will step in again and will print the USD into oblivion but this time stimulus checks will be sent to your crypto wallet via US CBDC.

AAPLTraders with naked Eyes only, Most of us thinks stocks can ripped. But I think we must leaRn more on how Charts works .
I just Visualize this Stocks in Future. Follow for more. Come and Check me out.
Trade or Buying shares in the longterm is fine. you dont need to be Good on charts. Holder always win in the next5-10 years.
If you like my Ideas Give a like or COmment if you have suggestions.
Thank you all for the love and more followers to come.

Apple Breaking to Resistance?This is a weekly chart of Apple (AAPL) as measured relative to the S&P 500 ETF (SPY).
The chart has been arbitrarily adjusted in magnitude (x1000) to improve visibility of price movement.
One should always analyze an asset's performance relative to the performance of the broader index before choosing to invest. If an asset is underperforming the broader index, one would be better off just investing in the broader index than investing in the underperforming asset.
Few people may have known that, under the surface, Apple has been resisted downward since August 2020 in its chart relative to SPY. In other words, this means that since August 2020, even though the price of Apple has gone up it has generally not outperformed the SPY.
This weekly relative chart between Apple and SPY shows that Apple may be attempting a breakout relative to SPY. Even though Apple's charts look somewhat weak on the higher timeframes (3M, 6M, 12M), this chart may suggest that Apple will at least attempt a breakout in its performance relative to the SPY. The weekly candle closed above the resistance line, and the Stochastic RSI oscillator is showing strong upward momentum on the weekly timeframe. Additionally, the weekly exponential moving average (EMA) is creating an ascending triangle pattern with the resistance line (not shown on chart). In 75% of cases, an ascending triangle is a continuation pattern, which in the context of Apple would mean a bullish breakout.
It's important to realize that relative price charts like this do not necessarily predict price action. In other words, since this is a relative chart, Apple may break out in this chart, and yet its price actually falls. This can happen if the SPY is falling faster than Apple. The best time to use this kind of chart, therefore, is when you think the SPY has made a significant bottom and will rise. Rather than investing in the SPY as its price rebounds, why not amplify your returns by investing in an asset that is likely to outperform the SPY?
Some consider this a "seeking Alpha" approach. Alpha is a term used in investing to describe an investment strategy's ability to beat the market. Strategies that are able to generate greater alpha (or return relative to the market), without introducing greater risk to your portfolio will increase your Sharpe Ratio. In this case, Apple is slightly more volatile than SPY and therefore introduces slightly more risk than owning SPY. One can mitigate this by analyzing all of one's portfolio holdings relative to SPY and selling an underperforming asset that is also more volatile than SPY and then purchasing an asset, (like Apple), that is likely to outperform SPY and which is equally or less volatile than the sold asset.
For example, compare the below charts of T-Mobile US (TMUS) and Verizon (VZ). Both charts are quarterly charts (3-month charts) and are relative to SPY. Relative price action for the past 10 years is shown. (Neither chart is adjusted for dividends). Although TMUS is slightly more volatile, it is generally in line with VZ. If given the choice between the two, which would you rather add to your portfolio?
T-Mobile US (TMUS) trending toward infinity relative to SPY:
Verizon (VZ) trending toward zero relative to SPY:
Not investment advice.

GOING LONG IN AAPLBullish Indications (BIASED LONG)
1. Morning Star Formation at the Point D
2. Bounced back from major support which was tested before 2 times
3. Bullish Divergence
4. Bullish AB=CD Pattern found
5. Price will go up for correction
Bearish Indications
1. Lower Highs and Lows
2. Price will continue its bearish trend if it breaks the support level

AAPL - Apple is re-testing a trendline from 1980This trendline has acted as resistance since 1980, broke through in Feb 2020 and now re-testing it today. This could always fail but this is such an amazing trendline for support I would take this long any day.

AAPL short term bounce wolfe wave setup into TuesdayThere is a wolfe wave setup on the 78 min time frame. Keep in mind that there is no official BUY Entry that triggered. The projected target is calculated by extending a linear line between pivot 1 and 4 and projecting the line. This is represented as the green perforated line, as shown in the chart. The projected target is 230 which coincides with the 6 day ma. The ETA , May 23, 2023, is defined by identifying the apex of the wolfe wave and projecting a vertical line toward the green perforated projection line which is the line that extends from left to right. If aapl fails to rally back above the 6 day ma $140, then expect more weakness to follow thru for another 52wk low attempt.

AAPL Bearish Setup signals caution with support levels in play$AAPL The wolfe wave indicator is increasing in popularity as we continue to see more people using it and enjoying the results. The monthly chart of AAPL is raising some eyebrows about how the market will perform in December 2022 and 2023. Typically post midterms, the markets are generally strong into 2023 and the average ROI% is 15% if aggregate the past 15 years of post midterm election performance. Along side with TESLA, the same bearish wolfe wave started developing in January 23,2022. Apple is a company that is known to be one of the largest companies in the world by market cap. And if it breaks 150 and sells off, the entire tech sector sells off with it exponentially. Wolfe waves are great in detecting when a stock enters in bull or bear markets. It removes irrational exuberance and allows the trader to focus price and volume which are the main ingredients in determining momentum. And until the stock price can trade above 155 and close above it for the month of November, then the monthly candle will likely follow thru and aapl could end up retesting it's previous 52wk $183 which would be a double top. At this point in time, I think aapl may be able to rally back above 155 and retest the previous 52 wk high into Christmas rally and January effect. Keep in mind this is a monthly candle so the timing is much different than an intraday analysis. Compare the monthly charts between tsla and aapl and you will see some similarities which will help guide you on your next trade entry, exit or DCA.

AAPL weekly 5 wave uptrendEntry 157.89
SL 133.37
AAPL weekly 5 wave uptrend I think we will go higher.
