Aaplshort
short AAPL @ 30 min @ trading capability for this 1st week `17This is only a trading capability - no recommendation !!!
Next week i`ll confirm or change my opinion about this SetUp :)
Buying/Selling or even only watching is always your own responsibility ...
Best regards
Aaron

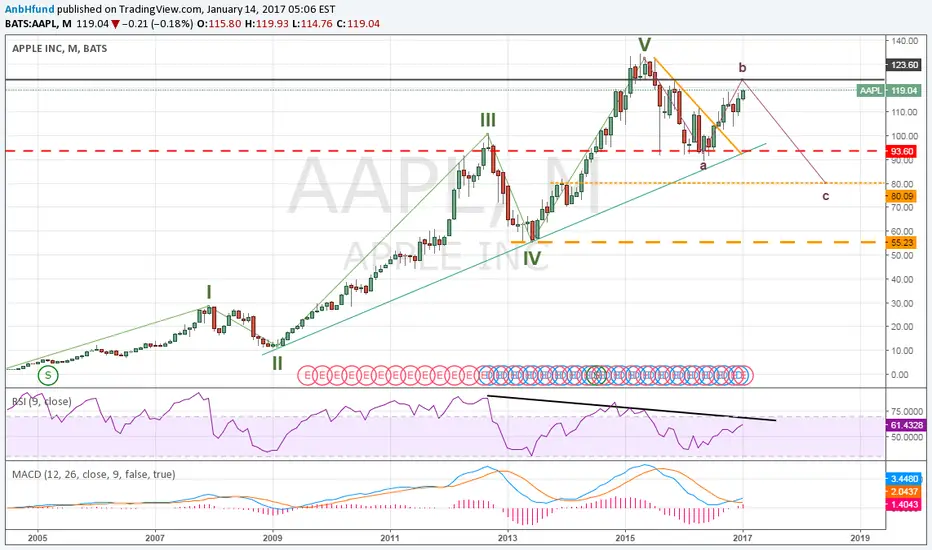
APPLE @ Daily @ Basic Scenarios after all-time high 2015Main DownSide Trend - 132.84 (2015/07/20) & 123.60 (2015/11/04) - BreakedUp 2016/08/01
The question i am asking myself is: "Are all bearish formation are processed - and be left behind ???"
the SellOff day in August`15
the selling pressure in january`16
the trendreversal in hune`16 & july`16
the DownSide Gap in may`16 & august`16
From there the actuallity TradingBox is essential - for higehr prices !!! `Cause it confirms only waht iam trying to explain. How ever, i am thuiking the chart speaks for itself. A good price action above 112.52 & 108.13 while the next 5 trading days next week should animate more traders to except a better development again - and even as consequence create a new upside trend into 123.79 & 119.94 at least. Before it again goes to 134.63 at least (even all-time high) and higher !?
But don`t get euphoric !!!
I am personally pretty neutral, `cause this autumn we`ve got a sideway trend under the dash ...
Only when AAPL trade this week above the TradingBox (112.52 & 108.13) this week - so in the next 5 days - i`ll get long again probably :)
Take care
& analyzed it again
- it`s always your decission ...
(for a bigger picture zoom the chart)
Best regards
Aaron


APPLE OR APPLTRIANGLE PLAYING OUT. break may happen either side. GO SHORT WHEN RED LINE TOUCHES WITH STOP LOSS. Buy when price touches Green line (one lesser degree from 2004 support line), so plan to dump when needed. Go deep short if it fails to break the ultimate red line from the 2015 top. Using options strategy carefully.


AAPL Chart Update: Breakout to Downside just Hit this WeekApple Inc finally breaks out to the downside after a very weak last week, prices could see the $70 area medium term. Refer to older post below for more details.


AAPL Breakdown (Finally)My last call on AAPL was a fakeout, this is in fact is an actual confirmed breakout after a fully consolidated flag patterm, simply get short and have a tight stop as instructed on the screen with the color coordinated boxes
