Important Update on US Government Lawsuit Against AppleThe recent US government lawsuit against Apple has sent shockwaves through the stock market, causing many traders to reevaluate their investments in the tech giant. The lawsuit alleges that Apple has engaged in anti-competitive behavior by restricting competition in the App Store, potentially harming consumers and developers alike.
As traders, it is important to proceed with caution in light of this lawsuit. The outcome of this legal battle could have significant implications for Apple's future profitability and market value. Until there is more clarity on the situation, it may be wise to hold off on investing further into Apple.
It is crucial for traders to carefully monitor the developments of this lawsuit and consider the potential risks involved in holding Apple stock. By staying informed and making informed decisions, we can protect our investments and navigate this uncertain time in the market.
In conclusion, I urge all traders to exercise caution and refrain from investing in Apple until more information is available regarding the US government lawsuit. Stay informed, stay vigilant, and protect your investments.
Aaplshort

AAPL Drops Below $174 to $177.50 Support ZoneAAPL continues to show weakness by dropping below the light blue support zone for a second time. AAPL is trading below support and there is likely to be a short-term rebound here. I would look for a bounce around $165 to $168.

AAPL Feb 18th UpdateNo change here, AAPL is on its way down into a H&S breakdown with an ideal target 163.35. That will be also a test of the downtrending support.
When tested we should see a multi-month rally into a larger H&S on daily level. The long-term outlook isn't bright for Apple. I dont want to be long AAPL if we wont above 205-210 next year

AAPL Technical Analysis and Trade IdeaRecent rallies in AAPL have stalled, with the 1D chart indicating a possible bearish shift.
Key observations:
- Market Structure Break: A clear break of market structure to the downside, including a lower low followed by a lower high, signals a potential downward trend.
- Fibonacci Retracement: Price action has retraced to the crucial 61.8% - 78.6% Fibonacci zone. This area often acts as a strong support or resistance level.
- Trading Strategy: Consider short entry points within the Fibonacci optimal entry zone throughout February and March. This offers a short-term opportunity with a stop-loss placed above the previous high. Target the previous downswing low as a potential profit-taking point.
Additional Considerations:
Macroeconomic Factors: Stay informed about broader market conditions and news that could impact AAPL's price.
Disclaimer: This analysis is for informational purposes and not financial advice. Always conduct your own research and risk assessment before trading.

AAPL Feb 8th H&S is in progressNo change in AAPL world, H&S setup is in progress
Looking for 164-163 level to hit in Mar

AAPL Feb 5th B earish H&S setup updateSharing #AAPL update from TTR
AAPL H&S setup here. Today’s high is testing the weekly resistance. If it can’t close above and gap above it tomorrow, it’s a very negative price action to me.
The main H&S target is at 164.50-162
RSI is below 50, as well as MACD is below 0

AAPL Short: ATH, multiple Fibonacci Resistances and wave 5 endsThis is my detailed analysis of AAPL and it is a strong Sell for the following reasons:
1. End of multiple wave 5s.
2. Triple Fibonacci targets reached.
3. Wave 4 as a triangle confirmed the 1 year move up as the last wave.

🍎Apple🍎 is Ready to Fall at least ➖5%🍎 Apple is moving in the 🟡 PRZ (Price Reversal Zone) 🟡.
💡If we look at the last 4-5 Apple candles in the daily time frame , we can see some Bearish Reversal Candlestick Patterns at the same time: Evening Star Candlestick Patten, Shooting Star Candlestick Pattern, Bearish Harami Candlestick Pattern.
💡Also, another sign of the end of this upward rally can be shown to us by the Stoch RSI indicator .👇
🔔I expect Apple to have a bearish trend in the coming days and at least fall to the 🟢 Support zone($182.95_$181.30) 🟢 and fill all the 🔵 Gaps 🔵.
Apple ( AAPLUSD ) Analyze, Daily time frame⏰.
Do not forget to put Stop loss for your positions (For every position you want to open).
Please follow your strategy; this is just my Idea, and I will gladly see your ideas in this post.
Please do not forget the ✅' like '✅ button 🙏😊 & Share it with your friends; thanks, and Trade safe.

Apple starting to look toppish....time for a pull back?Just got a "Sell Alert" from my customer SSG Indicator on Apple. Last 2 times this happened we saw the price quickly pull back into the direction of the 100 days EMA.
Looking actually to trade this by short-selling Calls with with a strike of 200 that expire in 1 month. However, due to Thanksgiving I expect that the volatility is not going to be very high on a friday, thus I will see later if I can get a decent premium for the risk.

AAPL's Overbought Indicators Hint at Possible CorrectionCurrently, Apple Inc. (AAPL) shares are presenting intriguing signals for discerning investors. Two key technical indicators, Stochastic RSI and MACD, provide indications that AAPL may have reached a point of overbought conditions.
Stochastic RSI, serving as a measure of market saturation, highlights AAPL's overbought condition, suggesting that the price has likely reached a level prone to correction or decline. Furthermore, MACD shows negative divergence, indicating the potential weakening of the upward momentum in prices.
It is essential to direct attention to the Support and Resistance level (SNR) around 182.34. This level not only boasts a strong history as a previous resistance level but may also play a significant role as a support level.
However, it is crucial to bear in mind that trading always involves risk, and trading decisions should be based on comprehensive analysis and well-calculated risk assessments.


AAPL Bulls Celebrating Too Early 👀NASDAQ:AAPL
Just a range breakdown and retest imo. Daily demand below. Expecting a one more low before a bounce. Bulls needs to hold that demand or 150 gonna come fast.

AAPL Downgraded by KeyBanc: Weak Sales Outlook Raises ConcernsIntroduction:
In a recent development, KeyBanc has downgraded Apple Inc. (AAPL) due to a concerning weak sales outlook. This downgrade has sent shockwaves through the market, prompting traders to reevaluate their positions and consider potential shorting opportunities. In this article, we will delve into the reasons behind the downgrade and discuss why traders should exercise caution when dealing with AAPL.
Understanding the Downgrade:
KeyBanc's downgrade of AAPL stems from their analysis of the company's sales outlook. They have identified certain factors that indicate a potential decline in sales, thereby raising concerns about the stock's future performance. As traders, it is crucial to pay attention to such expert opinions and assess the potential impact on our investment strategies.
Reasons for Weak Sales Outlook:
Several factors contribute to the weak sales outlook for AAPL. KeyBanc highlights the following key concerns:
1. Slowing iPhone Sales: The iPhone has been Apple's flagship product, accounting for a significant portion of its revenue. However, KeyBanc predicts a potential slowdown in iPhone sales due to market saturation and intense competition.
2. Trade Tensions: The ongoing trade tensions between the US and China have the potential to disrupt Apple's supply chain and negatively impact its sales. Any escalation in these tensions could further hamper AAPL's growth prospects.
The Call-to-Action: Consider Shorting AAPL with Caution
Given the weak sales outlook and KeyBanc's downgrade, traders should approach AAPL with caution. While shorting AAPL may present an opportunity for profit, it is essential to consider the following factors:
1. Conduct Thorough Research: Before initiating any short position, conduct comprehensive research to understand the potential risks and rewards associated with shorting AAPL. Analyze the company's financials, market trends, and competitor performance to make informed decisions.
2. Diversify Your Portfolio: Shorting AAPL should be part of a well-diversified investment strategy. Avoid placing all your bets on a single stock, as this can expose you to unnecessary risks. Diversification helps mitigate potential losses in case the market responds differently than anticipated.
3. Monitor Market Sentiment: Keep a close eye on market sentiment and news updates related to AAPL. Any positive developments or changes in the company's outlook can quickly impact stock prices. Be prepared to adjust your trading strategy accordingly.
Conclusion:
KeyBanc's downgrade of AAPL based on the weak sales outlook highlights potential challenges for the company in the near future. While shorting AAPL may offer profit potential, traders should exercise caution and conduct thorough research before making any investment decisions. Diversification and monitoring market sentiment are essential for managing risks effectively. Stay informed and adapt your trading strategy accordingly to navigate the uncertainties surrounding AAPL's future performance.

AAPL - AnalysisAAPL
Time for correction?
W1 – A triangle pattern may form. If this changes the direction of the trend, we could see a move towards the lows to 123.61 in the longer term.
The grounded option is a correction, and we see the price moving towards the level of 156.87. If the price retests the level of 171.22, then the road to a fall is open.
What can you expect?
Movement to the levels 168.24 - 156.87 - after breaking through the boundaries of the triangle.
Short
Goals – 168.24 – 160.64 – 153.69
Long-term (retest required) – target values 156.87 – 145.08 – 123.61.
Long – will be revised if the situation changes

$AAPL: Top or Not?Is this a top or just a sideways correction to pattern out excessive price gains that are above current fundamentals?
This is the big question when studying stocks right now.
NASDAQ:AAPL is definitely not a sideways trend right at the moment, but is it a downside run after a top? What is missing? There are 2 lower highs BUT just ONE lower low.
To confirm a Top, you need the second lower low. AAPL doesn't have 2 lower lows at this time. The recent low is slightly higher than the previous first low.
So selling short has high risk for AAPL at this time. Resistance for swing trades is at the red lines, which are the highs of each minor gap down.

Don't Buy Apple(AAPL) NowTechnical Analysis:
- As you can see in our daily chart, we expect that AAPL continues to do a correction
- H1& H4 right side is turning down
Technical Information:
- Don't buy AAPL now in short term
- Wave W in red can be a short term buy opportunity when it's completed

AAPL Rounding Top - Monthly - BEARISH?AAPL forming a ROUNDING TOP on the MONTHLY chart? Could be a macro bearish reversal for this giant before it grows again?
Or will it simply fall to the 150 range and continue bouncing upwards on that yellow trendline?
I am BEARISH in the short to mid-term. The whole market will turn over giving the global macro conditions as well as piling national economic conditions.
AAPL has broken down below it's bullish trendline after an amazing 2023 run. It has bad sentiment right now and has also formed a DIAMOND REVERSAL PATTERN on it's DAILY / WEEKLY.
I think the whole market is in for a downtrend as we head into Q3 / Q4, and the downtrend begins with A for AAPL. It's what props the market up and it will be what drags it down as well
Let me know your thoughts

Apple Moving Lower for LongerAPPL (1D) - Quick Analysis
Price Chart
Apple's price action has filled it's August gap (White Dotted) and turned lower pushing past the 12, 26, and 50-day EMA's in one swoop. Both RSI and OBV have created trend lines (Yellow Solid) that the indicators look to be respecting with failed retest; as RSI is on the verge of pushing below the 50 level.
What Seems Legit?
This bad boy finally cooling off. It's up 60% YTD. First retest it's 200-day EMA then retest it's major trend line and some good chaos in-between.
Check us out on Twitter for charts not posted here, memes, and news that that doesn't make the news
Chart Key
Yellow Solid = Trend Line
White Dotted = Gap Fill
Green Boxes = Supports / Target Areas

AAPL 200$Wyckoff Distribution.
Apple not delivering good stuffs this year.
They only repurchase their stocks by using their cash on hand.
Im expecting 200$ high of apple.
If this idea works , then we see a decline on others stock too.
Trade at your own decissions

Short Trade in AAPLApple has been a top performer all year. The uptrend has been a thing of beauty – steadily marching higher since January.
But that ride is over. The stock fell 10% in a week and still failed to attract buyers. It finally broke down last week before reversing higher.
But that rally failed. And AAPL is again breaking through short-term support.
Traders may consider selling short AAPL stock here in a bet that it will go lower still. This is a very low-risk trade since you could place a buy stop at $182 and risk less than 3% on the trade.
Given the high price of the stock, it may be easier to simply buy a put option, like the AAPL $175 put that expires on October 20.

AAPL is toast - full analysis short tradeOur job as traders is not to predict. It is not to guess. Our job is to INTERPRET the market action.
Apple, at least in my opinion, is showing very obvious signs that the party is over and institutions are dumping the stock.
Here is my quick 10-minute analysis of why AAPL is a short here, along with a simple option trade and how you can spot similar setups in the future.

$AAPL , further downside possibleWe have a meaningful trendline break using log scan close only line chart , support further below

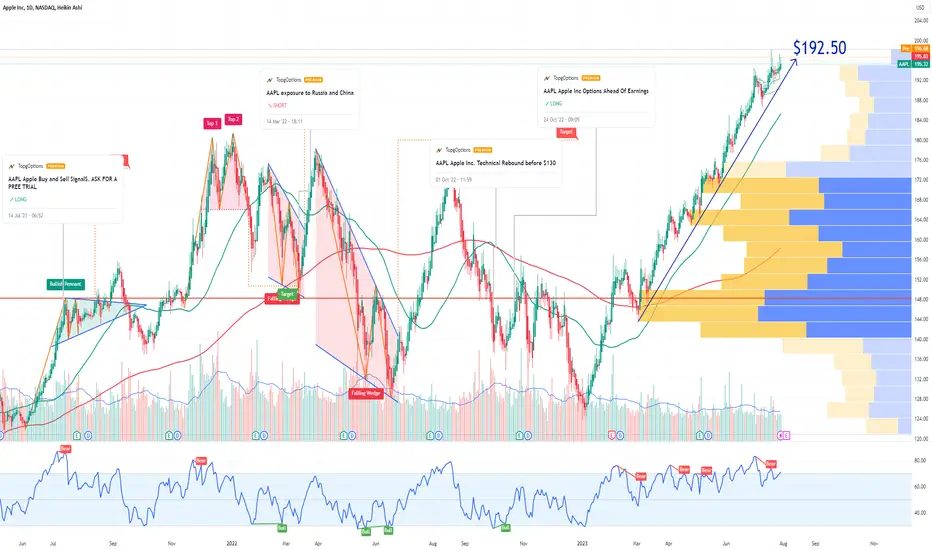
AAPL Apple Options Ahead of EarningsIf you haven`t bought AAPL here:
or shorted its exposure to China:
Then entered the Technical rebound:
Now analyzing the options chain and the chart patterns of AAPL Apple prior to the earnings report this week,
I would consider purchasing the $192.50 strike price Calls with
an expiration date of 2023-8-11,
for a premium of approximately $6.05.
If these options prove to be profitable prior to the earnings release, I would sell at least half of them.
Looking forward to read your opinion about it.