AAVE ROADMAP (D)AAVE has confirmed the previous idea. It's clear that the entire pattern goes in a correction mode named as "triple zig-zag".
Sadly, AAVE will not be recovering from here any time soon.
As long as price stay below $206, the fate of AAVE shows a major signal through downside.
That entire wick from the last flashcras will be filled entirely.
Aave

AAVEUSDT 1,608% profits potential with 6X leverage —LONG tradeWhen one project turns bullish, all the other projects also turn bullish. It wouldn't be reassuring to see two or three projects turn bullish while all the others are bearish... Not a bullish chart but bullish potential.
AAVE is trading within a triple bottom. See a blue line on the chart. Each time this support zone gets tested there is a bullish reaction. We are going to bet on this same dynamic being repeated again.
The main target for this move is the December 2024 high. The end result can be higher or lower, but we are bullish nonetheless.
Trading volume is very low with a flat bottom. There is potential for growth.
Full trade-numbers below:
_____
LONG AAVEUSDT
Leverage: 6X
Potential: 1608%
Allocation: 8%
Entry zone: $130 - $158
Targets:
1) $175
2) $196
3) $233
4) $269
5) $320
6) $386
7) $458
8) $503
9) $575
Stop: Close weekly below $130
_____
How long do you think it will take for a new bullish move to show up, days or weeks? Months?
Thank you for reading.
This is a good chart setup, another one.
Namaste.

AAVE Hidden bearish divergence on the daily playing outEURONEXT:AAVE
🎯 The path from last week’s analysis is being followed, so far. Price printed a bullish engulfing candle breaking above the daily pivot, but was ultimately rejected at the R1 pivot, now testing the daily pivot and High Volume Node as support. The downtrend is intact. The first target for continued upside is the daily 200EMA and High Volume Node resistance at $210. Overcoming the daily 200EMA will add confluence to a major bottom being in. Wave (C) of triangle wave (D) appears to be underway.
📈 Daily RSI printed hidden bearish divergence which is playing out.
👉 Analysis is invalidated if we drop below $148, keeping wave (B) alive.
Safe trading

I took a speculative position in AAVE on a small amount.CRYPTOCAP:AAVE #AAVE
I took a speculative position in AAVE on a small amount.
Stop loss at $160.59.
Take Profit: $229.00
It's one of the top-5 coins in the DeFi sector:
dropstab.com
Looking at the liquidations, they swept a bunch of important long traders' stops.
Let's see how this trade plays out.
Snapshot:

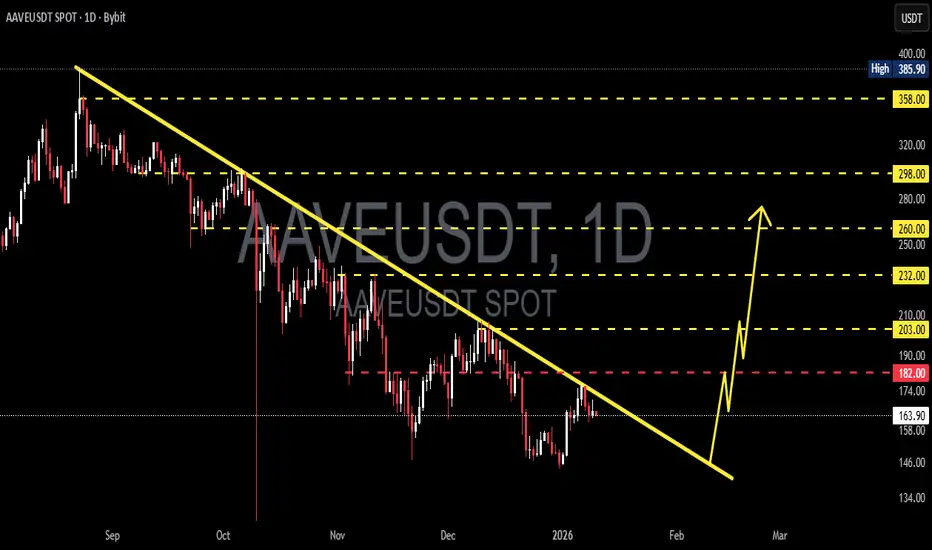
AAVE/USDT – Major Downtrend, Breakout or Another Rejection?On the daily timeframe, AAVE/USDT is still moving within a bearish market structure, with consistent selling pressure since the price peaked near the 385 USDT area. Price is currently trading below a descending trendline, which acts as a major dynamic resistance. As long as price remains below this trendline, sellers remain in control.
---
Chart Pattern (Pattern Explanation)
AAVE is forming a Descending Trendline (Bearish Structure), characterized by:
A series of lower highs since September
Multiple rejections along the descending trendline
Upward moves that appear corrective rather than impulsive
This pattern indicates that every rally is still considered a pullback unless a confirmed breakout occurs.
---
Key Levels
Resistance Levels:
182 USDT (minor resistance / rejection area)
203 USDT (mid resistance)
232 USDT (strong resistance)
260 USDT
298 USDT
358 USDT (major resistance & previous high)
Support Levels:
158 USDT (nearest support)
146 USDT (key support)
134 USDT (critical support, potential continuation to the downside)
---
Bullish Scenario
The bullish scenario becomes valid if:
Price breaks above and closes above the descending trendline
Followed by a successful break and hold above 182 – 203 USDT
Bullish targets:
203 USDT
232 USDT
260 USDT
298 USDT (extension target if momentum strengthens)
A valid breakout could signal the end of the bearish structure and open the door for a medium-term trend reversal.
---
Bearish Scenario
The bearish scenario remains dominant if:
Price gets rejected again at the descending trendline
Fails to reclaim the 182 USDT area
Breaks down below the 158 USDT support
Bearish targets:
146 USDT
134 USDT
A breakdown below 134 USDT would strengthen the case for a bearish continuation with increased selling pressure.
---
Conclusion
AAVE/USDT remains in a bearish trend, with the descending trendline acting as the key decision zone.
Trendline breakout → potential reversal
Rejection → bearish continuation
Waiting for clear confirmation is crucial before entering any position, supported by proper risk management.
---
#AAVE #AAVEUSDT #CryptoAnalysis #TechnicalAnalysis #Altcoin #Downtrend #BearishMarket #BullishBreakout #CryptoTrading #DeFi #PriceAction
AAVE Short-term analysis | Trading and expectationsCRYPTOCAP:AAVE
🎯 Price printed a bullish engulfing candle from daily RSI bullish divergence and High Volume Node support. It is currently testing the pivot. Overcoming this will add confidence to the bullish move, with a first target of the daily 200EMA and High Volume Node resistance at $220. Overcoming the daily 200EMA will add confluence to a major bottom being in.
📈 Wave (C) of triangle wave (D) appears to be underway. Daily RSI sits at the channel EQ and is crossed bullishly.
👉 Analysis is invalidated if we drop below $148, keeping wave (B) alive.
Safe trading

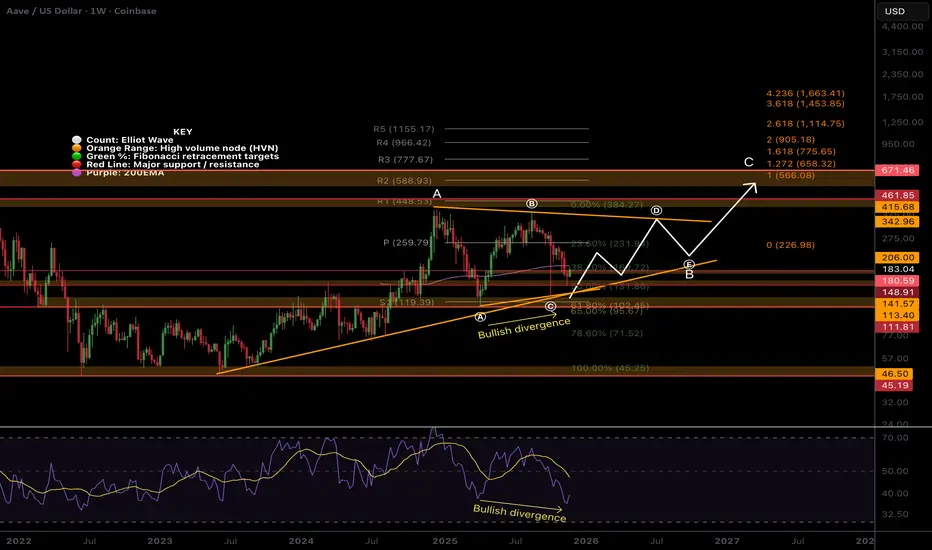
AAVE - Macro analysis | The bigger picture | Long-term holdersEURONEXT:AAVE
🎯 I am still looking at this multiyear triangle to break out to the upside with a terminal target of $670, the all-time High Volume Node resistance. Price is rangebound between $440 and $130 and appears to have completed triangle wave (C). Wave (D) is next, with a target of the upper boundary trend-line ~$340.
📈 Price is below the weekly 200EMA and pivot, reflecting the recent bearish trend, but finding support with bullish divergence in the RSI, suggesting a major bottom is forming. Wave (A) found terminal support at the golden pocket Fibonacci retracement.
👉 Analysis is invalidated below wave (A) or wave (B). This asset has been one of the best assets for trading signals in the last 3 years, sticking to the rules strictly.
Safe trading

TradeCityPro | AAVE at Key Support, Waiting for Trend Trigger👋 Welcome to TradeCityPro!
In this analysis, I want to review the AAVE coin for you. One of the popular DeFi projects, which with a market cap of $2.52 billion, is ranked 36th on CoinMarketCap.
🗓 Daily timeframe
On the daily timeframe, AAVE started a downtrend after stabilizing below the 261.98 zone, and with the bearish structure it had, it dropped down to the 144.61 level.
🎲 There is a support zone between 144.61 and 157.43, which the coin has currently been supported from, and it could start its upward move from this area.
✨ The main resistance that price is currently dealing with is 202.53, and as long as price does not stabilize above it, a bullish trend will not begin.
🎯 So, for a long position or spot buying, the trigger we have on this coin is 202.53.
↗️ However, if the downtrend continues and a lower high below 202.53 is formed, we can open a short position with the break of 144.61.
⚡️ The next support that AAVE currently has is 124.79, and price could drop to this zone in the next bearish leg.
📝 Final Thoughts
Stay calm, trade wisely, and let's capture the market's best opportunities!
This analysis reflects our opinions and is not financial advice.
Share your thoughts in the comments, and don’t forget to share this analysis with your friends! ❤️

AAVE - USDT TP2CRYPTOCAP:AAVE TP2 hit ✅
Green zone acting as support but a breakout under 145$ could lead to another 20%+ sharp dump!
Remember --> Next key level is around 114 - 110$! 🎯

AAVE - BEARISH OUTLOOK CRYPTOCAP:AAVE - Bearish Breakout Awaited!🚨
Medium term outlook = pretty bearish 📉
Chart looks pretty bad, with a potential support breakout & a 15% dump ahead!
Lower supports:
134− 125 - 112− 100
My bias:
Slow correction toward the following supports, likely $ 100 zone will act as long-term bottom 📉
110 - 115$ level could also act as double bottom on the weekly basis! 🎯
Bear Invalidation:
185, 200 resistance & daily uptrend resistances.
⚠️ Not financial advice - DYOR.

AAVE: The Squeeze Is OnWe're watching a textbook compression pattern on AAVE—price trapped between ascending support at $173.25 and descending resistance at $198.53. These narrowing wedges don't last forever. The question isn't if it breaks, it's which direction and how violently. Current price: $175.48.
1. THE TECHNICAL REALITY 📉
• Wedge Compression: Ascending support at $173.25 (4 touches from $80.01) vs descending resistance at $198.53 (8 touches from $237.08)
• Trend Structure: Trading below all three major EMAs (20/50/200)—path of least resistance is down
• Rejection Signal: Massive 75.8% upper wick shows aggressive selling pressure defending higher prices
• Volume Context: 50% below average ($51k vs $101k)—no conviction behind bounce attempts
2. THE INDICATORS ⚖️
Bearish Signals:
• MACD bearish and diverging further negative (-1.98 vs -1.70 signal)
• ADX at 30.3 confirms moderate trend strength pointing south
• Bearish order block overhead at $193.18-$186.41 acting as supply ceiling
• Lower high structure with deteriorating momentum
Bullish Signals:
• RSI at 32 screaming oversold
• Stochastic at 16.6 in extreme territory
• Ascending trendline at $173.25 has held for months
The Conflict:
We're oversold, but oversold can stay oversold in a trending market. Weak volume means any bounce lacks conviction. The trendline is the last line of defense.
3. THE TRADE SETUP 🎯
🔴 Scenario A: Breakdown (Primary Path - 68% Confidence)
• Trigger: Rejection at $177-$179 zone (EMA20 resistance)
• Entry: Break below ascending trendline at $173.25
• Target 1: $169.36 (swing low + bullish OB top)
• Target 2: $162.19 (strong support low)
• Stop: 4H close above $193.18
• R/R: ~1:0.5 on first target, but probability-weighted favorable
🟢 Scenario B: Bullish Reversal (Alternative)
• Trigger: 4H close above $193.18 (flips bearish OB to support)
• Entry: Retest of $193.18 as support with volume confirmation
• Target: $210.36 (bullish change of character)
• Invalidation: Failure to hold $193.18 on retest
MY VERDICT
The higher probability play is watching for breakdown below $173.25 and riding it toward $169.36. We've got alignment—bearish structure, deteriorating momentum, weak volume, rejection wicks. But that ascending trendline is the make-or-break level. If it holds with a volume spike, I'd reassess quickly. Until then, the setup favors the downside.
Are you fading this oversold condition or playing the breakdown? What's your read on that $173.25 trendline?

AAVEUSD - Large Symmetrical Triangle/BullflagI interpret this as a bullflag due to earlier price action but symmetrical triangle works aswell. They are both bullish patterns.
The increase the last time this think ran up is INSANE
Wonder how it will progress
Weekly chart

AAVEUSD — SHORT IDEA (BEARISH ORDER FLOW)Price is trading at premium levels and reacting from a strong supply zone.
Buy-side liquidity has already been taken, which suggests smart money distribution.
Not financial advice. Trade at your own risk
Invalidation if price hits the target before triggering entry, as this is a more conservative entry.

Bulls Flexing StrengthHey guys, AAVE is setting up one of those textbook bullish continuation patterns that makes you sit up and pay attention.
The current price of $199.14 sits right in the equilibrium zone, perfectly balanced between premium and discount levels. What's immediately striking is the clean higher low formation that's been confirmed, with price holding firmly above all major moving averages. The EMA20 at $197.14, EMA50 at $196.87, and EMA200 at $193.39 are all stacked bullishly beneath current price, creating a support ladder that's characteristic of strong uptrends. This alignment doesn't happen by accident - it's the result of sustained buying pressure and institutional accumulation.
The ADX reading of 53.3 is absolutely critical to understanding the current market state. This indicator measures trend strength, and anything above 25 signals a trending market rather than choppy consolidation. At 53.3, we're looking at a strong, established trend that has momentum behind it. When you pair this with the MACD showing powerful bullish divergence (0.6012 vs 0.0205 signal line), the technical picture becomes crystal clear. The MACD histogram is expanding positively, indicating accelerating bullish momentum rather than a weakening trend.
The RSI at 68.7 is approaching overbought territory but hasn't reached extreme levels yet. This is actually ideal for continuation setups - we want to see strength, not weakness. The RSI has room to push into the 70-80 zone during strong trending moves, so this reading suggests we're in the middle of a move rather than at an exhausted top. The MFI at 66.8 confirms that money flow is supporting this price action, with capital flowing into AAVE rather than exiting.
From a Smart Money Concepts perspective, this setup gets even more interesting. Price is currently trading above a bullish order block that spans $196.09 to $197.71. This zone represents an area where institutions likely accumulated positions during the previous move up, and it's now acting as a demand zone. Order blocks are one of the most reliable SMC concepts because they mark areas where smart money has shown their hand. The fact that we're holding above this level suggests institutional support remains intact.
There's also an unfilled bullish Fair Value Gap sitting at $195.26-$195.54. FVGs represent inefficiencies in price action where the market moved too quickly, leaving behind an imbalance. These gaps act as magnets - if we see any pullback, this $195.26-$195.54 zone would be an ideal area for smart money to add to positions. It's essentially a discount entry point within the broader uptrend.
The bearish order block at $204.48-$199.70 represents the immediate supply zone we need to reclaim. This is where sellers previously showed strength, and reclaiming this zone with volume would be a significant bullish signal. A break above $204.48 with expanding volume would likely trigger stops and fuel a move toward the swing high at $206.80.
The market structure is showing higher lows, which is the definition of an uptrend. The recent swing low at $189.16 held firm, and the even stronger low at $186.85 provides an additional backstop. The Bollinger Bands show price trading above the middle band at $195.32, with the upper band at $202.02 within striking distance. When price walks the upper Bollinger Band in a strong trend, it often signals continuation rather than reversal.
Volume analysis reveals current levels at $19,995 versus an average of $22,867. While this is slightly below average, it's not concerning given we're in a consolidation phase. What we want to see is volume expansion as price approaches the $204.48 resistance zone. A breakout on declining volume would be suspect, but a breakout with volume above $25,000+ would confirm institutional participation. The 24h volume of $161 million shows healthy overall interest in AAVE.
The wick analysis is particularly revealing. The lower wick represents 24.9% of the candle range, while the upper wick is only 11%. This asymmetry tells a story - buyers are aggressively defending lower prices (creating large lower wicks), while sellers aren't showing the same aggression at higher prices (small upper wicks). This imbalance in supply and demand dynamics typically precedes upside moves.
For a complete trading setup, here's how I'd approach this: Entry zone is $197-199, with aggressive traders potentially entering at current levels given the strong technical backdrop. More conservative traders might wait for a pullback to the $195.26-$195.54 bullish FVG for a better risk-reward entry. The stop loss should be placed below $188.00 - a 4H close beneath the discount zone at $188.09 would invalidate the bullish market structure and break the higher low formation. This isn't just a random percentage-based stop; it's a structural level where the thesis breaks.
Target the swing high at $206.80 for TP1, which represents a 3.85% move from current levels. If we get a clean breakout above $206.80 with volume confirmation, look for extension targets at $210 and potentially $215 based on measured moves. The risk-reward on this setup is approximately 1:2.5 from current levels, which is solid for a continuation play. If entering from the FVG around $195, the R:R improves to nearly 1:4.
The confidence level on this setup is 78% - high conviction but not maximum. What keeps this from being a 90%+ setup is the slightly below-average volume and the fact that we're in equilibrium rather than deep discount. The ideal scenario would be a quick wick down to $195 on a volume spike (liquidity grab), followed by immediate reclaim and push through $204.48. That would be the textbook smart money playbook.
Alternative scenarios to consider: if price rejects hard at the $204.48 bearish order block without volume confirmation, we could see a deeper pullback to the $195.26 FVG or even the $189.16 swing low. This wouldn't invalidate the bullish thesis unless we close below $188.00. Consolidation between $197-204 for another 12-24 hours would actually be healthy, allowing the RSI to cool off slightly before the next leg up.
What are you thinking here? Are you waiting for a pullback to the FVG for a better entry, or taking the trade at current levels given the strong momentum?

AAVE in Rising Wedge Near Major Descending TrendlineAAVE is forming a clear rising wedge structure after rebounding from the lower demand zone. Price is making higher highs and higher lows, but the range is tightening, showing loss of bullish momentum as it pushes into a major descending trendline.
This rising wedge is developing against higher timeframe resistance, which increases the probability of rejection. If price fails to break and hold above the descending trendline, the structure is likely to resolve to the downside. In that case, the next key demand area sits around one sixty to one sixty five.
For the bullish scenario, AAVE must break above the descending trendline with strong acceptance and volume. Such a move would invalidate the bearish wedge structure and open the path toward the two hundred to two hundred five resistance zone.
This setup is driven by rising wedge dynamics, trendline confluence, and structure compression. The reaction at resistance will define whether price continues higher or resumes the broader downtrend.
Confirmation is essential before taking directional trades.

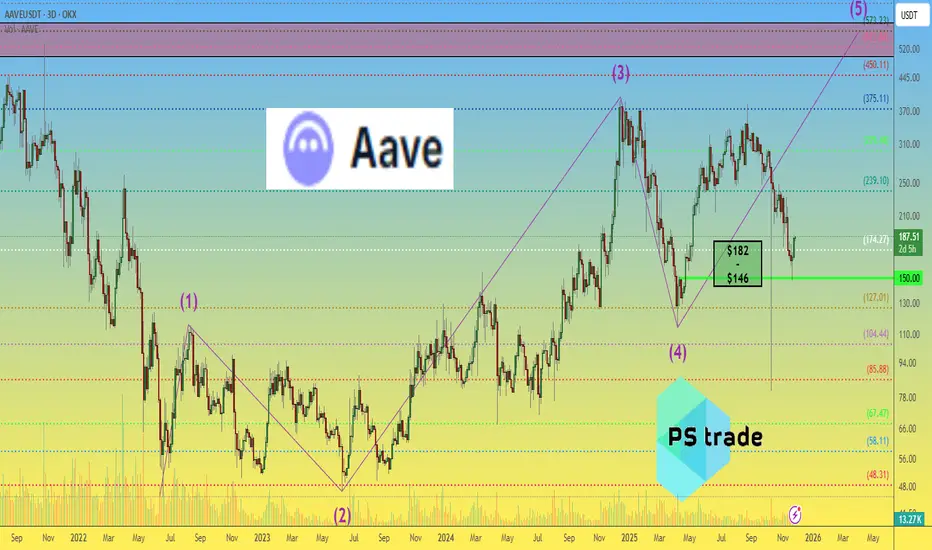
AAVE/USDT — Critical Demand Zone 135–120: Reversal Signal?AAVE/USDT (3D) is developing a highly interesting structure after delivering a strong rebound from the major demand zone at 135–120, an area that has historically served as a large accumulation region for institutional players since 2023.
The long downward wick — clearly a liquidity sweep — shows how the market wiped out stop-losses beneath the zone before snapping back upward. This kind of wick is rarely random; it often signals smart money accumulation exactly where retail traders panic.
Still, despite the sharp recovery toward 180–190, the broader market structure remains in a pattern of Lower Highs, which means the medium-term trend is still technically bearish. AAVE is now positioned at a major inflection point: Is this the beginning of a structural reversal, or only a temporary bounce before another leg down?
---
🔵 Bullish Scenario — Reversal Begins Above 205
The bullish case gains real validity only if price can break and close above the 195–205 resistance cluster on the 3D timeframe.
A decisive breakout here would mark the first Higher High in months and potentially flip the trend.
If the breakout holds, upside targets include:
Target 1: 265–305 (major supply zone)
Target 2: 380–400 (macro swing high)
Target 3: 440+ if DeFi momentum expands
Key bullish confirmations:
Increasing buy volume during the breakout
Strong 3D candle close above 205
A clean retest of 195–205 turning into support
If these align, a full trend reversal becomes increasingly probable.
---
🔴 Bearish Scenario — Breakdown Below 120
The bearish case becomes dominant if price fails to defend the 135–120 demand block and instead closes firmly below 120 on the 3D timeframe.
If that happens, the mid-term downtrend likely resumes with the following targets:
Target 1: 99–84
Target 2: 70 (previous liquidity sweep low)
Target 3: 62 if capitulation expands
This scenario would suggest that the prior liquidity sweep was not a reversal signal but rather preparation for a deeper markdown phase.
---
📌 Key Patterns & Structural Notes
Liquidity Sweep: The long wick beneath the demand zone signals wiped-out liquidity and possible institutional absorption.
135–120 Demand Block: A crucial accumulation area that currently serves as the final defense for buyers.
Lower High Structure: Trend remains bearish until 205+ is reclaimed.
Range Market: Price is currently oscillating within a broader 120–225 range; a breakout of either side will determine the next macro move.
---
🎯 Final Summary
AAVE is now at one of its most important decision zones of the past year.
Break above 205 → bullish trend shift
Break below 120 → bearish continuation and deeper lows
Until one of these triggers is activated, AAVE remains in accumulation/consolidation mode, preparing for its next major directional move. Swing traders typically wait for one of these confirmations before entering large positions.
---
#AAVE #AAVEUSDT #CryptoAnalysis #PriceAction #TechnicalAnalysis #SupplyDemand #LiquiditySweep #DeFi #Altcoins #CryptoMarket

AAVE Update🚨📊 AAVE Update
AAVE has formed a double bottom pattern,
which is normally a strong bullish reversal signal —
but we still have a red resistance zone 🔴
sitting right above the price.
This red zone is acting as a strong ceiling,
and price must break above it
for the double bottom to fully confirm and momentum to continue higher.
Until that breakout happens,
upside stays limited and sellers remain active at this zone.

AAVE price analysisAfter nearly 5–6 months of waiting, CRYPTOCAP:AAVE has reached the $146 target, followed by a constructive rebound. The brief volatility spike on October 10–11 doesn’t change the broader structure.
From a fundamental perspective, CRYPTOCAP:AAVE remains one of the more robust DeFi assets. Price stability is notable considering the complete absence of ETF-related hype — which means any future catalyst could amplify the move.
If market conditions improve, OKX:AAVEUSDT has a reasonable probability of retesting the $500–600 ATH zone.
What’s your view: is CRYPTOCAP:AAVE preparing for a mid-term trend expansion or is the asset likely to stay in accumulation?
______________
◆ Follow us ❤️ for daily crypto insights & updates!
🚀 Don’t miss out on important market moves
🧠 DYOR | This is not financial advice, just thinking out loud
AAVE Macro outlook, weekly bullish divergenceA price range between $440 and $130 continues. Price appears to have completed triangle wave (c) of a larger wave B. Wave (D) is next, with a target of the upper boundary trend-line ~$340.
Price has lost the 200EMA but followed the outlined path of a pump and pullback after wave ©. The weekly pivot is the likely termination point for wave (E), but there is work to be done first. Price found terminal support at the golden pocket Fibonacci retracement.
We are just in a huge range, and there isn’t much more to say on the macro. This asset has been one of the best winners for trading the last 3 years, sticking to the rules strictly.
🎯 Terminal target for the business cycle is still the 1:1 Fib extension, but may be overextended to the 1.272, per wave C rules. Both are around the all-time High Volume Node ~$600
📈 Weekly RSI has room to fall and has printed bullish divergence.
👉 Analysis is invalidated below wave (A) or wave (B)
Safe trading
AAVE Local, bottoming soon?Locally, price continues bearish after falling out of the wedge, completing wave (B) of the macro triangle. Price action looks ready to reverse
Wave © appears complete after the big drop, black swan event- Oct 10th. I was looking for a dip back into the long lower wick, which we have and price is finding support. This suggests we grind higher from here, but we must get through the daily 200EMA, just above the High Volume Node resistance and daily pivot. This area will be tough to crack and was rejected on the first attempt.
📈 Daily RSI has printed bullish divergence from the oversold threshold- a bottoming signal.
👉 Continued downside has a next target of $114.
Safe trading

$AAVE Long🟢 Entry : 204$ - 200$
🎯 Targets :
1) 210$
2) 215$
3) 220$
4) 230$+
🔴 Stop : 193$
📌 Do proper money management... DYOR
Buy : CRYPTOCAP:AAVE

AAVE local analysis updated, Bear trend continueEURONEXT:AAVE Locally, price continues bearish after falling out of the wedge, completing wave 1. Until the price gets above the orange descending trend-line, the probability is downside continuation.
Wave 2 appears complete after the big drop, black swan event. I was looking for a dip back into the long lower wick, which we have and price found support. This suggests we grind higher from here, but we must get through the daily 200EMA, just above the High Volume Node resistance and daily pivot. This area will be tough to crack.
The alternative count is a triangle forming discussed below, which is the (A)(B)(C) shown.
📈 Daily RSI has printed bullish divergence from the oversold threshold, which is bullish and a bottoming signal.
👉 Continued downside has a next target of $150.
Safe trading

#AAVE Bears Ready For Further Downside | Must Watch For Bears Yello Paradisers! Are you watching what’s unfolding on #AAVEUSDT right now? Because if you’re not, this could catch you completely off guard. There’s a potential bearish breakdown brewing that could send #AAVE into much deeper territory. Let’s dive in before it's too late:
💎#AAVE has been trading inside a symmetrical triangle, caught between a descending resistance and ascending support. Each test of the upper boundary has been weaker, showing fading bullish momentum. Now, we’re pressing against the lower support line with sellers gaining control.
💎The current price is $222, and we’re right on the edge. A confirmed breakdown below the ascending support will flip the entire structure bearish. The 50 EMA is now acting as resistance, reinforcing this downward pressure and aligning with the broader setup.
💎If this bearish scenario confirms, the next downside target becomes the Support Zone around $195–180, but the real liquidity lies deeper. A sharp move could easily send #AAVEUSD into the Strong Demand Zone between $133–123, where we expect stronger buyers to finally show up.
💎However, this setup is invalidated if #AAVE breaks back above the Resistance Zone at $263. That would signal strength and likely trigger a fast bullish reversal targeting higher levels above $280.
Trade smart, Paradisers. This setup will reward only the disciplined.
MyCryptoParadise
iFeel the success🌴
