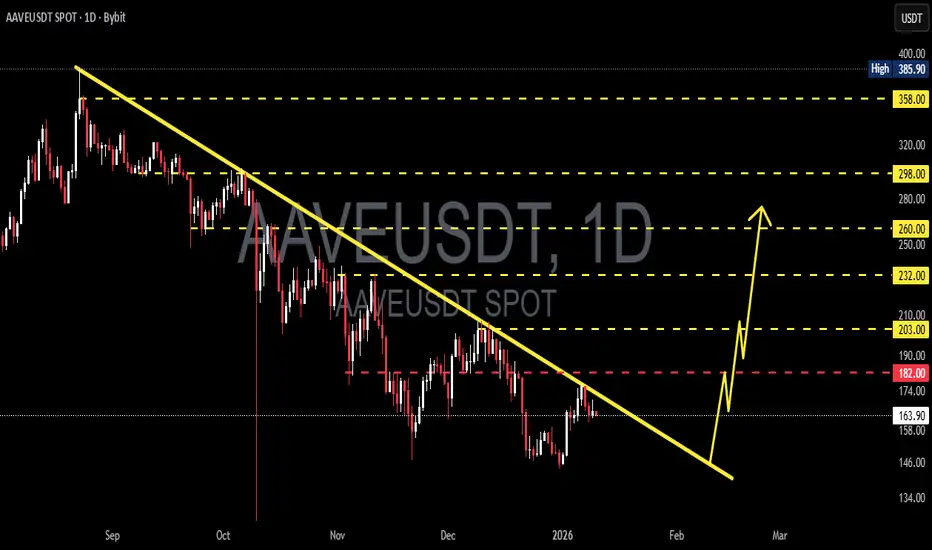
AAVE/USDT – Major Downtrend, Breakout or Another Rejection?On the daily timeframe, AAVE/USDT is still moving within a bearish market structure, with consistent selling pressure since the price peaked near the 385 USDT area. Price is currently trading below a descending trendline, which acts as a major dynamic resistance. As long as price remains below this trendline, sellers remain in control.
---
Chart Pattern (Pattern Explanation)
AAVE is forming a Descending Trendline (Bearish Structure), characterized by:
A series of lower highs since September
Multiple rejections along the descending trendline
Upward moves that appear corrective rather than impulsive
This pattern indicates that every rally is still considered a pullback unless a confirmed breakout occurs.
---
Key Levels
Resistance Levels:
182 USDT (minor resistance / rejection area)
203 USDT (mid resistance)
232 USDT (strong resistance)
260 USDT
298 USDT
358 USDT (major resistance & previous high)
Support Levels:
158 USDT (nearest support)
146 USDT (key support)
134 USDT (critical support, potential continuation to the downside)
---
Bullish Scenario
The bullish scenario becomes valid if:
Price breaks above and closes above the descending trendline
Followed by a successful break and hold above 182 – 203 USDT
Bullish targets:
203 USDT
232 USDT
260 USDT
298 USDT (extension target if momentum strengthens)
A valid breakout could signal the end of the bearish structure and open the door for a medium-term trend reversal.
---
Bearish Scenario
The bearish scenario remains dominant if:
Price gets rejected again at the descending trendline
Fails to reclaim the 182 USDT area
Breaks down below the 158 USDT support
Bearish targets:
146 USDT
134 USDT
A breakdown below 134 USDT would strengthen the case for a bearish continuation with increased selling pressure.
---
Conclusion
AAVE/USDT remains in a bearish trend, with the descending trendline acting as the key decision zone.
Trendline breakout → potential reversal
Rejection → bearish continuation
Waiting for clear confirmation is crucial before entering any position, supported by proper risk management.
---
#AAVE #AAVEUSDT #CryptoAnalysis #TechnicalAnalysis #Altcoin #Downtrend #BearishMarket #BullishBreakout #CryptoTrading #DeFi #PriceAction
AAVEUSDTPERP
AAVE can HOLD?A Good trade from here if it holds.
Entry Under 180.00 with invalidation on breaking current area.
Expecting Bullish Trend if holds here.
Note: Not a Financial Advice.

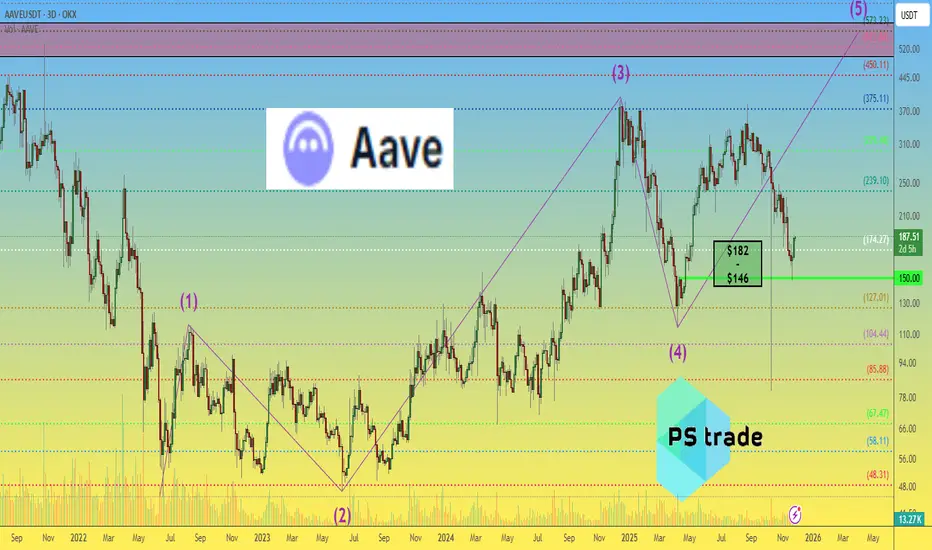
AAVE/USDT — Critical Demand Zone 135–120: Reversal Signal?AAVE/USDT (3D) is developing a highly interesting structure after delivering a strong rebound from the major demand zone at 135–120, an area that has historically served as a large accumulation region for institutional players since 2023.
The long downward wick — clearly a liquidity sweep — shows how the market wiped out stop-losses beneath the zone before snapping back upward. This kind of wick is rarely random; it often signals smart money accumulation exactly where retail traders panic.
Still, despite the sharp recovery toward 180–190, the broader market structure remains in a pattern of Lower Highs, which means the medium-term trend is still technically bearish. AAVE is now positioned at a major inflection point: Is this the beginning of a structural reversal, or only a temporary bounce before another leg down?
---
🔵 Bullish Scenario — Reversal Begins Above 205
The bullish case gains real validity only if price can break and close above the 195–205 resistance cluster on the 3D timeframe.
A decisive breakout here would mark the first Higher High in months and potentially flip the trend.
If the breakout holds, upside targets include:
Target 1: 265–305 (major supply zone)
Target 2: 380–400 (macro swing high)
Target 3: 440+ if DeFi momentum expands
Key bullish confirmations:
Increasing buy volume during the breakout
Strong 3D candle close above 205
A clean retest of 195–205 turning into support
If these align, a full trend reversal becomes increasingly probable.
---
🔴 Bearish Scenario — Breakdown Below 120
The bearish case becomes dominant if price fails to defend the 135–120 demand block and instead closes firmly below 120 on the 3D timeframe.
If that happens, the mid-term downtrend likely resumes with the following targets:
Target 1: 99–84
Target 2: 70 (previous liquidity sweep low)
Target 3: 62 if capitulation expands
This scenario would suggest that the prior liquidity sweep was not a reversal signal but rather preparation for a deeper markdown phase.
---
📌 Key Patterns & Structural Notes
Liquidity Sweep: The long wick beneath the demand zone signals wiped-out liquidity and possible institutional absorption.
135–120 Demand Block: A crucial accumulation area that currently serves as the final defense for buyers.
Lower High Structure: Trend remains bearish until 205+ is reclaimed.
Range Market: Price is currently oscillating within a broader 120–225 range; a breakout of either side will determine the next macro move.
---
🎯 Final Summary
AAVE is now at one of its most important decision zones of the past year.
Break above 205 → bullish trend shift
Break below 120 → bearish continuation and deeper lows
Until one of these triggers is activated, AAVE remains in accumulation/consolidation mode, preparing for its next major directional move. Swing traders typically wait for one of these confirmations before entering large positions.
---
#AAVE #AAVEUSDT #CryptoAnalysis #PriceAction #TechnicalAnalysis #SupplyDemand #LiquiditySweep #DeFi #Altcoins #CryptoMarket

AAVE price analysisAfter nearly 5–6 months of waiting, CRYPTOCAP:AAVE has reached the $146 target, followed by a constructive rebound. The brief volatility spike on October 10–11 doesn’t change the broader structure.
From a fundamental perspective, CRYPTOCAP:AAVE remains one of the more robust DeFi assets. Price stability is notable considering the complete absence of ETF-related hype — which means any future catalyst could amplify the move.
If market conditions improve, OKX:AAVEUSDT has a reasonable probability of retesting the $500–600 ATH zone.
What’s your view: is CRYPTOCAP:AAVE preparing for a mid-term trend expansion or is the asset likely to stay in accumulation?
______________
◆ Follow us ❤️ for daily crypto insights & updates!
🚀 Don’t miss out on important market moves
🧠 DYOR | This is not financial advice, just thinking out loud
AAVEUSDTBINANCE:AAVEUSDT is short term uptrend but in long tern have Triangle pattern for jump or dump. The price 297.40$ is key level for bullish trend so wait for break this level for buy.
🟢Resistance: 297 - 323 - 351 - 376
🔴Support: 270 - 252
⚠️Please control risk management.

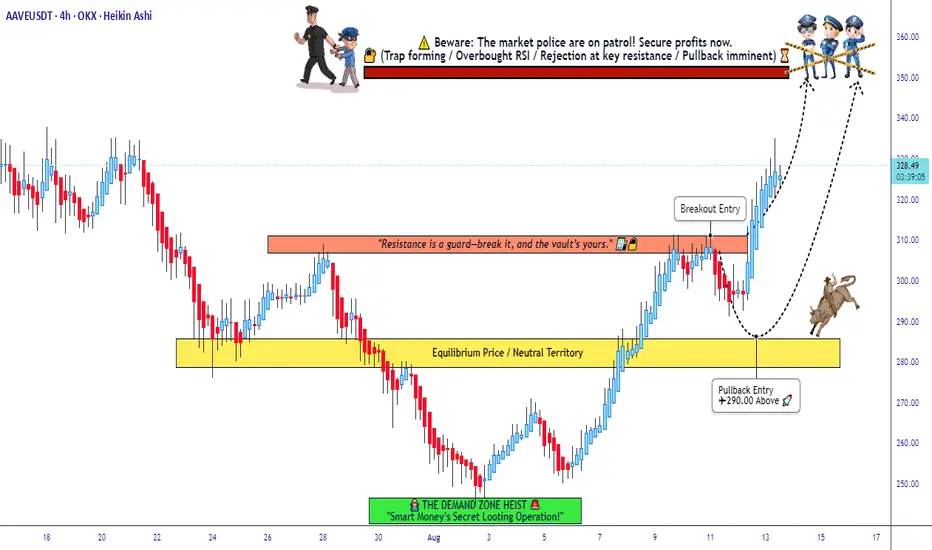
"The AAVE Heist Plan – Stealthy Entries, Big Exit!"🔥🤑 THIEF TRADER’S AAVE/USDT HEIST PLAN 🚀💰
Asset: AAVE/USDT
Plan: BULLISH HEIST 🚀📈
🎯 ENTRY STRATEGY (THIEF STYLE):
✔ BREAKOUT ENTRY: 310.00 (Aggressive heist!)
✔ PULLBACK ENTRY: 290.00 (Safe & sneaky!)
💎 THIEF’S LAYERING STRATEGY (MULTIPLE LIMIT ORDERS):
🔹 295.00 (First dip grab!)
🔹 290.00 (Second loot!)
🔹 288.00 (Third steal!)
🔹 282.00 (Final robbery!)
(Add more layers if you're a PRO thief!)
⛔ STOP LOSS (THIEF’S SAFE ESCAPE):
📍 266.00 (OG Thief SL!)
⚠ LADIES & GENTLEMEN THIEVES: Adjust SL based on your risk & strategy!
🎯 TARGET: 350.00 (Time to escape with the loot!)
🔥 WHY THIS HEIST WILL WORK?
✅ BULLISH BREAKOUT – Price ready to explode!
✅ SMART PULLBACKS – Sneaky entries for max gains!
✅ LAYERED LIMITS – Lower average cost, bigger profits!
✅ THIEF’S RISK MANAGEMENT – SL protects your bag!
⚠ THIEF’S ALERT:
📉 NEWS CAN TRAP YOU! – Avoid trading during high-impact news!
🔒 USE TRAILING SL! – Lock profits & run before the cops (bears) come!
💥 BOOST THIS TRADE & JOIN THE HEIST!
👉 LIKE 👍 | 🔄 SHARE 🔗 | 💬 COMMENT 🚀
💖 SUPPORT THE THIEF SQUAD – MORE HEISTS COMING!
🤑 SEE YOU AT THE TARGET, FELLOW THIEVES! 🏴☠️💰
AAVE/USDT – Symmetrical Triangle Squeeze on 4HAAVE/USDT – Symmetrical Triangle Squeeze on 4H
Chart Pattern: Symmetrical Triangle
Timeframe: 4-Hour
Published: June 20, 2025
AAVE/USDT is currently consolidating within a symmetrical triangle. Price is respecting the rising support near the 243–245 zone, while being squeezed by a descending resistance around 263–265. This pattern typically leads to a breakout as volatility compresses.
Bullish Scenario
Entry: On a 4H candle close above 265 with volume
Target 1: 278
Target 2: 290
Stop-loss: Below 242
Bearish Scenario
Entry: Close below 243
Target 1: 230
Target 2: 215
Stop-loss: Above 260
Let the breakout confirm with strong volume before taking a position. Patience is key as AAVE approaches the apex of this formation.

#AAVE/USDT#AAVE
The price is moving within a descending channel on the 1-hour frame and is expected to break and continue upward.
We have a trend to stabilize above the 100 moving average once again.
We have a downtrend on the RSI indicator that supports the upward move with a breakout.
We have a support area at the lower limit of the channel at 268, acting as strong support from which the price can rebound.
Entry price: 277
First target: 285
Second target: 296
Third target: 307

AAVE BUYZONEAAVEUSDT is looking weak here, so we cant buy from here. Rather we can wait for SSL sweep and tap in Demand Zone and see reversal.
AAVEUSDT 📊The current price BINANCE:AAVEUSDT is trading in a range between 275 and 240 dollars, and it’s likely we’ll see a fake breakout to 300 dollars. After this move, the price is expected to correct to 240 dollars and then head for a bigger move toward 320 dollars and higher.
📈If the 240-dollar level breaks, the next support levels at 210 and 175 dollars should be watched.
🔼Support Levels: 240, 210, 175 dollars
🔽Resistance Levels: 275, 300, 320 dollars

AAVEUSDT Analysis: Retracement Opportunity AAVEUSDT has been trending upward without significant retracement for a long time. With a 63% volume/market cap ratio , any meaningful retracement could offer an excellent opportunity. At this point, I see no reason to ignore such a setup if it aligns with key demand zones. This is a Spot Buy.
Key Points:
Lack of Retracement: AAVEUSDT has been on a strong run without a pullback.
Volume/Market Cap Ratio: 63% indicates healthy liquidity and interest.
Retracement Potential: A good pullback could provide a favorable entry.
Confirmation Indicators: I will use CDV, liquidity heatmaps, volume profiles, volume footprints, and upward market structure breaks on lower time frames for validation.
Learn With Me: If you want to master how to use CDV, liquidity heatmaps, volume profiles, and volume footprints to pinpoint accurate demand zones, just DM me. I’d be happy to guide you!
Reminder: Be aware of the market's current state and approach it with caution. Successful trading relies on meaningful levels and robust confirmations.
If you think this analysis helps you, please don't forget to boost and comment on this. These motivate me to share more insights with you! Wishing everyone success in their trades.
If you think this analysis helps you, please don't forget to boost and comment on this. These motivate me to share more insights with you!
I keep my charts clean and simple because I believe clarity leads to better decisions.
My approach is built on years of experience and a solid track record. I don’t claim to know it all, but I’m confident in my ability to spot high-probability setups.
If you would like to learn how to use the heatmap, cumulative volume delta and volume footprint techniques that I use below to determine very accurate demand regions, you can send me a private message. I help anyone who wants it completely free of charge.
My Previous Analysis
🐶 DOGEUSDT.P: Next Move
🎨 RENDERUSDT.P: Opportunity of the Month
💎 ETHUSDT.P: Where to Retrace
🟢 BNBUSDT.P: Potential Surge
📊 BTC Dominance: Reaction Zone
🌊 WAVESUSDT.P: Demand Zone Potential
🟣 UNIUSDT.P: Long-Term Trade
🔵 XRPUSDT.P: Entry Zones
🔗 LINKUSDT.P: Follow The River
📈 BTCUSDT.P: Two Key Demand Zones
🟩 POLUSDT: Bullish Momentum
🌟 PENDLEUSDT.P: Where Opportunity Meets Precision
🔥 BTCUSDT.P: Liquidation of Highly Leveraged Longs
🌊 SOLUSDT.P: SOL's Dip - Your Opportunity
🐸 1000PEPEUSDT.P: Prime Bounce Zone Unlocked
🚀 ETHUSDT.P: Set to Explode - Don't Miss This Game Changer
🤖 IQUSDT: Smart Plan
⚡️ PONDUSDT: A Trade Not Taken Is Better Than a Losing One
💼 STMXUSDT: 2 Buying Areas
🐢 TURBOUSDT: Buy Zones and Buyer Presence
🌍 ICPUSDT.P: Massive Upside Potential | Check the Trade Update For Seeing Results
🟠 IDEXUSDT: Spot Buy Area | %26 Profit if You Trade with MSB
📌 USUALUSDT: Buyers Are Active + %70 Profit in Total
🌟 FORTHUSDT: Sniper Entry +%26 Reaction
🐳 QKCUSDT: Sniper Entry +%57 Reaction
I stopped adding to the list because it's kinda tiring to add 5-10 charts in every move but you can check my profile and see that it goes on..

AAVE/USDT – First Support in the Blue BoxI’ve been watching AAVE/USDT for a minute and there’s one zone I’m eyeing — that blue box. Moving in before you see real proof down there is a fast track to getting stopped out. Picture price drifting into that area, you buy on hope alone, and then it slices through without warning. That’s how shorts hunt liquidity and leave you scrambling.
What I need to see before I pull the trigger is clear confirmation: a CDV-volume spike that shows smart money stepping in, a quick low-timeframe break below then reclaim that zone, even an order-flow flip with aggressive bids coming in. Anything less, and I’m happy to stay on the sidelines. When that setup finally lights up — the volume lines up with the CDV divergence, the chart on the one- or five-minute frame prints a break-and-retest, and order flow shifts to the buy side — that’s when I lean in. Miss it if you want, but when it fires, waiting too long feels a lot worse than being a bit early.
📌I keep my charts clean and simple because I believe clarity leads to better decisions.
📌My approach is built on years of experience and a solid track record. I don’t claim to know it all but I’m confident in my ability to spot high-probability setups.
📌If you would like to learn how to use the heatmap, cumulative volume delta and volume footprint techniques that I use below to determine very accurate demand regions, you can send me a private message. I help anyone who wants it completely free of charge.
🔑I have a long list of my proven technique below:
🎯 ZENUSDT.P: Patience & Profitability | %230 Reaction from the Sniper Entry
🐶 DOGEUSDT.P: Next Move
🎨 RENDERUSDT.P: Opportunity of the Month
💎 ETHUSDT.P: Where to Retrace
🟢 BNBUSDT.P: Potential Surge
📊 BTC Dominance: Reaction Zone
🌊 WAVESUSDT.P: Demand Zone Potential
🟣 UNIUSDT.P: Long-Term Trade
🔵 XRPUSDT.P: Entry Zones
🔗 LINKUSDT.P: Follow The River
📈 BTCUSDT.P: Two Key Demand Zones
🟩 POLUSDT: Bullish Momentum
🌟 PENDLEUSDT.P: Where Opportunity Meets Precision
🔥 BTCUSDT.P: Liquidation of Highly Leveraged Longs
🌊 SOLUSDT.P: SOL's Dip - Your Opportunity
🐸 1000PEPEUSDT.P: Prime Bounce Zone Unlocked
🚀 ETHUSDT.P: Set to Explode - Don't Miss This Game Changer
🤖 IQUSDT: Smart Plan
⚡️ PONDUSDT: A Trade Not Taken Is Better Than a Losing One
💼 STMXUSDT: 2 Buying Areas
🐢 TURBOUSDT: Buy Zones and Buyer Presence
🌍 ICPUSDT.P: Massive Upside Potential | Check the Trade Update For Seeing Results
🟠 IDEXUSDT: Spot Buy Area | %26 Profit if You Trade with MSB
📌 USUALUSDT: Buyers Are Active + %70 Profit in Total
🌟 FORTHUSDT: Sniper Entry +%26 Reaction
🐳 QKCUSDT: Sniper Entry +%57 Reaction
📊 BTC.D: Retest of Key Area Highly Likely
📊 XNOUSDT %80 Reaction with a Simple Blue Box!
📊 BELUSDT Amazing %120 Reaction!
📊 Simple Red Box, Extraordinary Results
I stopped adding to the list because it's kinda tiring to add 5-10 charts in every move but you can check my profile and see that it goes on..

#AAVE #AAVEUSD #AAVEUSDT #Analysis #Eddy#AAVE #AAVEUSD #AAVEUSDT #Analysis #Eddy
As can be seen in the chart, the price has moved towards the supply area with a compression and has formed the 3-drive and can fall from the indicated supply area towards the daily demand zone.
I have identified the important supply and demand zones of the daily timeframe for you.
This analysis is based on a combination of different styles, including the volume style with the ict style.
Based on your strategy and style, get the necessary confirmations for this analysis to enter the trade.
Don't forget about risk and capital management.
The responsibility for the transaction is yours and I have no responsibility for your failure to comply with your risk and capital management.
💬 Note: Stop losses behind the supply and demand zones are usually hunted by market makers. Be careful of stop hunts and do not enter a trade without getting confirmation and without having a proper trading setup.
Be successful and profitable.

AAVEUSDT to head towards weekly resistance around 200The price has bounced from weekly support WS1 and currently trading above it. The next resistance is weekly resistance WR1 sitting around 165-195 zone. The price is headed towards this zone and in coming days or weeks it is going to hit this zone. However, there should be some pullback there. The next resistance zone beyond WR1 is weekly resistance WR2 sitting around 235-255. It is possible that after having some pullback at WR1, the price will eventually break WR1 and aim for WR2. However, WR2 is going to be strong supply zone and will push the price down again. I see still a possibility for the price to come down from WR2 to test weekly support zone WS2. But thats quite far yet, therefore, lets stick to the movement till WR2 and then we reevaluate the price action based on the reaction when the price hits WR2.

AAVEUSDT 3DAAVE ~ 3D Analysis
#AAVE Buy back from here with a short -term target of at least 15% from here.

AAVEUSDT 3DAAVE ~ 3D Analysis
#AAVE Buy from this after successfully testing this support with a short -term target of at least 10%+.

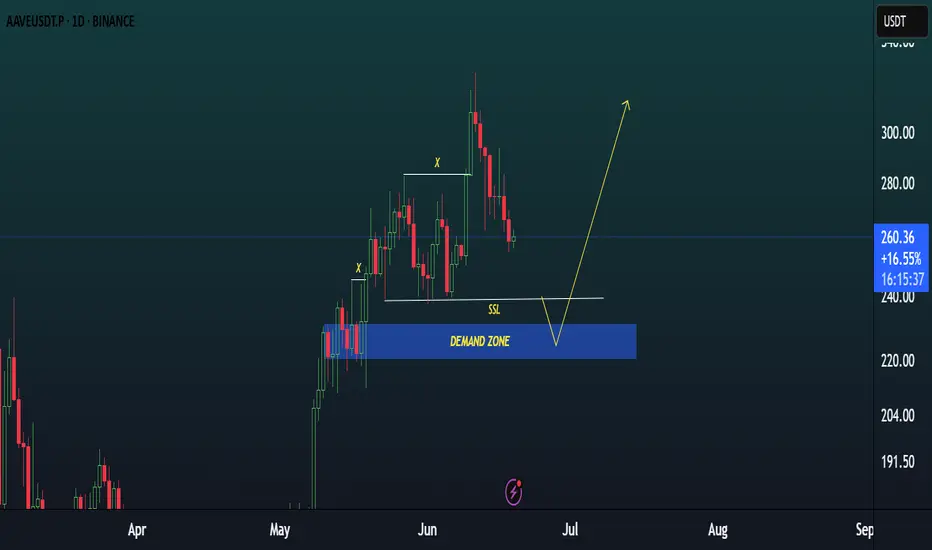
AAVEUSDT TRADE SETUPAAVEUSDT is in bullish trend, did bullish BOS marked as X. expecting a liquidity sweep below SSL and in OB+FVG area and then pump.

AAVEUSDT 1DAAVE ~ 1D Analysis
#AAVE Buy after successfully penetrating this resistant line with a short -term target of at least 15%+.

Buy and SellBuy and Sell Signal for AAVEUSDT
📌 Buy Signal:
Buy if the price breaks $267.
Stop-loss: $247
Bullish targets:
$284.23
$314.29
📌 Sell Signal:
Sell if the price breaks $246.
Stop-loss: $267
Bearish targets:
$229.58
$206.04
🔹 Risk Management: Considering support and resistance levels, an appropriate stop-loss should be set.

AAVE/USDT at the Brink Will the Wedge Breakout Spark ?This is a daily chart of AAVE/USDT, showing a symmetrical wedge or descending triangle pattern formi
Pattern Structure
The chart shows a series of lower highs and higher lows, confined within two converging trendlines.
The price is approaching the apex of the structure, suggesting a potential breakout soon.
Current Price Action
The price is near the upper trendline at $360.06, indicating a test of resistance.
There is a recent rejection at the upper boundary, suggesting sellers are defending this level.
Trend
This is occurring within a larger bearish context (from the visible left part of the chart), as indicated by the lower highs in the pattern.
Key Levels
Resistance Around $405, corresponding to the upper boundary of the pattern.
Support Around $265, the lower boundary of the pattern.
Breakout Levels
A breakout above $405 could signify bullish momentum, targeting levels such as $465 or beyond.
A breakdown below $265 would open up the potential for a bearish move, possibly targeting $205 or lower.
Trading Considerations
Breakout Potential
A breakout above the resistance trendline would need to be accompanied by strong volume to confirm bullish sentiment.
Similarly, a breakdown below the support trendline should be confirmed with high volume for bearish continuation.
Risk Management
If entering a position near these boundaries, stop-loss levels should be placed slightly beyond the opposite trendline to minimize risk.
False breakouts are common in wedge patterns, so monitoring retests of breakout levels is crucial.
Market Sentiment
The sentiment in the cryptocurrency market and any fundamental news related to AAVE may influence the next move.

57% pumpAAVE/USDT Chart Analysis 📊📈
Current Price Action:
The current price of AAVE/USDT is around $349.58. The price has been moving inside a symmetrical triangle pattern, indicating a potential breakout soon. 📉📈
Key Support Levels:
$293.23: Strong support zone that has held previously. 🛡️
Ascending Trendline: Price is respecting the upward trendline, suggesting bullish momentum. 📈
Key Resistance Levels:
$390.94: The next resistance level that needs to be broken for further upward movement. 🚧
$530.80: Major resistance target after a confirmed breakout. 🎯
Breakout Scenario:
A breakout above the $390.94 level could trigger a bullish rally towards $530.80, marking a potential 57% gain. 🚀📊
Technical Indicators:
Symmetrical triangle pattern forming. 📐
Price holding above the ascending trendline. 📈
Volume could confirm the breakout direction. 📊
Summary:
AAVE/USDT is approaching a critical breakout point. A successful breakout above $390.94 could lead to a bullish surge toward $530.80, while failure to hold the trendline support may see a retest of the $293.23 level. ✅
⚠️ Risk Management Tip: Always use stop-loss and manage risk accordingly!

AAVE to 400$📈 Trend: The chart shows an upward trend within a channel.
🛑 Resistance: Key levels appear around $200 (🔍 "Wait for break $200"), $251.69, and $360.28.
🟢 Support: The highlighted level at $175.55 acts as a significant support zone.
⚠️ Breakout Watch: A breakout above $200 could signal further upward momentum.
🔺 Targets: Next potential resistance levels after $200 are $251.69 and $360.28.
Summary: 🚀 Wait for confirmation of a breakout above $200 before entering a long position. If it holds, watch for movements toward the higher resistance levels. 🛡️ Protect against drops near $175.55.

AAVEUSDT TRADE IDEA. I will take entry in the marked ORDER BLOCK and will do DCA below marked DCA area.
