AAVE/USDT — Key Demand Reaction: Breakout or Another Rejection?On the 4D timeframe, AAVE’s movement against USDT still appears to be in a medium-term corrective phase after failing to maintain its previous higher high structure.
Price has just reacted from a strong demand zone that has repeatedly acted as a buyer defense area.
Key marked zones:
Demand / Support: 128 – 112 (yellow block)
Layered Resistances: 146 → 175 → 205 → 242 → 288 → 305 → 350
Market structure remains held below a descending trendline that has been pressing price since the last peak.
---
Pattern Formation
1. Descending Triangle / Falling Structure
The downward trendline connecting lower highs indicates:
Sellers are still dominant
Every rally gets rejected at lower levels
Distribution pressure is still ongoing
However, the 128–112 support base continues to hold → forming a descending triangle structure.
2. Multi Rejection Resistance Ladder
Resistance areas are stacked in layers:
Indicates distributed supply
Each level is a potential profit-taking zone
Breakout must occur step-by-step, not instantly
3. Strong Horizontal Demand
The yellow block represents historical demand:
Previously became the base of a major rally
High buying volume
Long wick reactions indicate absorption
---
Key Levels
Main Supports
128 – 112 → Key demand (current reaction zone)
95 → Minor support if breakdown occurs
70 → Extreme low liquidity zone
Main Resistances
146.5 → Nearest resistance + trendline test
175 → Mid resistance
205 → Break confirmation level
242 → Strong supply
288 – 305 → Distribution range
350 → Major macro resistance
---
Bullish Scenario
Bullish becomes valid if price can:
1. Hold above the 128 – 112 demand
2. Break the descending trendline
3. Close strongly above 146.5
If that happens, upside potential:
175 → First resistance
205 → Bullish structure shift
242 → Supply test
288 – 305 → Distribution zone
350 → Macro target
This structure would shift the market from:
Lower High → Higher High
Meaning a medium-term trend reversal could begin.
---
Bearish Scenario
Bearish activates if:
1. Price fails to break the trendline
2. Gets rejected at 146 – 175
3. Falls back below 128
Consequences:
Demand breakdown
Long position liquidations
Continued downside momentum
Downside targets:
112 → Last demand line
95 → Next support
70 → Extreme downside
If 112 breaks, structure shifts into:
Continuation Bearish Trend
---
Conclusion
Price is currently in a decision zone
128 – 112 demand is the buyer defense base
Descending trendline is the breakout key
Two major possibilities:
1. Trendline break → Gradual rally to 205 – 242 – 288
2. Rejection → Demand breakdown → Drop to 95 – 70
The market is in a compression phase before expansion.
Large moves typically occur after price exits triangle structures + demand bases like this.
#AAVE #AAVEUSDT #CryptoAnalysis #Altcoin #DeFi #TechnicalAnalysis #TradingViewIdeas #SupportResistance #TrendlineBreak #CryptoTrading #AltcoinAnalysis #BullishScenario #BearishScenario
Aaveusdtsignal

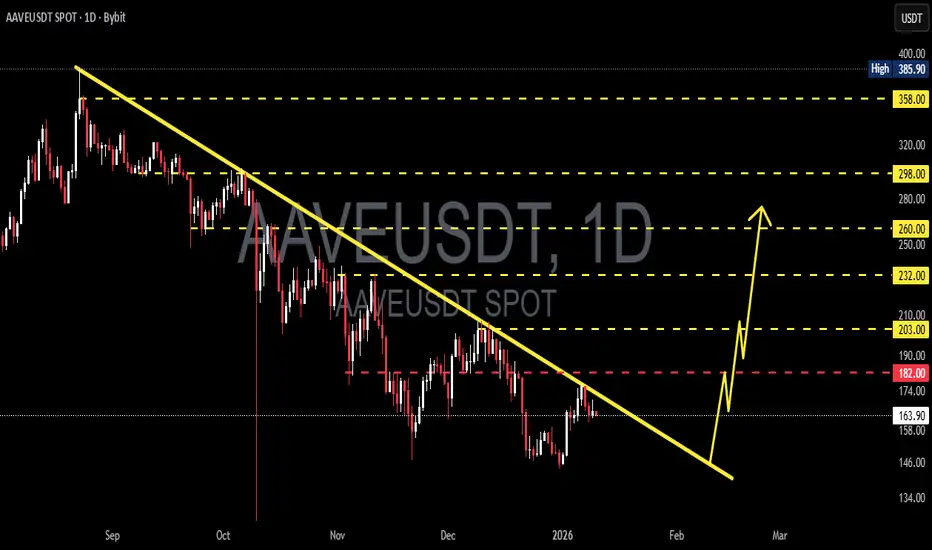
AAVE/USDT – Major Downtrend, Breakout or Another Rejection?On the daily timeframe, AAVE/USDT is still moving within a bearish market structure, with consistent selling pressure since the price peaked near the 385 USDT area. Price is currently trading below a descending trendline, which acts as a major dynamic resistance. As long as price remains below this trendline, sellers remain in control.
---
Chart Pattern (Pattern Explanation)
AAVE is forming a Descending Trendline (Bearish Structure), characterized by:
A series of lower highs since September
Multiple rejections along the descending trendline
Upward moves that appear corrective rather than impulsive
This pattern indicates that every rally is still considered a pullback unless a confirmed breakout occurs.
---
Key Levels
Resistance Levels:
182 USDT (minor resistance / rejection area)
203 USDT (mid resistance)
232 USDT (strong resistance)
260 USDT
298 USDT
358 USDT (major resistance & previous high)
Support Levels:
158 USDT (nearest support)
146 USDT (key support)
134 USDT (critical support, potential continuation to the downside)
---
Bullish Scenario
The bullish scenario becomes valid if:
Price breaks above and closes above the descending trendline
Followed by a successful break and hold above 182 – 203 USDT
Bullish targets:
203 USDT
232 USDT
260 USDT
298 USDT (extension target if momentum strengthens)
A valid breakout could signal the end of the bearish structure and open the door for a medium-term trend reversal.
---
Bearish Scenario
The bearish scenario remains dominant if:
Price gets rejected again at the descending trendline
Fails to reclaim the 182 USDT area
Breaks down below the 158 USDT support
Bearish targets:
146 USDT
134 USDT
A breakdown below 134 USDT would strengthen the case for a bearish continuation with increased selling pressure.
---
Conclusion
AAVE/USDT remains in a bearish trend, with the descending trendline acting as the key decision zone.
Trendline breakout → potential reversal
Rejection → bearish continuation
Waiting for clear confirmation is crucial before entering any position, supported by proper risk management.
---
#AAVE #AAVEUSDT #CryptoAnalysis #TechnicalAnalysis #Altcoin #Downtrend #BearishMarket #BullishBreakout #CryptoTrading #DeFi #PriceAction
AAVE/USDT — Critical Demand Zone 135–120: Reversal Signal?AAVE/USDT (3D) is developing a highly interesting structure after delivering a strong rebound from the major demand zone at 135–120, an area that has historically served as a large accumulation region for institutional players since 2023.
The long downward wick — clearly a liquidity sweep — shows how the market wiped out stop-losses beneath the zone before snapping back upward. This kind of wick is rarely random; it often signals smart money accumulation exactly where retail traders panic.
Still, despite the sharp recovery toward 180–190, the broader market structure remains in a pattern of Lower Highs, which means the medium-term trend is still technically bearish. AAVE is now positioned at a major inflection point: Is this the beginning of a structural reversal, or only a temporary bounce before another leg down?
---
🔵 Bullish Scenario — Reversal Begins Above 205
The bullish case gains real validity only if price can break and close above the 195–205 resistance cluster on the 3D timeframe.
A decisive breakout here would mark the first Higher High in months and potentially flip the trend.
If the breakout holds, upside targets include:
Target 1: 265–305 (major supply zone)
Target 2: 380–400 (macro swing high)
Target 3: 440+ if DeFi momentum expands
Key bullish confirmations:
Increasing buy volume during the breakout
Strong 3D candle close above 205
A clean retest of 195–205 turning into support
If these align, a full trend reversal becomes increasingly probable.
---
🔴 Bearish Scenario — Breakdown Below 120
The bearish case becomes dominant if price fails to defend the 135–120 demand block and instead closes firmly below 120 on the 3D timeframe.
If that happens, the mid-term downtrend likely resumes with the following targets:
Target 1: 99–84
Target 2: 70 (previous liquidity sweep low)
Target 3: 62 if capitulation expands
This scenario would suggest that the prior liquidity sweep was not a reversal signal but rather preparation for a deeper markdown phase.
---
📌 Key Patterns & Structural Notes
Liquidity Sweep: The long wick beneath the demand zone signals wiped-out liquidity and possible institutional absorption.
135–120 Demand Block: A crucial accumulation area that currently serves as the final defense for buyers.
Lower High Structure: Trend remains bearish until 205+ is reclaimed.
Range Market: Price is currently oscillating within a broader 120–225 range; a breakout of either side will determine the next macro move.
---
🎯 Final Summary
AAVE is now at one of its most important decision zones of the past year.
Break above 205 → bullish trend shift
Break below 120 → bearish continuation and deeper lows
Until one of these triggers is activated, AAVE remains in accumulation/consolidation mode, preparing for its next major directional move. Swing traders typically wait for one of these confirmations before entering large positions.
---
#AAVE #AAVEUSDT #CryptoAnalysis #PriceAction #TechnicalAnalysis #SupplyDemand #LiquiditySweep #DeFi #Altcoins #CryptoMarket

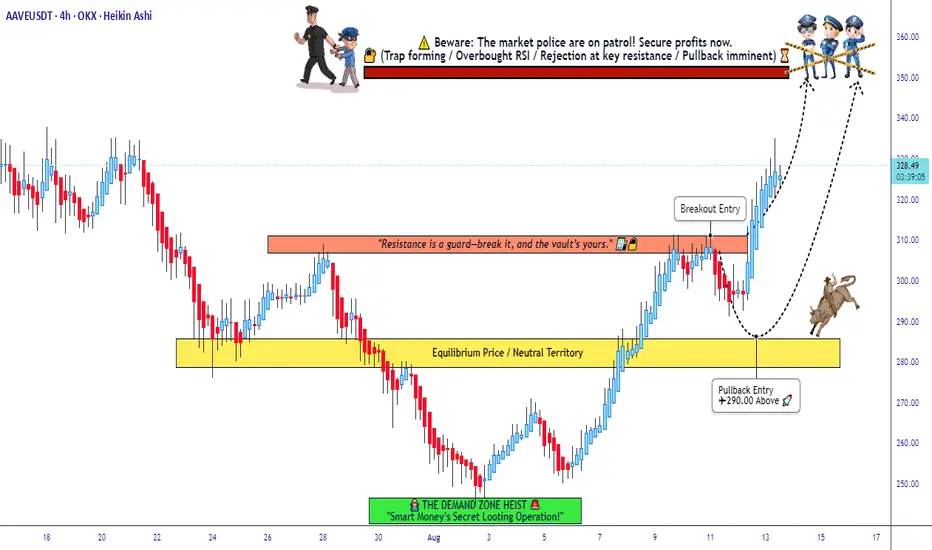
"The AAVE Heist Plan – Stealthy Entries, Big Exit!"🔥🤑 THIEF TRADER’S AAVE/USDT HEIST PLAN 🚀💰
Asset: AAVE/USDT
Plan: BULLISH HEIST 🚀📈
🎯 ENTRY STRATEGY (THIEF STYLE):
✔ BREAKOUT ENTRY: 310.00 (Aggressive heist!)
✔ PULLBACK ENTRY: 290.00 (Safe & sneaky!)
💎 THIEF’S LAYERING STRATEGY (MULTIPLE LIMIT ORDERS):
🔹 295.00 (First dip grab!)
🔹 290.00 (Second loot!)
🔹 288.00 (Third steal!)
🔹 282.00 (Final robbery!)
(Add more layers if you're a PRO thief!)
⛔ STOP LOSS (THIEF’S SAFE ESCAPE):
📍 266.00 (OG Thief SL!)
⚠ LADIES & GENTLEMEN THIEVES: Adjust SL based on your risk & strategy!
🎯 TARGET: 350.00 (Time to escape with the loot!)
🔥 WHY THIS HEIST WILL WORK?
✅ BULLISH BREAKOUT – Price ready to explode!
✅ SMART PULLBACKS – Sneaky entries for max gains!
✅ LAYERED LIMITS – Lower average cost, bigger profits!
✅ THIEF’S RISK MANAGEMENT – SL protects your bag!
⚠ THIEF’S ALERT:
📉 NEWS CAN TRAP YOU! – Avoid trading during high-impact news!
🔒 USE TRAILING SL! – Lock profits & run before the cops (bears) come!
💥 BOOST THIS TRADE & JOIN THE HEIST!
👉 LIKE 👍 | 🔄 SHARE 🔗 | 💬 COMMENT 🚀
💖 SUPPORT THE THIEF SQUAD – MORE HEISTS COMING!
🤑 SEE YOU AT THE TARGET, FELLOW THIEVES! 🏴☠️💰
AAVEUSDT 3DAAVE ~ 3D Analysis
#AAVE Buy back from here with a short -term target of at least 15% from here.

AAVEUSDT 3DAAVE ~ 3D Analysis
#AAVE Buy from this after successfully testing this support with a short -term target of at least 10%+.

AAVEUSDT 1DAAVE ~ 1D Analysis
#AAVE Buy after successfully penetrating this resistant line with a short -term target of at least 15%+.

Good time to buy AAVE!Hi fellow traders, AAVEUSDT is ready to make a move higher from the blue box after completing the correction. Target the 434.8021 level. Good luck and trade safe!

AAVE Analysis and Long Trade SetupGo through the analysis carefully, and do trade accordingly.
Trade Setup
AAVE
(114.56-109.6)
Long
Lev 5x
SL 4h below 108
Tp: 117/120/123/128
Best of luck
Never risk more than 1% of the principal to follow any position.
Please support us by liking and sharing the post.

AAVEUSDT 1DAAVE ~ 1D
#AAVE This Chart is very interesting, But all the AltCoin movements are waiting for the Big movement $BTC.

AAVEUSDT 1WAAVE ~ 1W
#AAVE Bouncing Right on this Confluence of Support.
Start making purchases again gradually with a short-term target of at least 20%+

AAVE/USDT It possible breakout and continue upward movement!💎 Paradisers, #AAVE is indeed a coin worth monitoring closely.
💎 Currently, AAVE is facing resistance around 98.15. Upon reviewing the chart, it appears to be in an accumulation phase, indicating potential bullish momentum if AAVE successfully breaks out of the resistance and the descending resistance simultaneously.
💎 Such a breakout could lead to significant upward movement, possibly testing our target strong resistance area.
💎 However, if AAVE fails to break the descending resistance and experiences a rejection with a bearish candle, this could signal a potential downturn. In this scenario, the price may retreat to retest the support around 79, initiating another significant downward momentum.
💎 Historically, the price has consistently bounced each time it hit the support of the accumulation phase. Therefore, if AAVE revisits this zone, there's potential for a reversal. However, if it fails to bounce and even breaks down below the support, it may head towards the key support area.
💎 In the event of an upward scenario, if AAVE revisits the key support, it's crucial to reclaim the support around 79. Failure to do so, resulting in a break below the key support, would confirm bullish invalidation and likely lead to further downward movement.
MyCryptoParadise
iFeel the success🌴

AAVE/USDT Breakout the Key resistance area, Continue Upward!💎 AAVE has recently shown significant market dynamics by successfully breaking out of a key resistance area. This breakout suggests a bullish momentum, with the probability for further upward movement and a move towards our target area.
💎 However, it's crucial to monitor how AAVE behaves during its retest of the previous resistance, which is now acting as support.
💎 A bounce from this support area would confirm the validity of the breakout. Conversely, if AAVE fails to hold above this support level and breaks down below it, the breakout may be considered false.
💎 In the event of a breakdown below the support area, the price could retreat towards the demand area around $8, or even lower. This would indicate a reversal of the bullish momentum and a resumption of downward movement.

AAVE target 14612h time frame
-
AAVE broke the bottom triangle structure and currently retesting 0.618 Fibonacci Projection. There is a risk that keep retesting until 0.382 Fib, where price is around 73, so our SL need to avoid this scenario. If AAVE maintain pumping momentum, there are three targets.
TP: 126 / 146 / 168
SL: 70

AAVEUSDT Elliott Waves Analysis (LONGTERM)Hello friends.
Everything on the chart.
Targets: 250 - 500 - 800
MAIN TARGET ZONE: 750 - 1000$
after first target reached move ur stop to breakeven
Stop: (depending of ur risk). ALWAYS follow ur RM .
RR: 1 to 35
risk is justified
Good luck everyone!
Follow me on TRADINGView, if you don't want to miss my next analysis or signals.
It's not financial advice.
Dont Forget, always make your own research before to trade my ideas!
Open to any questions and suggestions

AAVE/USDT Broke the bearish pattern. Possible Downward momentum?💎 AAVE has undeniably attracted significant attention in the market. Currently, AAVE has validly broken out of the bearish flag pattern, indicating a bearish short-term momentum for AAVE. The ongoing process involves a retesting phase at the support trendline of the bearish flag, aiming to continue the downward movement.
💎 The target for the downward movement in AAVE is the demand area ranging from $77 to $74. In this zone, AAVE is anticipated to bounce back, resuming its upward trajectory, as the mid-term movement remains bullish, increasing the probability of reaching our target major supply area.
💎 The bad scenario is confirmed if, during the retesting phase at the demand area of $77 - $74, AAVE fails to manage the zone and experiences a breakdown. Should this occur, AAVE will revert to bearish movement, potentially retracing to the next lower demand area or even the strong support zone.

AAVE cryptocurrency - LONG trade. #15Hello colleagues!
We continue to publish our potential trades and today we have a potential short-term speculation.
The AAVE cryptocurrency is holding up very well on the local drop in Bitcoin and the medium-term upward trend for AAVE is not over yet:
As we can see on the 6-hour timeframe , the AAVE price has reached an important range from which a global correction may begin. But for now, we are interested in speculation on the 30-minute timeframe.
The key liquid zone for the local growth of the AAVE price is the range of $62.25-62.75. If the AAVE price falls below this liquid zone, a lot of buyer stop orders that are hidden behind each local low may be triggered:
If this happens, it will be logical to buy AAVE at $56-57 at the earliest.
Therefore, our local trade will have a fairly short stop loss, which, in our opinion, is quite fair.
AAVE short-term long
Enter = $62.25-62.75
Stop = 61.792 (- 1.01%)
TP1 = 64.10 (+2.71%)
TP2 = 65.08 (+ 4.31%)
P/L ratio = 4.26
P.S. We have also shown a potential short position on the chart. However, we do not place limit orders, as buyers can easily update local highs and only then start a correction:
We need to watch and make a decision at the moment of the $65 retest.
What do you think, will the trade work out? Write in the comments and we will check how many people were right!

AAVEUSDT at monthly resistance, retrace to weekly support likelyThe price hit the confluence of monthly and weekly resistance. This resistance is definitely strong one and usually will not give the way so easy in the first attempt. We see that the price got rejected from this resistance and landed on the daily support for a bounce towards that resistance again. The price is pulling back again from there and heading towards daily support. The probability of this daily support holding the price for long is not that high and I expect that the price will head towards weekly support WS1. We shall observe a good bounce in case price reaches there. WS2 is the weekly support level which marked the low of june 2022, dec 2022 and june 2023. That support has provided very good price bounce/reversal although with diminishing returns on subsequent bounces/reversals. Anyways that support is far away and just for explanation purpose I have added so that in case in the future if price reaches there, it would be again a good long opportunity. But for the time being, I expect the price to reach WS1 level and bounce from there.

AAVE is going to hit 8412h time frame
-
AAVE has potential to create a rising structure to hit 84.
Then retest 70 and continue to pump to 95.
-
Entry: 61.5
TP: 84, 95
SL: 56.95

AAVEUSDT Elliott Waves AnalysisHello friends.
Please support my work by clicking the LIKE button👍(If you liked). Also i will appreciate for ur activity. Thank you!
Everything on the chart. (update)
Nothing has changed from my last idea, we got correction like a expect, now i waiting for continuation of growth.
Entry: market and lower
Target: 100 - 120 - and maybe even 150(not sure)
after first target reached move ur stop to breakeven
Stop: ~64 agreesive, 52 conservative. (depending of ur risk). ALWAYS follow ur RM .
Risk/Reward: 1 to ~4
risk is justified
Good luck everyone!
Follow me on TRADINGView, if you don't want to miss my next analysis or signals.
It's not financial advice.
Dont Forget, always make your own research before to trade my ideas!
Open to any questions and suggestions.

AAVEUSDT Elliott Waves AnalysisHello friends.
Please support my work by clicking the LIKE button👍(If you liked). Also i will appreciate for ur activity. Thank you!
Everything on the chart.
minimal target it's ~150$ zone, if will be zigzag(abc). If we will forming upward movement then even ~250$ is possible.
Entry: market and lower
Target: 140 - 200 - (~250)
after first target reached move ur stop to breakeven
Stop: ~50 (depending of ur risk). ALWAYS follow ur RM .
Risk/Reward: 1 to 11
risk is justified
Good luck everyone!
Follow me on TRADINGView, if you don't want to miss my next analysis or signals.
It's not financial advice.
Dont Forget, always make your own research before to trade my ideas!
Open to any questions and suggestions.

AAVEUSD - AAVEUSDT Idea!AAVEUSD | AAVEUSDT
✅ ✅ Risk warning, disclaimer: the above is a personal market judgment and analysis based on published information and historical chart data on The trading view,
And only some of these analyzes are my actual real trades.
I hope Traders consider I am Not responsible for your trades and investment decision.

AAVE - Buying SignalBYBIT:AAVEUSDT.P
1H time frame
-
Price broke out 90 again, which is the long-term changed zone of R/S.
We can regard it as a bullish signal here and plan strategy with good RRR.
-
Entry: 90
TP: 93.5, 97, 101
SL: 87
